| Param | Original file | Final file |
|---|---|---|
| Filename | modeM0/AS1C07_001T08_9000005190_36339cztM0_level2.evt | modeM0/AS1C07_001T08_9000005190_36339cztM0_level2_quad_clean.evt |
| Size (bytes) | 458,447,040 | 81,768,960 |
| Size | 437.2 MB | 78.0 MB |
| Events in quadrant A | 2,759,162 | 523,553 |
| Events in quadrant B | 3,854,418 | 513,130 |
| Events in quadrant C | 2,924,935 | 531,830 |
| Events in quadrant D | 3,947,361 | 497,696 |
| Mode M9 | |||
|---|---|---|---|
| Quadrant | BADHDUFLAG | Total packets | Discarded packets |
| A | 0 | 13 | 0 |
| B | 0 | 13 | 0 |
| C | 0 | 13 | 0 |
| D | 0 | 13 | 0 |
| Mode M0 | |||
|---|---|---|---|
| Quadrant | BADHDUFLAG | Total packets | Discarded packets |
| A | 0 | 12081 | 2 |
| B | 0 | 15404 | 1 |
| C | 0 | 12382 | 1 |
| D | 0 | 15937 | 1 |
| Mode SS | |||
|---|---|---|---|
| Quadrant | BADHDUFLAG | Total packets | Discarded packets |
| A | 0 | 120 | 0 |
| B | 0 | 120 | 0 |
| C | 0 | 120 | 0 |
| D | 0 | 120 | 0 |
| Quadrant | Total seconds | Saturated seconds | Saturation percentage |
|---|---|---|---|
| A | 5861 | 10 | 0.170619% |
| B | 5861 | 273 | 4.657908% |
| C | 5861 | 13 | 0.221805% |
| D | 5861 | 192 | 3.275891% |
Noise dominated data is calculated using 1-second bins in cleaned event files. If a bin has >2000 counts, and if more than 50% of those come from <1% of pixels, then it is considered to be noise-dominated and hence unusable.
| Quadrant | # 1 sec bins | Bins with >0 counts | Bins with >2000 counts | High rate bins dominated by noise | Noise dominated (total time) | Noise dominated (detector-on time) | Marked lightcurve |
|---|---|---|---|---|---|---|---|
| A | 7174 | 5862 | 2 | 2 | 0.03% | 0.03% | 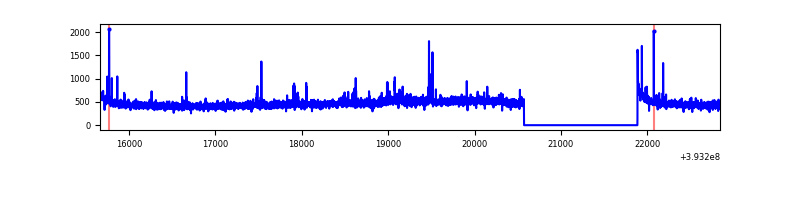 |
| B | 7174 | 5862 | 230 | 230 | 3.21% | 3.92% | 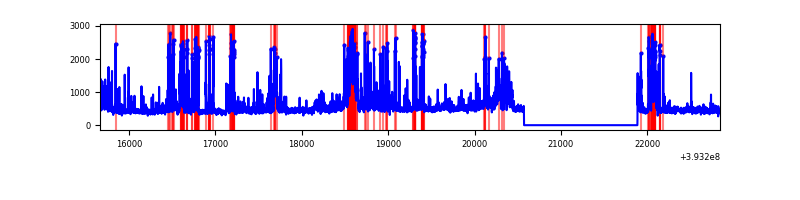 |
| C | 7174 | 5862 | 8 | 8 | 0.11% | 0.14% | 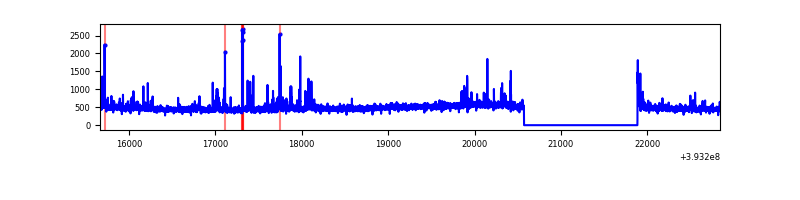 |
| D | 7174 | 5862 | 199 | 199 | 2.77% | 3.39% | 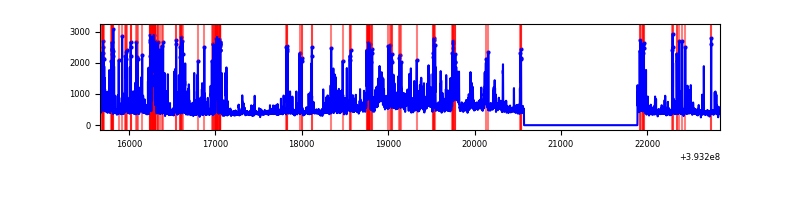 |
Top three noisy pixels from each quadrant. If the there are fewer than three noisy pixels in the level2.evt file, extra rows are filled as -1
| Pixel properties | Quadrant properties | ||||||
|---|---|---|---|---|---|---|---|
| Quadrant | DetID | PixID | Counts | Sigma | Mean | Median | Sigma |
| A | 10 | 83 | 185725 | 1424.19 | 644 | 631 | 130.0 |
| A | 9 | 143 | 34714 | 262.25 | 644 | 631 | 130.0 |
| A | 12 | 189 | 20633 | 153.9 | 644 | 631 | 130.0 |
| B | 5 | 172 | 608811 | 5056.02 | 631 | 614 | 120.3 |
| B | 5 | 236 | 264106 | 2190.44 | 631 | 614 | 120.3 |
| B | 0 | 190 | 109512 | 905.28 | 631 | 614 | 120.3 |
| C | 15 | 214 | 254062 | 1727.76 | 634 | 639 | 146.7 |
| C | 0 | 207 | 150988 | 1025.03 | 634 | 639 | 146.7 |
| C | 0 | 10 | 36222 | 242.59 | 634 | 639 | 146.7 |
| D | 12 | 6 | 579137 | 3788.03 | 623 | 605 | 152.7 |
| D | 12 | 235 | 368392 | 2408.14 | 623 | 605 | 152.7 |
| D | 2 | 153 | 135906 | 885.9 | 623 | 605 | 152.7 |
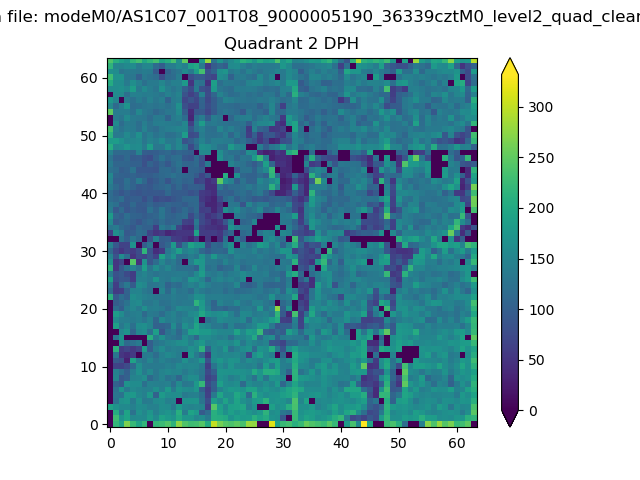
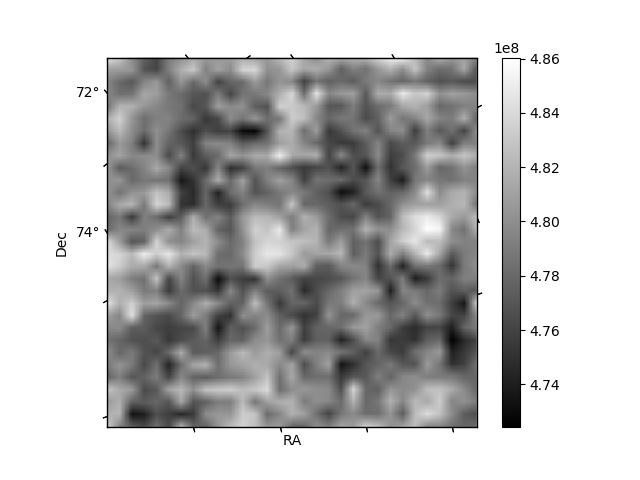
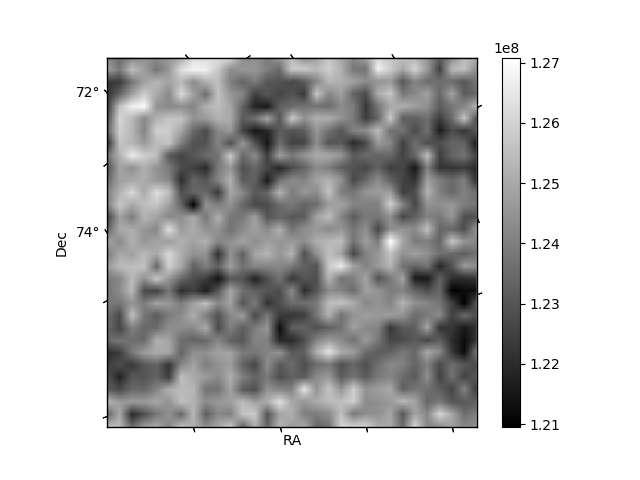
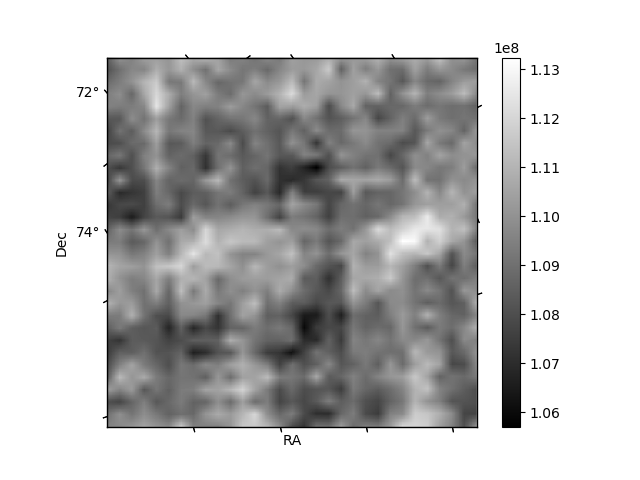
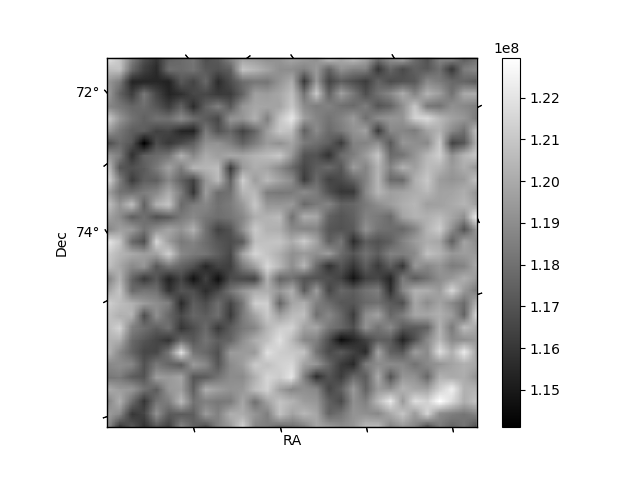
Histogram calculated using DETX and DETY for each event in the final _common_clean file
| Quadrant A | 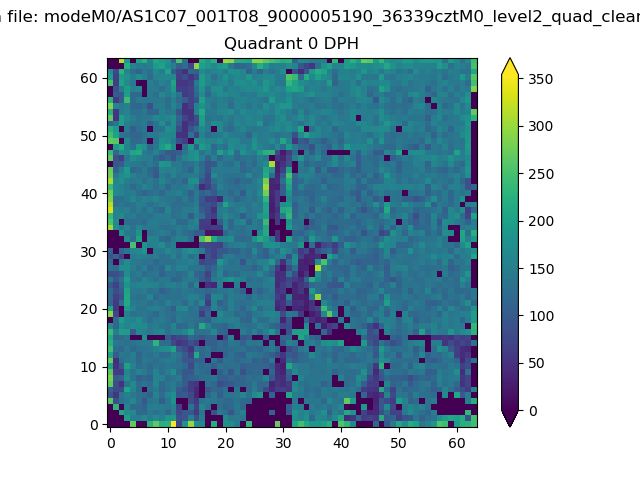 |
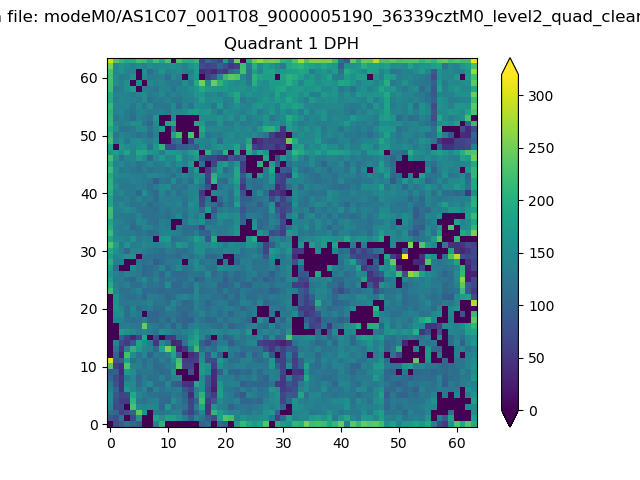 |
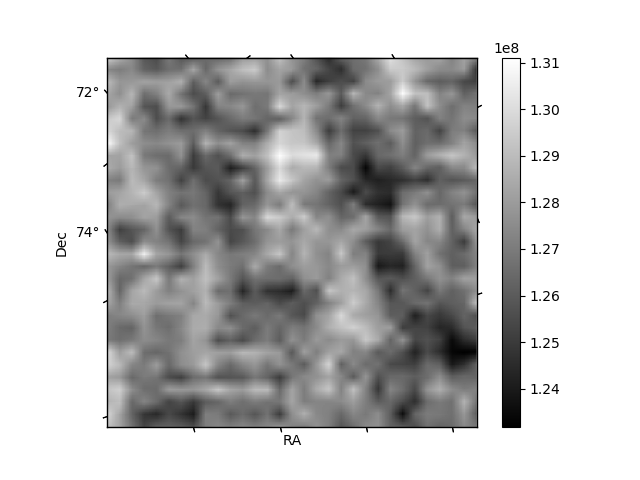
Quadrant B |
|---|---|---|---|
| Quadrant D | 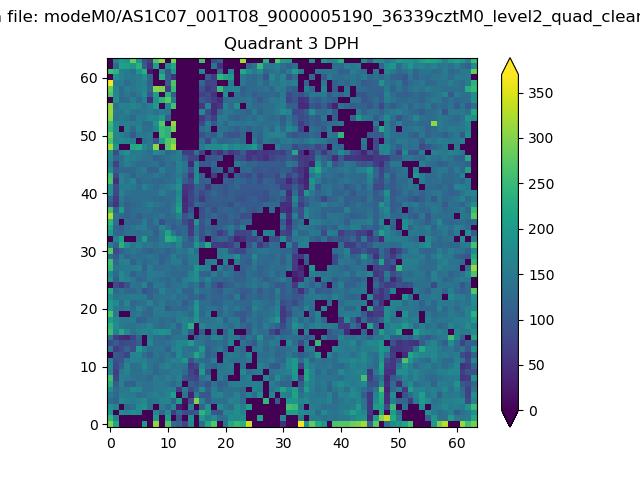 |
 |
Quadrant C |
| Plot type | Count rate plots | Images |
|---|---|---|
| Comparison with Poisson distribution Blue bars denote a histogram of data divided into 1 sec bins. Red curve is a Poisson curve with rate = median count rate of data. |
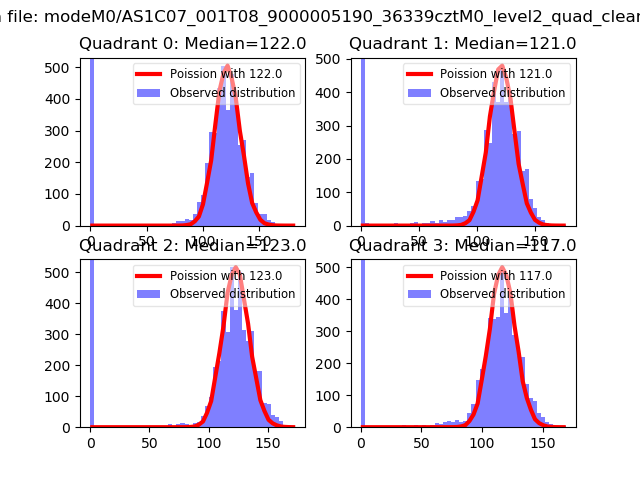 |
 |
| Quadrant-wise count rates Data is divided into 100 sec bins |
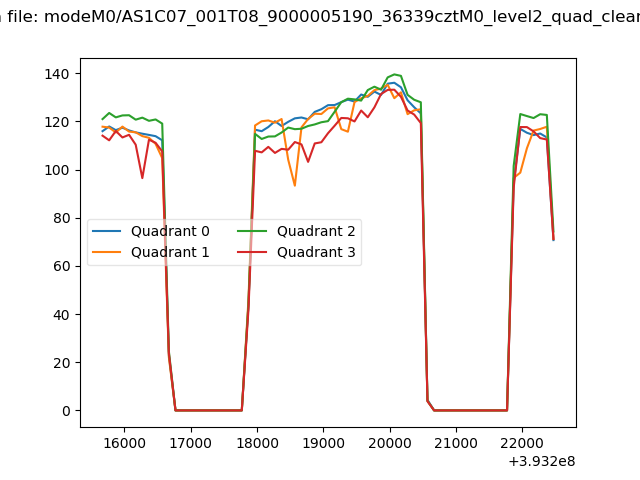 |
|
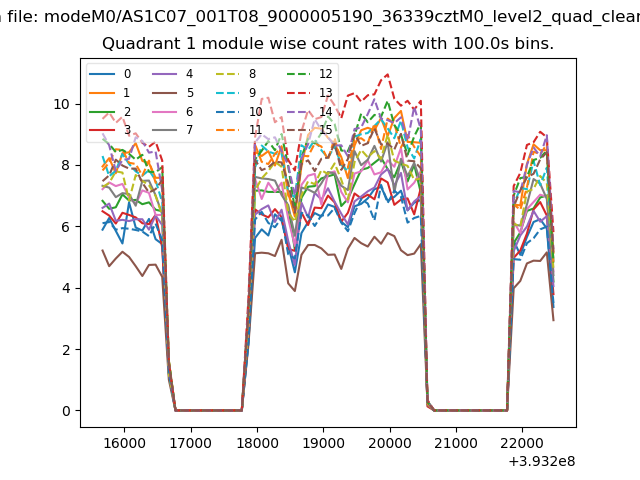
| Module-wise count rates for Quadrant A Data is divided into 100 sec bins |
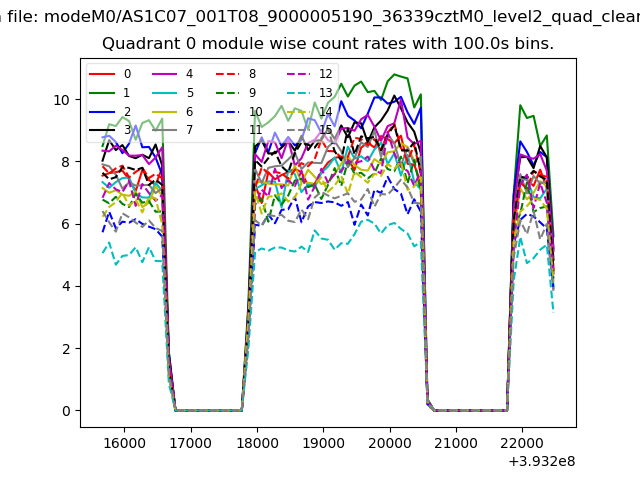 |
 |
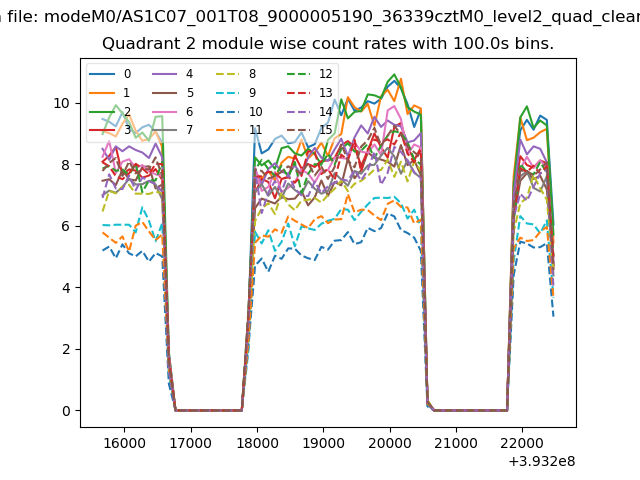
| Module-wise count rates for Quadrant B Data is divided into 100 sec bins |
 |
 |
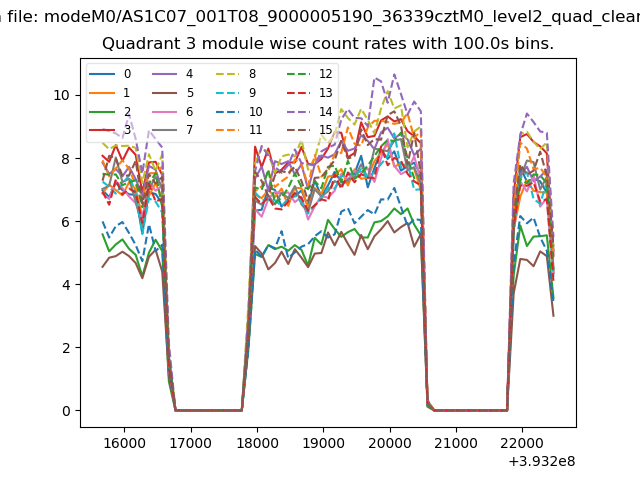
| Module-wise count rates for Quadrant C Data is divided into 100 sec bins |
 |
 |
| Module-wise count rates for Quadrant D Data is divided into 100 sec bins |
 |
 |
| Parameter | Plot |
|---|---|
| CZT HV Monitor | 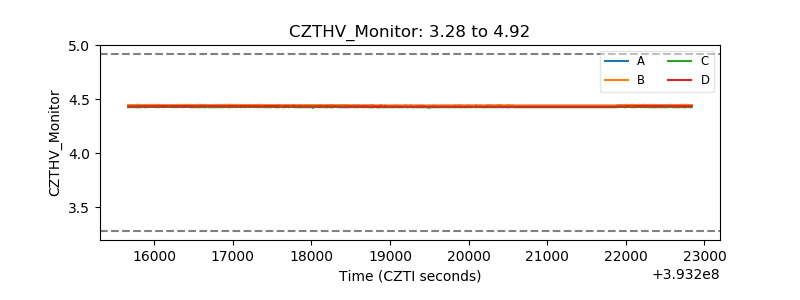 |
| D_VDD | 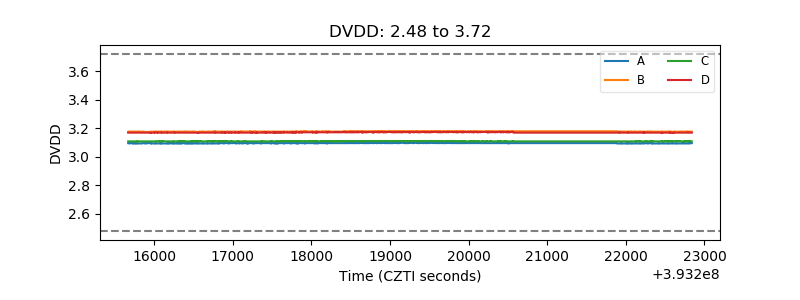 |
| Temperature 1 | 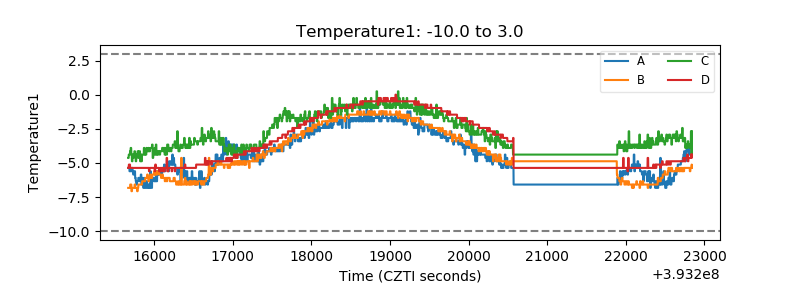 |
| Veto HV Monitor | 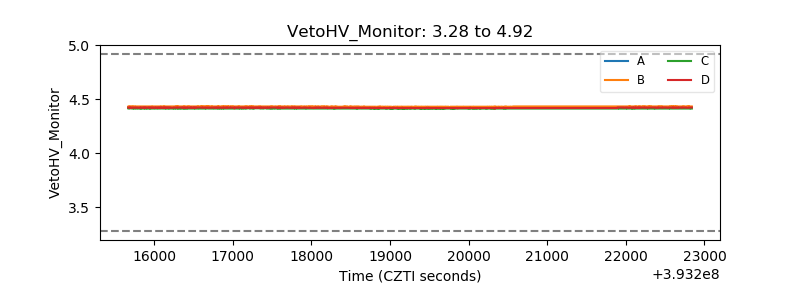 |
| Veto LLD | 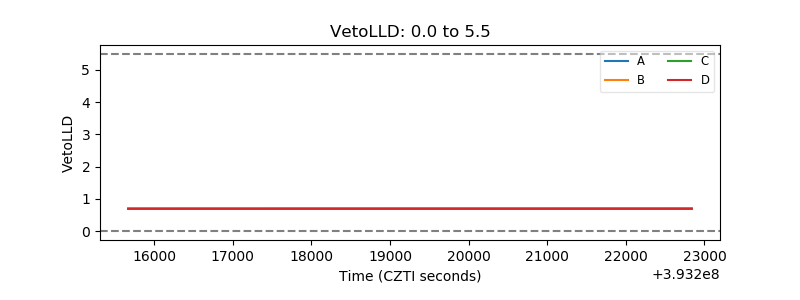 |
| Alpha Counter | 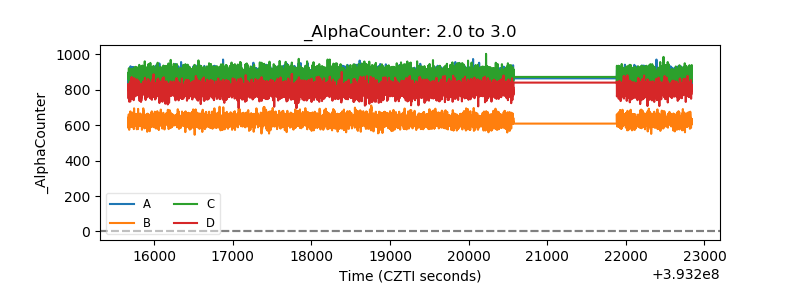 |
| _CPM_Rate | 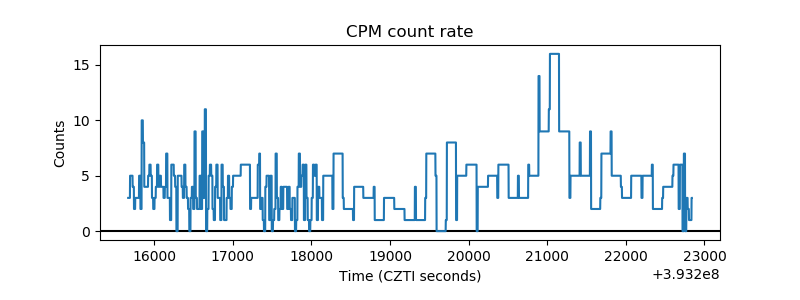 |
| CZT Counter | 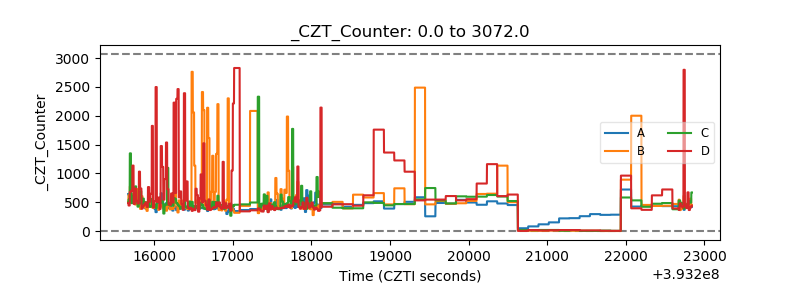 |
| +2.5 Volts monitor | 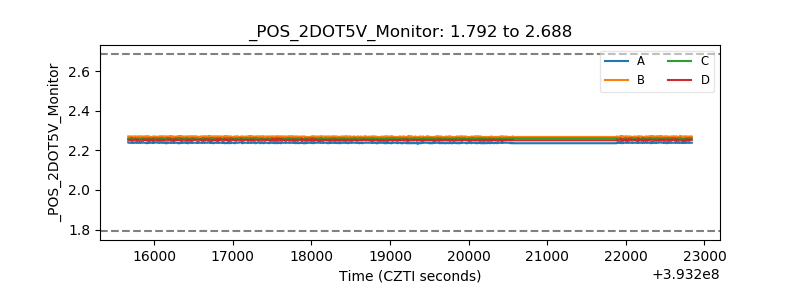 |
| +5 Volts monitor | 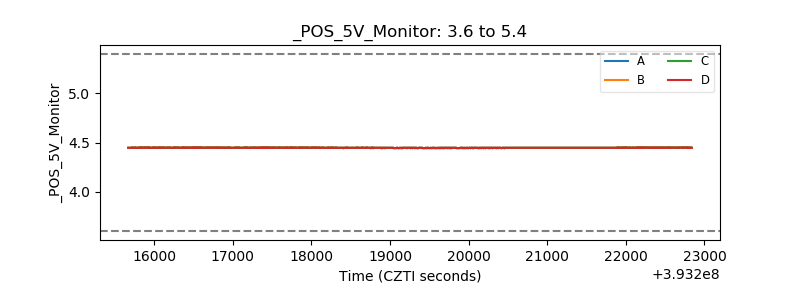 |
| _ROLL_ROT | 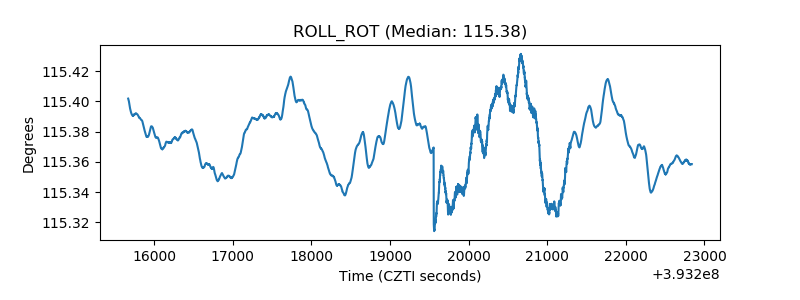 |
| _Roll_DEC | 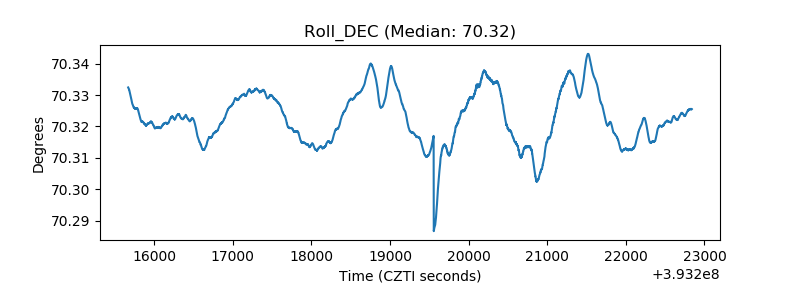 |
| _Roll_RA | 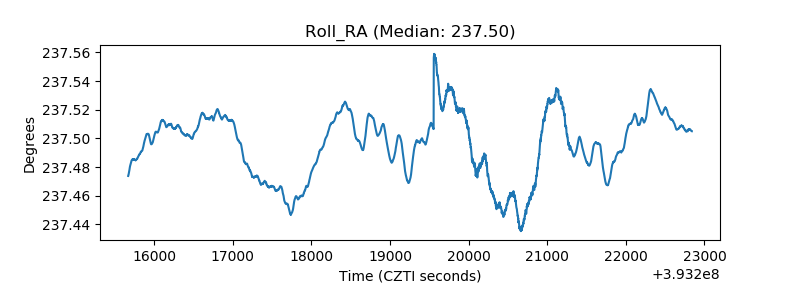 |
| Veto Counter | 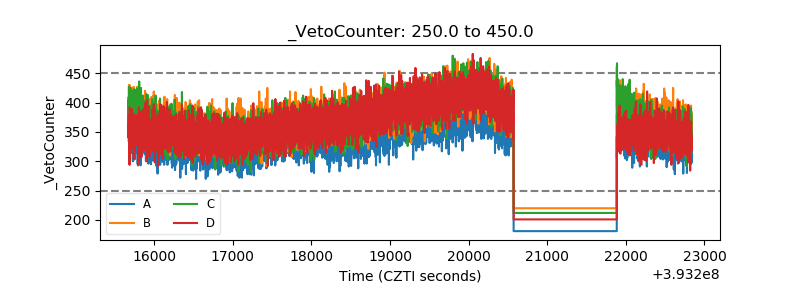 |