| Param | Original file | Final file |
|---|---|---|
| Filename | modeM0/AS1C07_001T08_9000005190_36338cztM0_level2.evt | modeM0/AS1C07_001T08_9000005190_36338cztM0_level2_quad_clean.evt |
| Size (bytes) | 448,542,720 | 85,268,160 |
| Size | 427.8 MB | 81.3 MB |
| Events in quadrant A | 2,736,767 | 552,086 |
| Events in quadrant B | 3,873,793 | 538,640 |
| Events in quadrant C | 3,050,089 | 557,592 |
| Events in quadrant D | 3,530,906 | 529,839 |
| Mode M9 | |||
|---|---|---|---|
| Quadrant | BADHDUFLAG | Total packets | Discarded packets |
| A | 0 | 19 | 0 |
| B | 0 | 19 | 0 |
| C | 0 | 19 | 0 |
| D | 0 | 20 | 0 |
| Mode M0 | |||
|---|---|---|---|
| Quadrant | BADHDUFLAG | Total packets | Discarded packets |
| A | 0 | 12004 | 3 |
| B | 0 | 15559 | 2 |
| C | 0 | 12735 | 2 |
| D | 0 | 14529 | 2 |
| Mode SS | |||
|---|---|---|---|
| Quadrant | BADHDUFLAG | Total packets | Discarded packets |
| A | 0 | 118 | 0 |
| B | 0 | 118 | 0 |
| C | 0 | 118 | 0 |
| D | 0 | 118 | 0 |
| Quadrant | Total seconds | Saturated seconds | Saturation percentage |
|---|---|---|---|
| A | 5776 | 11 | 0.190443% |
| B | 5776 | 317 | 5.488227% |
| C | 5776 | 51 | 0.882964% |
| D | 5776 | 167 | 2.891274% |
Noise dominated data is calculated using 1-second bins in cleaned event files. If a bin has >2000 counts, and if more than 50% of those come from <1% of pixels, then it is considered to be noise-dominated and hence unusable.
| Quadrant | # 1 sec bins | Bins with >0 counts | Bins with >2000 counts | High rate bins dominated by noise | Noise dominated (total time) | Noise dominated (detector-on time) | Marked lightcurve |
|---|---|---|---|---|---|---|---|
| A | 7148 | 5777 | 6 | 6 | 0.08% | 0.10% | 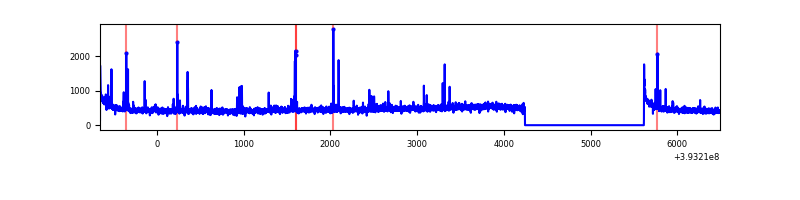 |
| B | 7148 | 5777 | 210 | 210 | 2.94% | 3.64% | 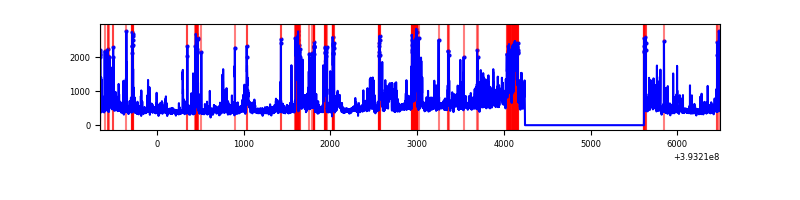 |
| C | 7148 | 5777 | 37 | 37 | 0.52% | 0.64% |  |
| D | 7148 | 5777 | 173 | 173 | 2.42% | 2.99% | 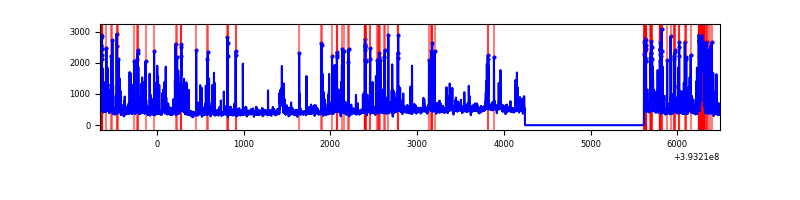 |
Top three noisy pixels from each quadrant. If the there are fewer than three noisy pixels in the level2.evt file, extra rows are filled as -1
| Pixel properties | Quadrant properties | ||||||
|---|---|---|---|---|---|---|---|
| Quadrant | DetID | PixID | Counts | Sigma | Mean | Median | Sigma |
| A | 10 | 83 | 194783 | 1519.58 | 631 | 616 | 127.8 |
| A | 9 | 143 | 80332 | 623.87 | 631 | 616 | 127.8 |
| A | 13 | 254 | 10405 | 76.61 | 631 | 616 | 127.8 |
| B | 5 | 172 | 639926 | 5424.24 | 615 | 597 | 117.9 |
| B | 5 | 236 | 304211 | 2575.94 | 615 | 597 | 117.9 |
| B | 0 | 190 | 258930 | 2191.77 | 615 | 597 | 117.9 |
| C | 15 | 214 | 250220 | 1727.17 | 619 | 622 | 144.5 |
| C | 0 | 10 | 177416 | 1223.38 | 619 | 622 | 144.5 |
| C | 0 | 207 | 177041 | 1220.79 | 619 | 622 | 144.5 |
| D | 12 | 6 | 635762 | 4288.21 | 610 | 594 | 148.1 |
| D | 13 | 249 | 163025 | 1096.62 | 610 | 594 | 148.1 |
| D | 2 | 250 | 126950 | 853.07 | 610 | 594 | 148.1 |
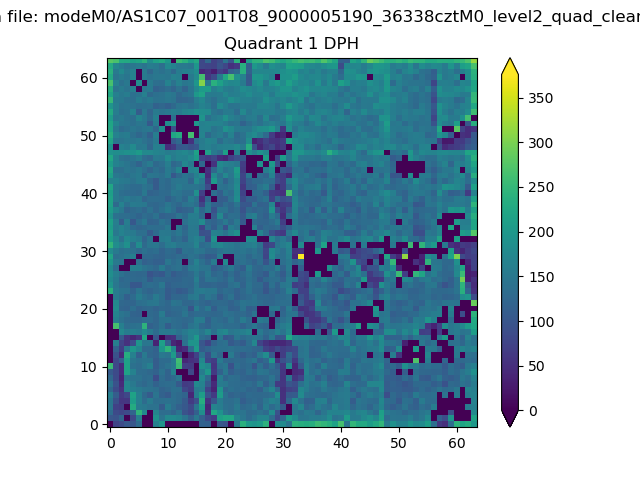
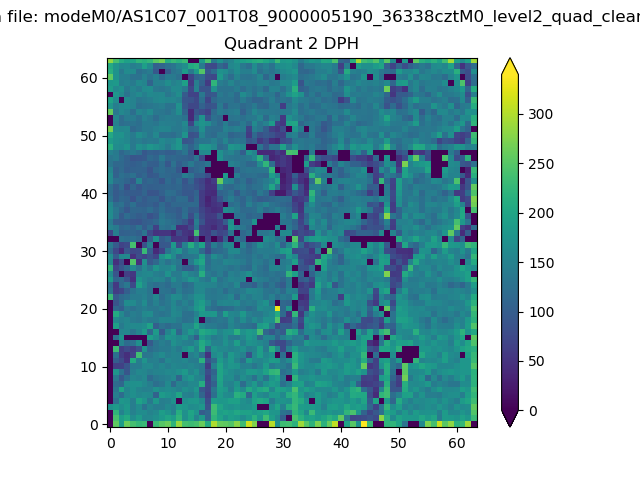
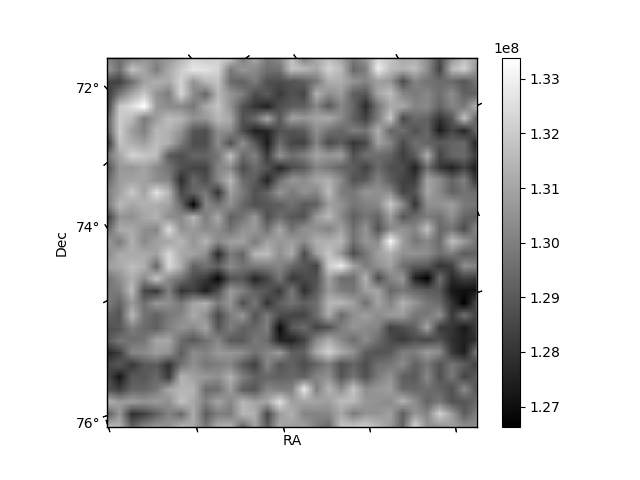
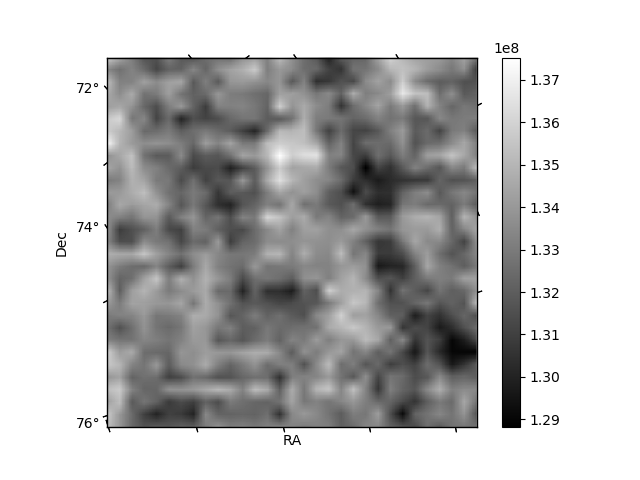
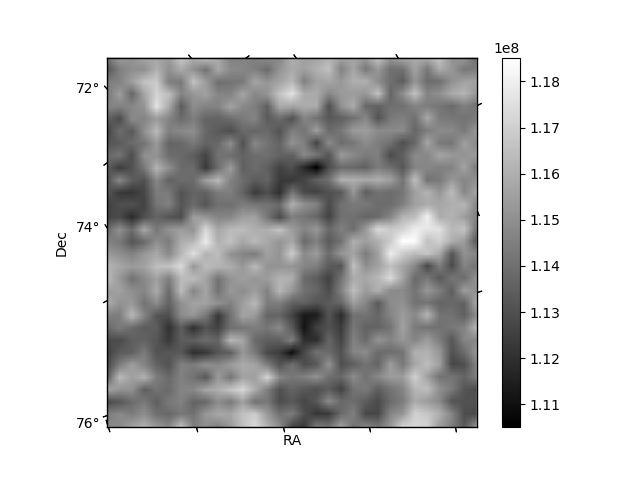
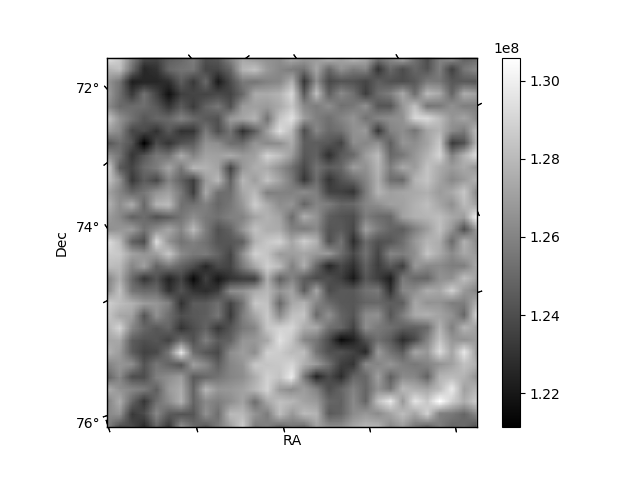
Histogram calculated using DETX and DETY for each event in the final _common_clean file
| Quadrant A | 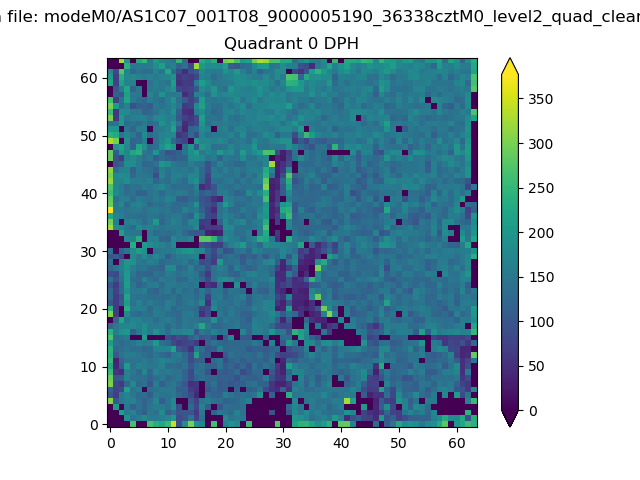 |
 |
Quadrant B |
|---|---|---|---|
| Quadrant D | 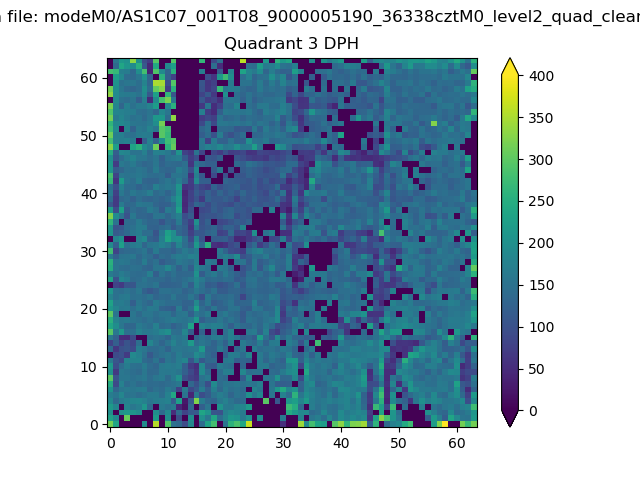 |
 |
Quadrant C |
| Plot type | Count rate plots | Images |
|---|---|---|
| Comparison with Poisson distribution Blue bars denote a histogram of data divided into 1 sec bins. Red curve is a Poisson curve with rate = median count rate of data. |
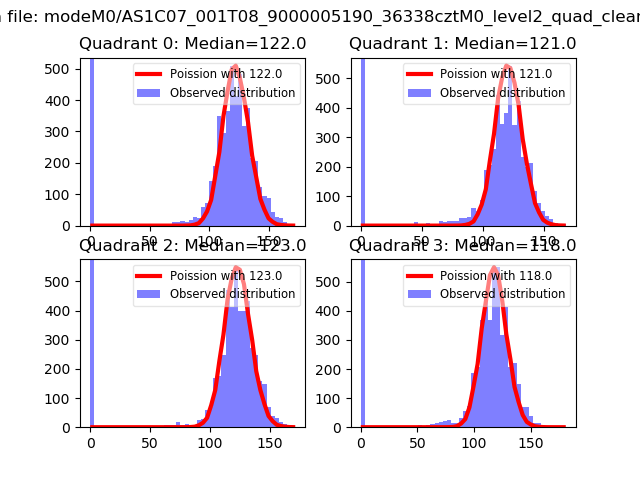 |
 |
| Quadrant-wise count rates Data is divided into 100 sec bins |
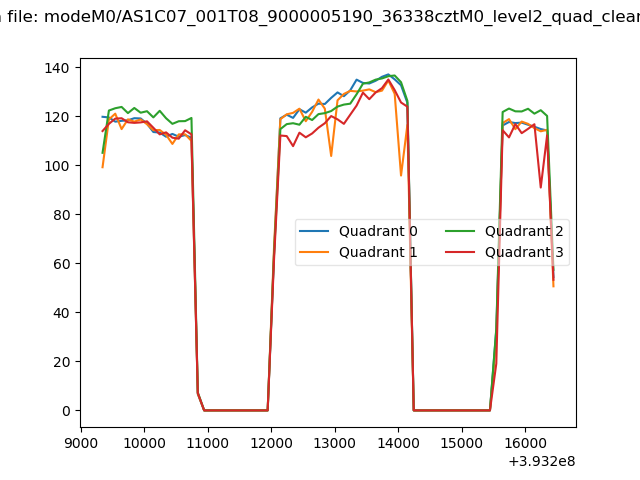 |
|
| Module-wise count rates for Quadrant A Data is divided into 100 sec bins |
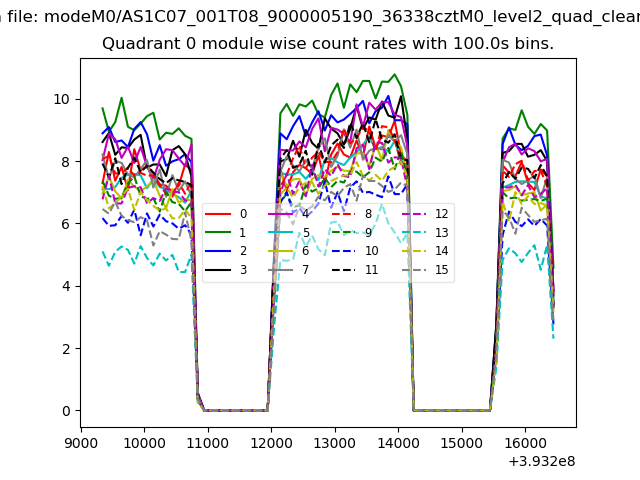 |
 |
| Module-wise count rates for Quadrant B Data is divided into 100 sec bins |
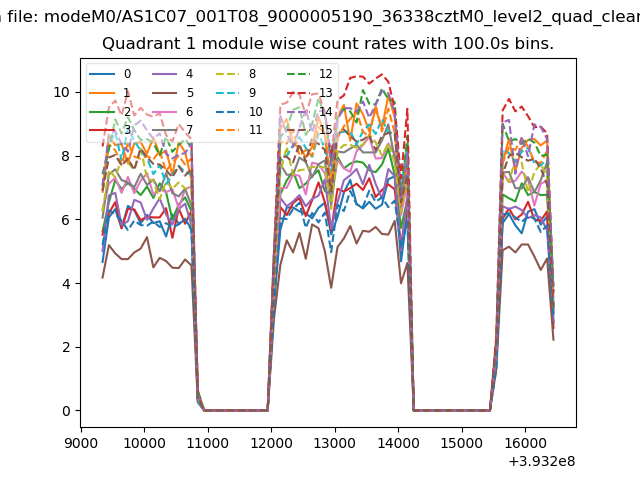 |
 |
| Module-wise count rates for Quadrant C Data is divided into 100 sec bins |
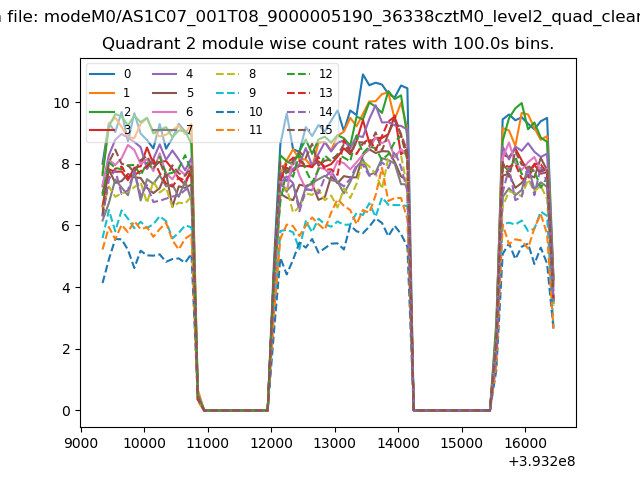 |
 |
| Module-wise count rates for Quadrant D Data is divided into 100 sec bins |
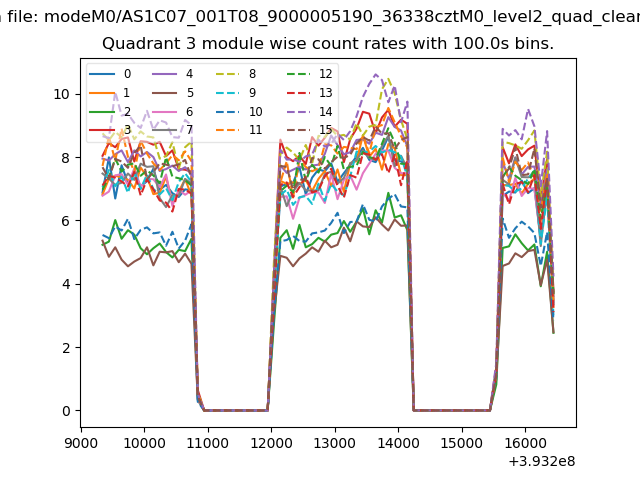 |
 |
| Parameter | Plot |
|---|---|
| CZT HV Monitor |  |
| D_VDD | 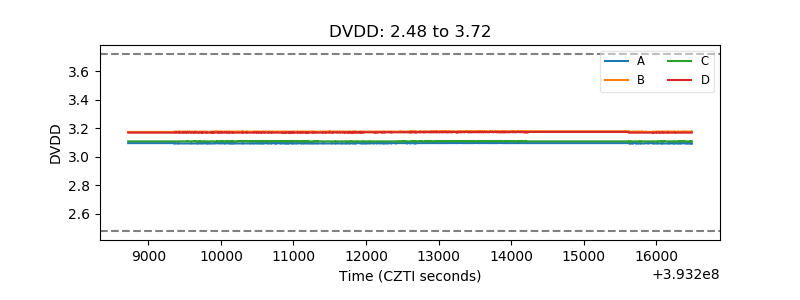 |
| Temperature 1 | 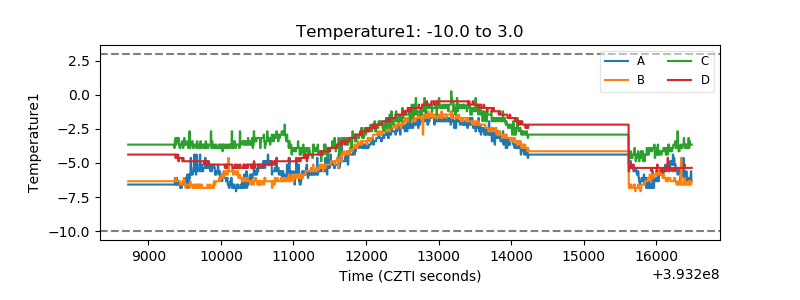 |
| Veto HV Monitor | 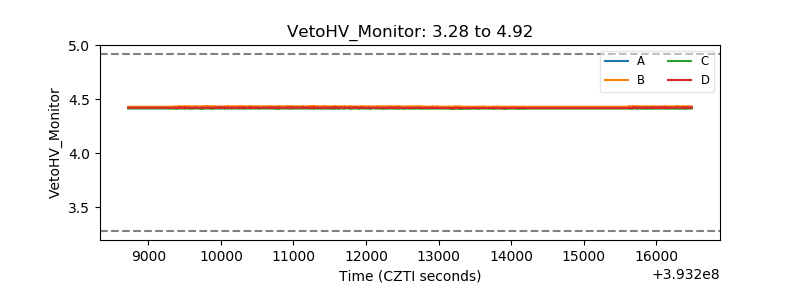 |
| Veto LLD | 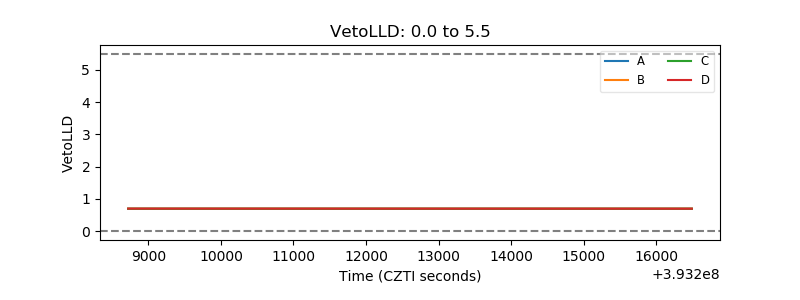 |
| Alpha Counter | 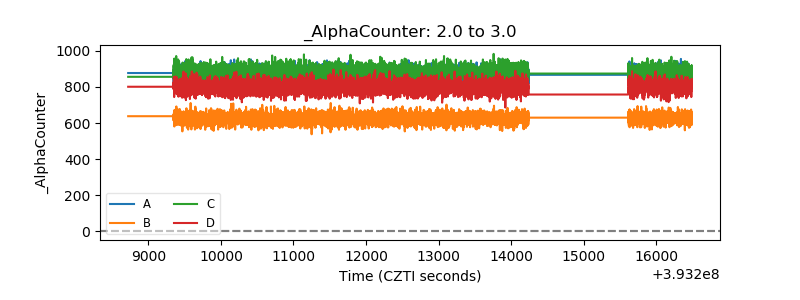 |
| _CPM_Rate | 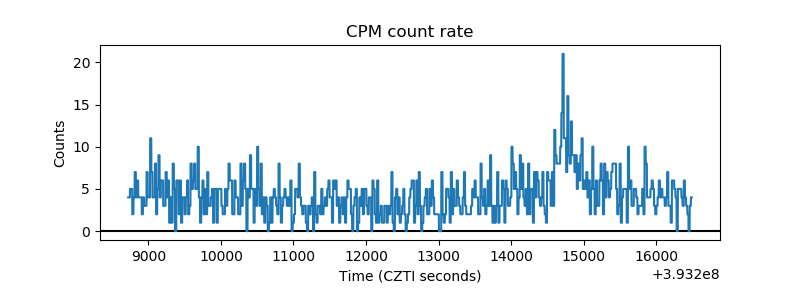 |
| CZT Counter | 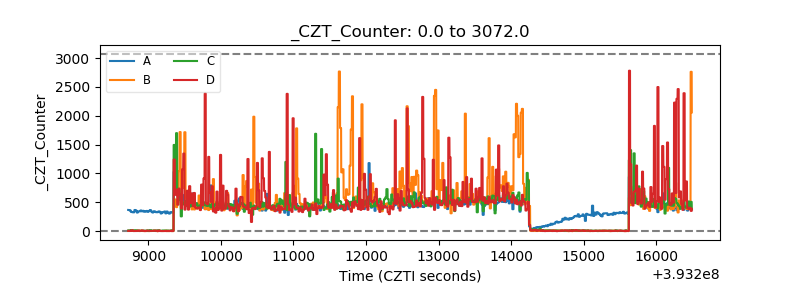 |
| +2.5 Volts monitor | 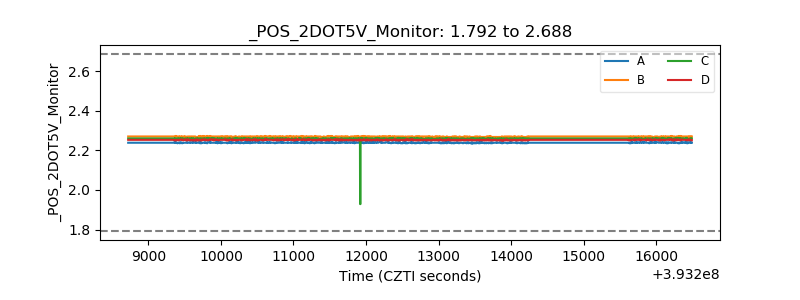 |
| +5 Volts monitor | 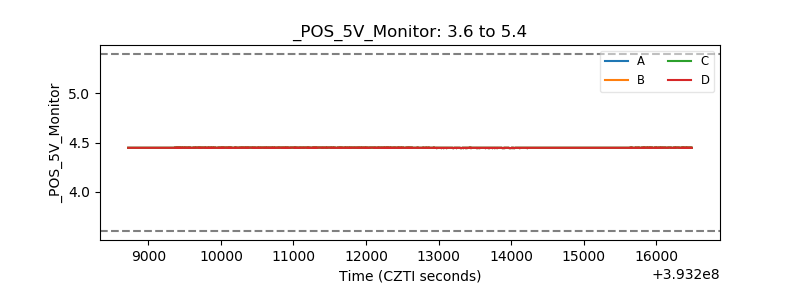 |
| _ROLL_ROT | 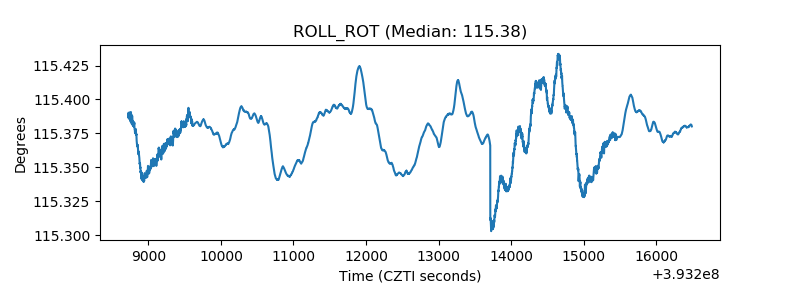 |
| _Roll_DEC | 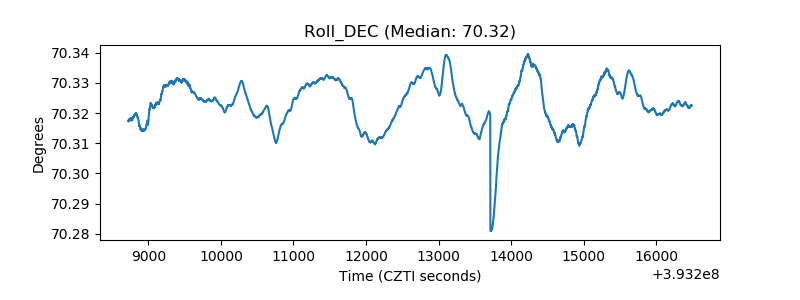 |
| _Roll_RA | 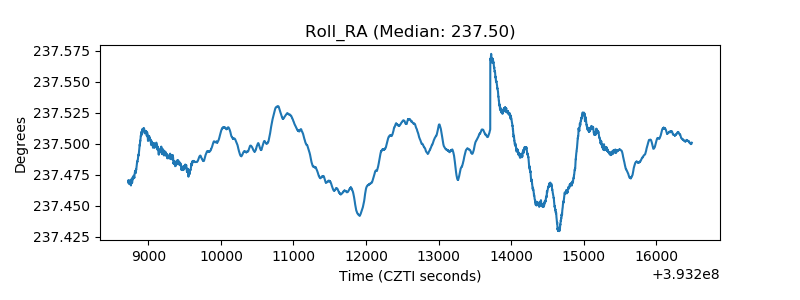 |
| Veto Counter | 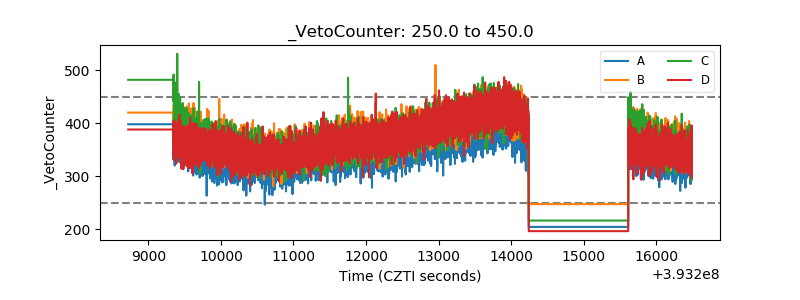 |