| Param | Original file | Final file |
|---|---|---|
| Filename | modeM0/AS1A11_097T17_9000005194_36364cztM0_level2.evt | modeM0/AS1A11_097T17_9000005194_36364cztM0_level2_quad_clean.evt |
| Size (bytes) | 399,715,200 | 64,327,680 |
| Size | 381.2 MB | 61.3 MB |
| Events in quadrant A | 2,479,640 | 404,528 |
| Events in quadrant B | 2,837,898 | 405,044 |
| Events in quadrant C | 2,741,394 | 410,013 |
| Events in quadrant D | 3,710,088 | 380,795 |
| Mode SS | |||
|---|---|---|---|
| Quadrant | BADHDUFLAG | Total packets | Discarded packets |
| A | 0 | 102 | 0 |
| B | 0 | 102 | 0 |
| C | 0 | 102 | 0 |
| D | 0 | 102 | 0 |
| Mode M0 | |||
|---|---|---|---|
| Quadrant | BADHDUFLAG | Total packets | Discarded packets |
| A | 0 | 10492 | 3 |
| B | 0 | 11616 | 2 |
| C | 0 | 11118 | 2 |
| D | 0 | 14320 | 2 |
| Mode M9 | |||
|---|---|---|---|
| Quadrant | BADHDUFLAG | Total packets | Discarded packets |
| A | 0 | 35 | 0 |
| B | 0 | 35 | 0 |
| C | 0 | 35 | 0 |
| D | 0 | 36 | 0 |
| Quadrant | Total seconds | Saturated seconds | Saturation percentage |
|---|---|---|---|
| A | 4946 | 14 | 0.283057% |
| B | 4946 | 97 | 1.961181% |
| C | 4946 | 62 | 1.253538% |
| D | 4946 | 269 | 5.438738% |
Noise dominated data is calculated using 1-second bins in cleaned event files. If a bin has >2000 counts, and if more than 50% of those come from <1% of pixels, then it is considered to be noise-dominated and hence unusable.
| Quadrant | # 1 sec bins | Bins with >0 counts | Bins with >2000 counts | High rate bins dominated by noise | Noise dominated (total time) | Noise dominated (detector-on time) | Marked lightcurve |
|---|---|---|---|---|---|---|---|
| A | 7069 | 4947 | 7 | 7 | 0.10% | 0.14% | 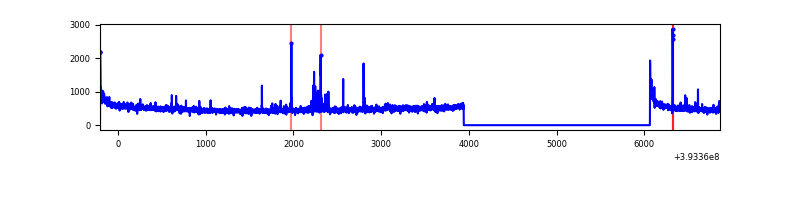 |
| B | 7069 | 4947 | 89 | 89 | 1.26% | 1.80% | 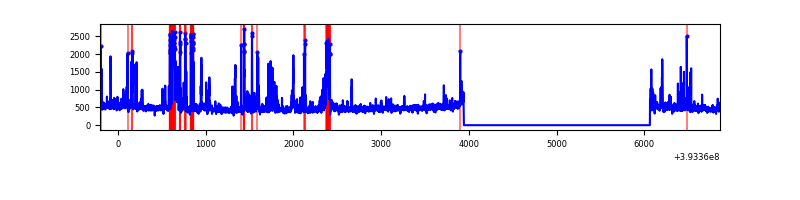 |
| C | 7069 | 4947 | 47 | 47 | 0.66% | 0.95% | 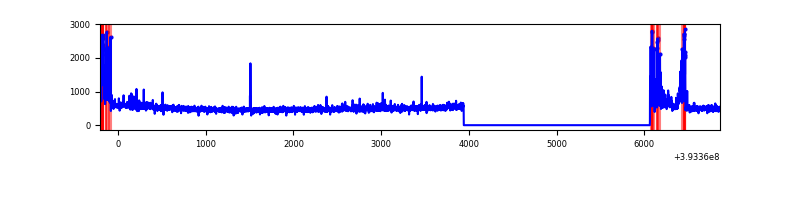 |
| D | 7069 | 4947 | 305 | 305 | 4.31% | 6.17% | 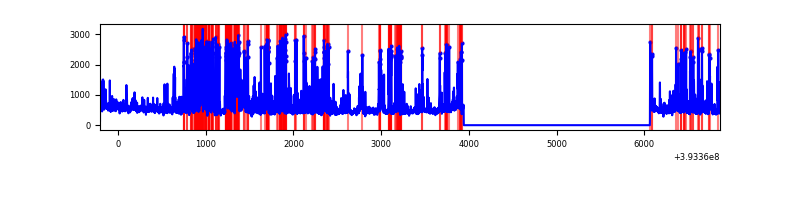 |
Top three noisy pixels from each quadrant. If the there are fewer than three noisy pixels in the level2.evt file, extra rows are filled as -1
| Pixel properties | Quadrant properties | ||||||
|---|---|---|---|---|---|---|---|
| Quadrant | DetID | PixID | Counts | Sigma | Mean | Median | Sigma |
| A | 10 | 83 | 177171 | 1549.53 | 571 | 561 | 114.0 |
| A | 9 | 143 | 62377 | 542.36 | 571 | 561 | 114.0 |
| A | 12 | 189 | 17236 | 146.3 | 571 | 561 | 114.0 |
| B | 5 | 172 | 406105 | 3773.6 | 565 | 550 | 107.5 |
| B | 5 | 236 | 72074 | 665.51 | 565 | 550 | 107.5 |
| B | 4 | 232 | 41110 | 377.4 | 565 | 550 | 107.5 |
| C | 0 | 10 | 229931 | 1752.08 | 562 | 567 | 130.9 |
| C | 15 | 214 | 215034 | 1638.28 | 562 | 567 | 130.9 |
| C | 0 | 207 | 106669 | 810.5 | 562 | 567 | 130.9 |
| D | 12 | 6 | 1045102 | 7875.11 | 547 | 534 | 132.6 |
| D | 13 | 249 | 141634 | 1063.77 | 547 | 534 | 132.6 |
| D | 2 | 249 | 109205 | 819.28 | 547 | 534 | 132.6 |
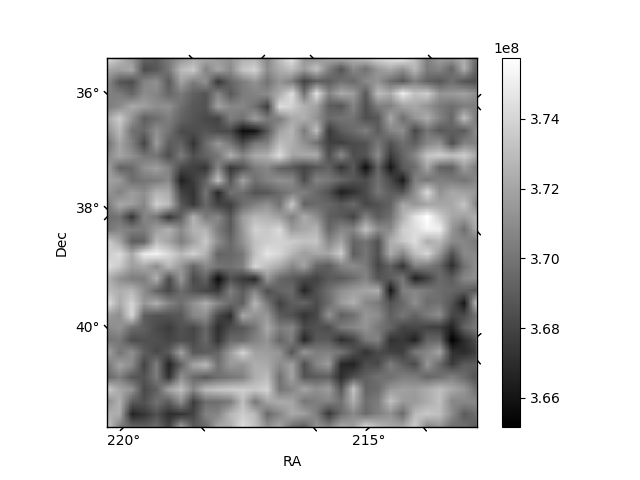
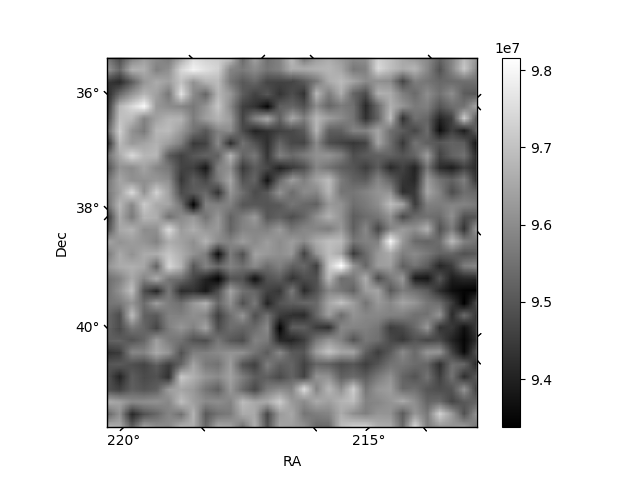
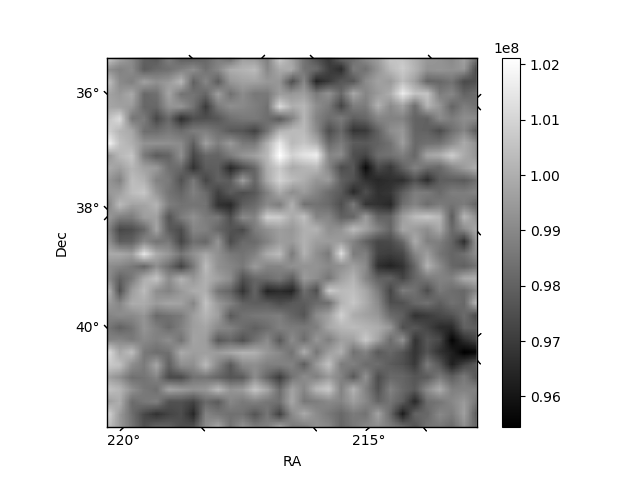
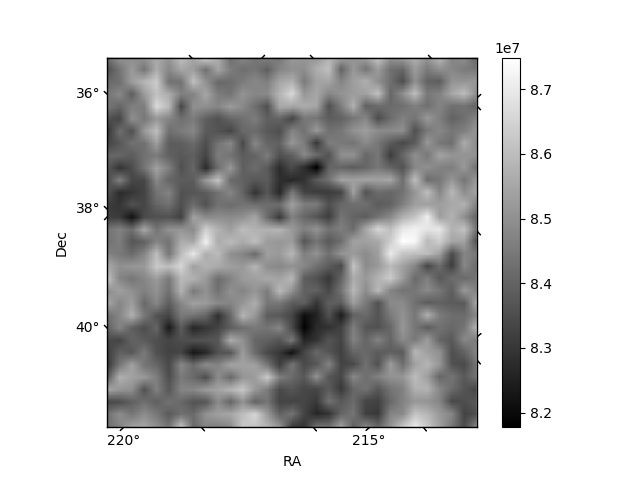
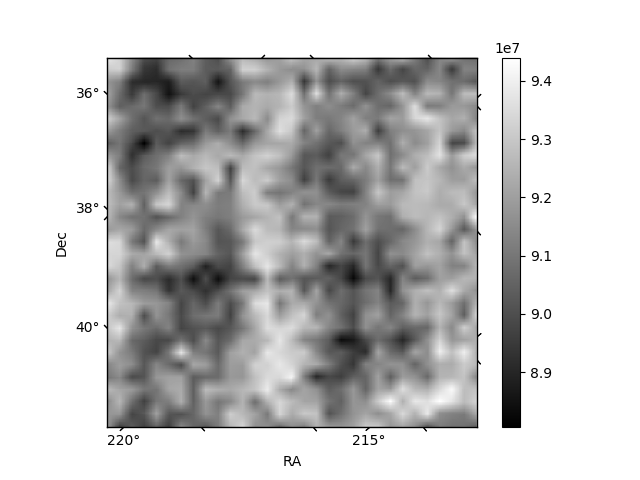
Histogram calculated using DETX and DETY for each event in the final _common_clean file
| Quadrant A | 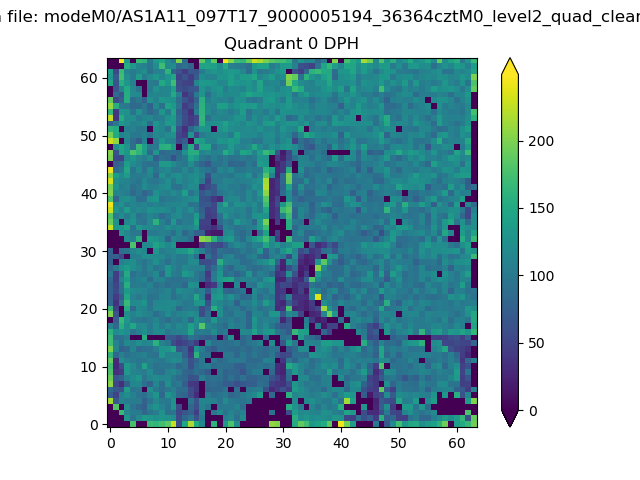 |
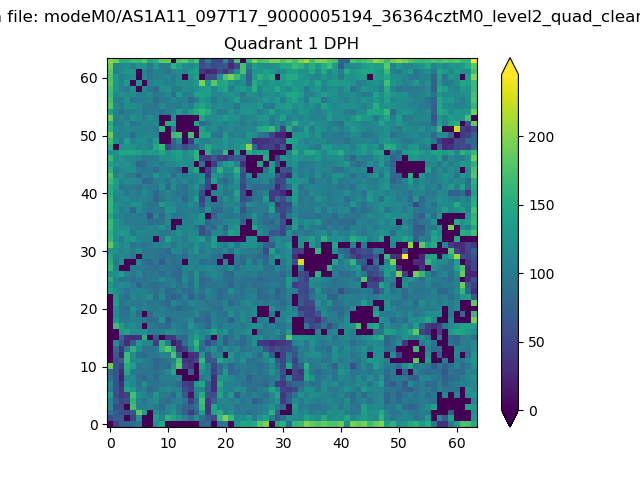 |
Quadrant B |
|---|---|---|---|
| Quadrant D | 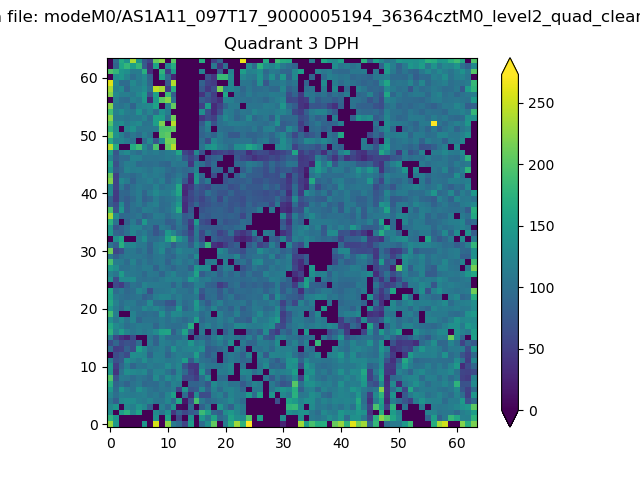 |
 |
Quadrant C |
| Plot type | Count rate plots | Images |
|---|---|---|
| Comparison with Poisson distribution Blue bars denote a histogram of data divided into 1 sec bins. Red curve is a Poisson curve with rate = median count rate of data. |
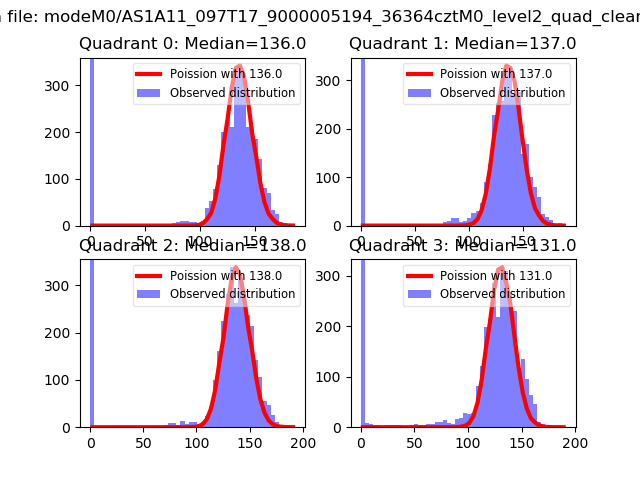 |
 |
| Quadrant-wise count rates Data is divided into 100 sec bins |
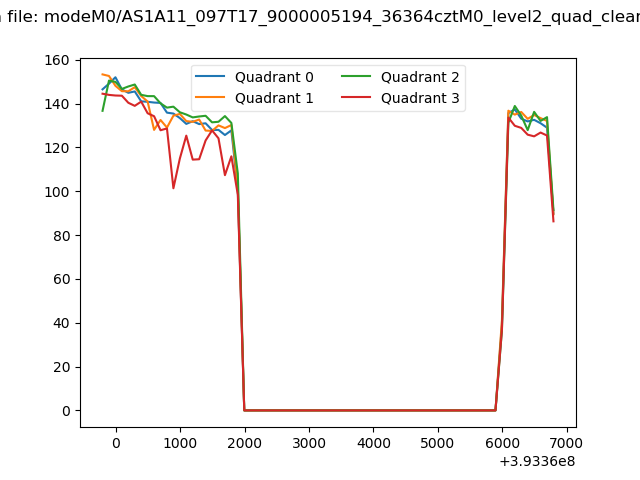 |
|
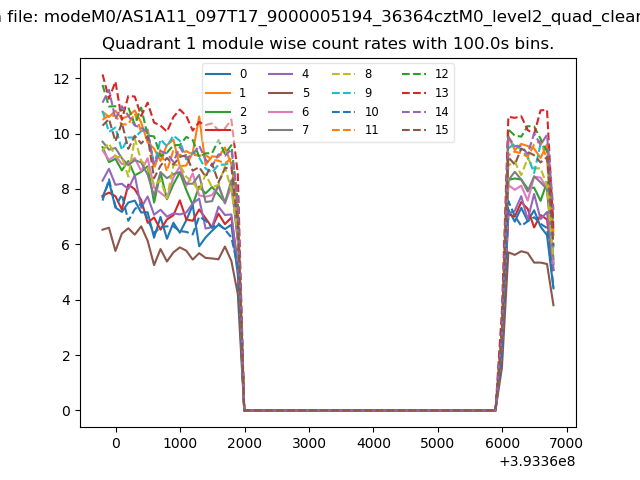
| Module-wise count rates for Quadrant A Data is divided into 100 sec bins |
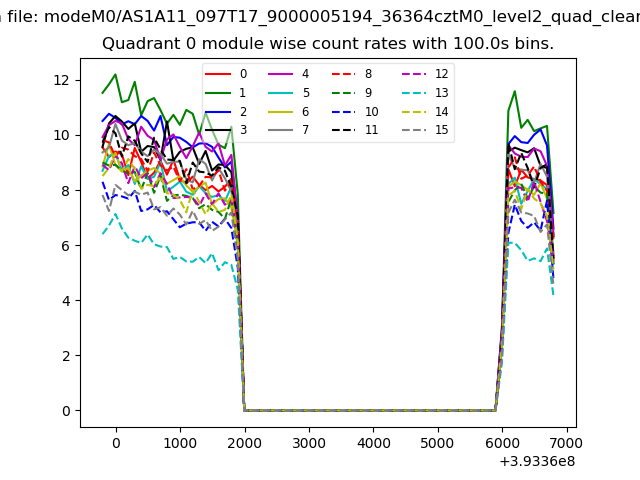 |
 |
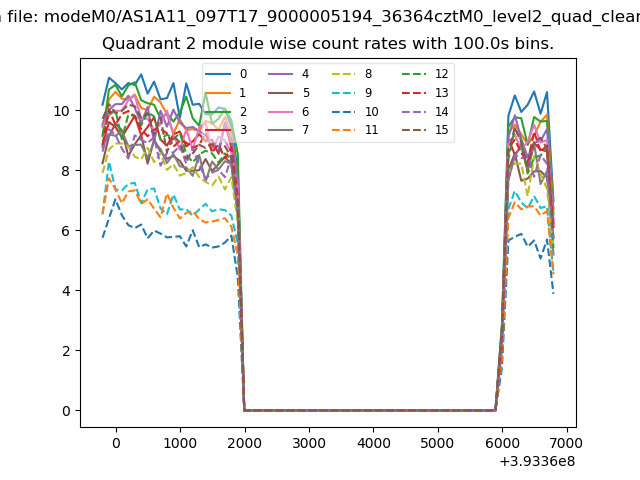
| Module-wise count rates for Quadrant B Data is divided into 100 sec bins |
 |
 |
| Module-wise count rates for Quadrant C Data is divided into 100 sec bins |
 |
 |
| Module-wise count rates for Quadrant D Data is divided into 100 sec bins |
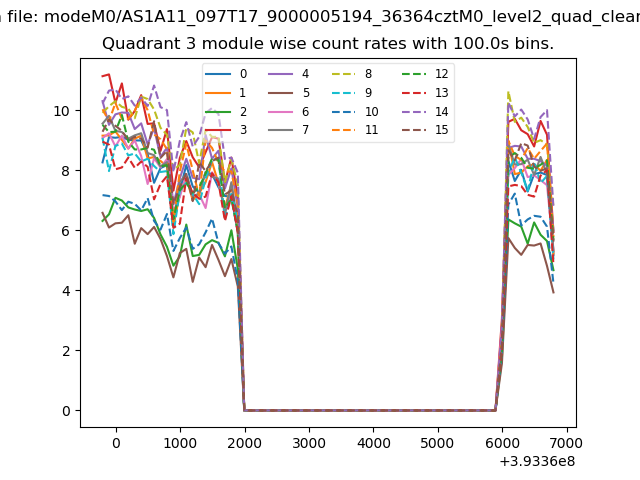 |
 |
| Parameter | Plot |
|---|---|
| CZT HV Monitor | 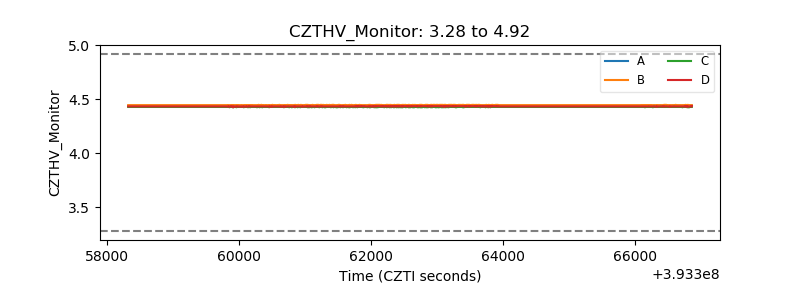 |
| D_VDD | 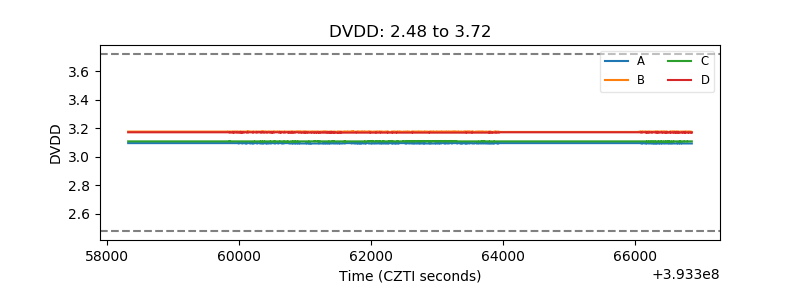 |
| Temperature 1 | 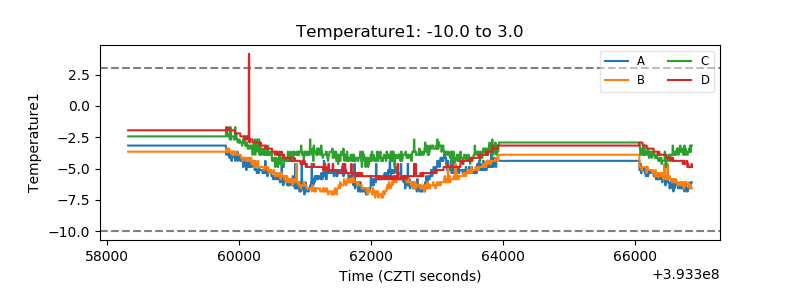 |
| Veto HV Monitor | 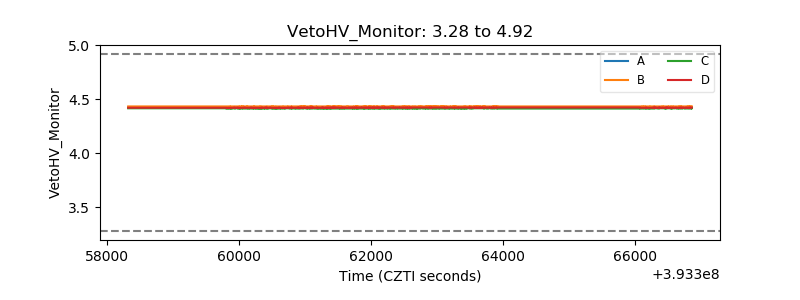 |
| Veto LLD | 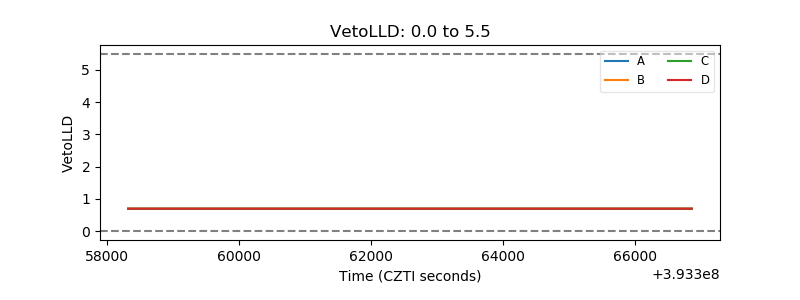 |
| Alpha Counter | 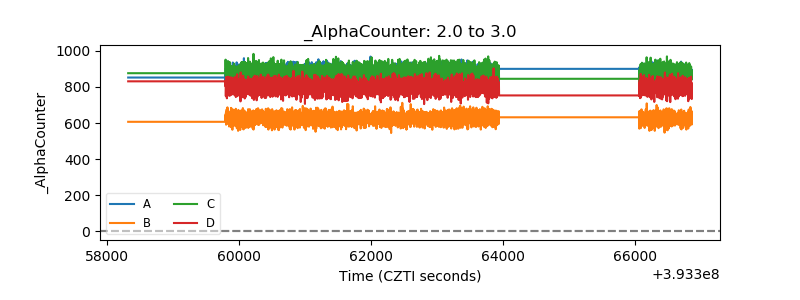 |
| _CPM_Rate | 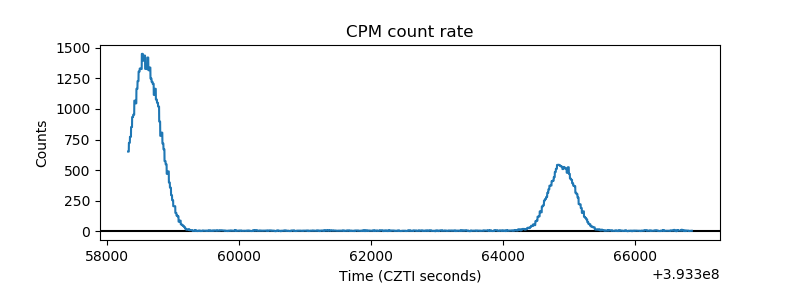 |
| CZT Counter | 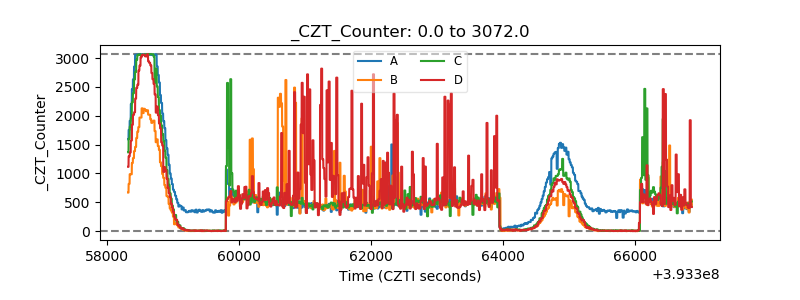 |
| +2.5 Volts monitor | 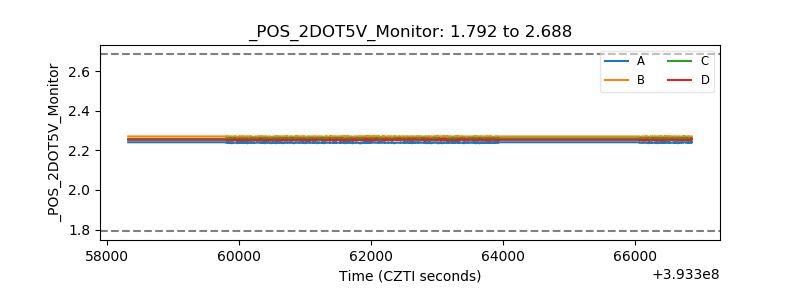 |
| +5 Volts monitor | 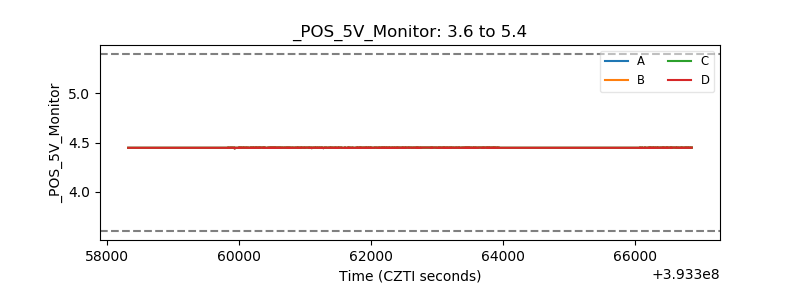 |
| _ROLL_ROT | 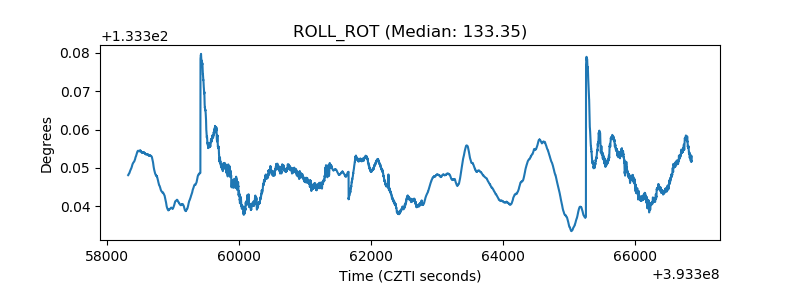 |
| _Roll_DEC | 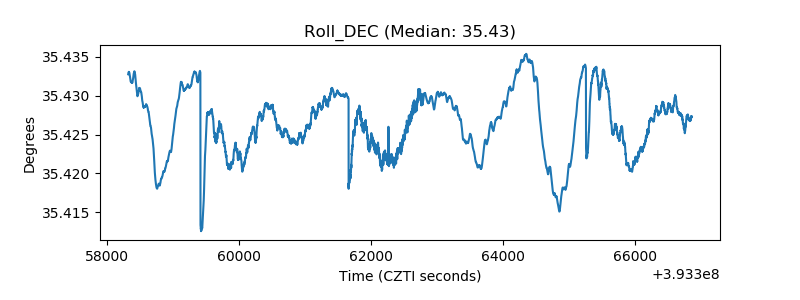 |
| _Roll_RA | 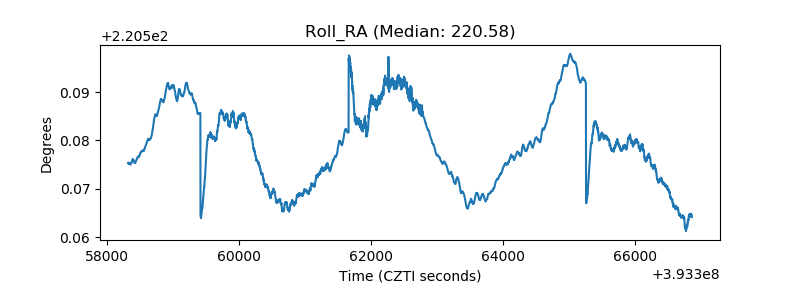 |
| Veto Counter | 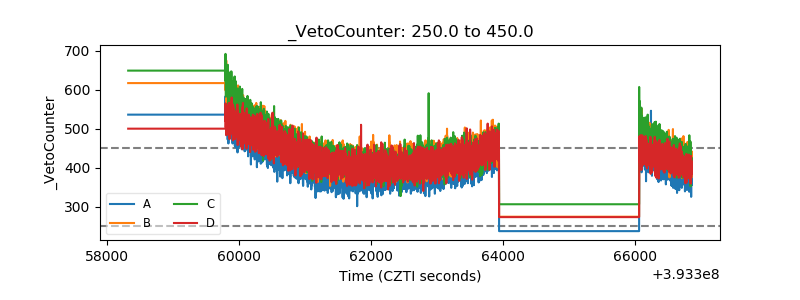 |