| Param | Original file | Final file |
|---|---|---|
| Filename | modeM0/AS1A11_097T17_9000005194_36363cztM0_level2.evt | modeM0/AS1A11_097T17_9000005194_36363cztM0_level2_quad_clean.evt |
| Size (bytes) | 380,399,040 | 77,028,480 |
| Size | 362.8 MB | 73.5 MB |
| Events in quadrant A | 2,522,668 | 500,310 |
| Events in quadrant B | 2,689,018 | 504,901 |
| Events in quadrant C | 2,801,974 | 502,929 |
| Events in quadrant D | 3,169,835 | 477,088 |
| Mode SS | |||
|---|---|---|---|
| Quadrant | BADHDUFLAG | Total packets | Discarded packets |
| A | 0 | 102 | 0 |
| B | 0 | 102 | 0 |
| C | 0 | 102 | 0 |
| D | 0 | 102 | 0 |
| Mode M0 | |||
|---|---|---|---|
| Quadrant | BADHDUFLAG | Total packets | Discarded packets |
| A | 0 | 10567 | 3 |
| B | 0 | 11115 | 2 |
| C | 0 | 11231 | 2 |
| D | 0 | 12621 | 2 |
| Mode M9 | |||
|---|---|---|---|
| Quadrant | BADHDUFLAG | Total packets | Discarded packets |
| A | 0 | 29 | 0 |
| B | 0 | 29 | 0 |
| C | 0 | 29 | 0 |
| D | 0 | 30 | 0 |
| Quadrant | Total seconds | Saturated seconds | Saturation percentage |
|---|---|---|---|
| A | 4949 | 11 | 0.222267% |
| B | 4949 | 62 | 1.252778% |
| C | 4949 | 96 | 1.939786% |
| D | 4949 | 140 | 2.828854% |
Noise dominated data is calculated using 1-second bins in cleaned event files. If a bin has >2000 counts, and if more than 50% of those come from <1% of pixels, then it is considered to be noise-dominated and hence unusable.
| Quadrant | # 1 sec bins | Bins with >0 counts | Bins with >2000 counts | High rate bins dominated by noise | Noise dominated (total time) | Noise dominated (detector-on time) | Marked lightcurve |
|---|---|---|---|---|---|---|---|
| A | 7102 | 4950 | 4 | 4 | 0.06% | 0.08% | 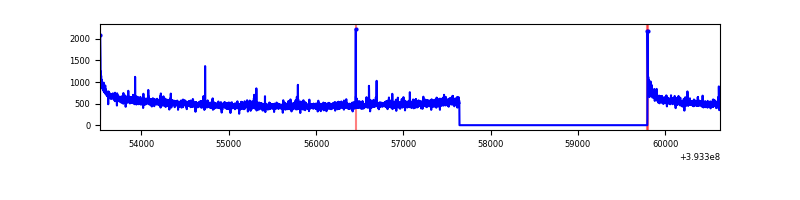 |
| B | 7101 | 4949 | 48 | 48 | 0.68% | 0.97% | 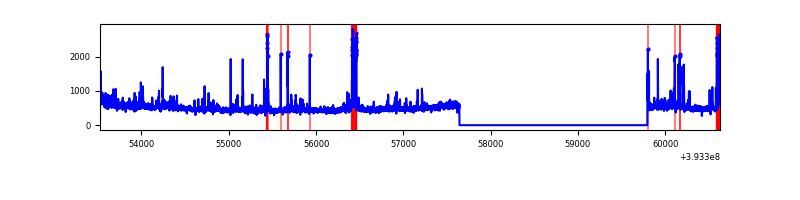 |
| C | 7102 | 4950 | 64 | 64 | 0.90% | 1.29% | 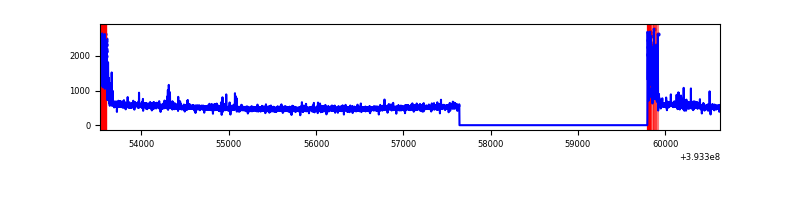 |
| D | 7102 | 4950 | 154 | 154 | 2.17% | 3.11% | 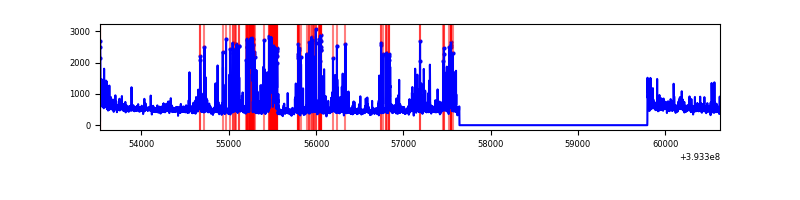 |
Top three noisy pixels from each quadrant. If the there are fewer than three noisy pixels in the level2.evt file, extra rows are filled as -1
| Pixel properties | Quadrant properties | ||||||
|---|---|---|---|---|---|---|---|
| Quadrant | DetID | PixID | Counts | Sigma | Mean | Median | Sigma |
| A | 10 | 83 | 181956 | 1529.45 | 595 | 585 | 118.6 |
| A | 12 | 189 | 16965 | 138.12 | 595 | 585 | 118.6 |
| A | 9 | 143 | 10292 | 81.85 | 595 | 585 | 118.6 |
| B | 5 | 172 | 197127 | 1770.28 | 589 | 574 | 111.0 |
| B | 5 | 236 | 72992 | 652.24 | 589 | 574 | 111.0 |
| B | 0 | 189 | 62411 | 556.94 | 589 | 574 | 111.0 |
| C | 0 | 10 | 296811 | 2186.35 | 586 | 593 | 135.5 |
| C | 15 | 214 | 211731 | 1558.38 | 586 | 593 | 135.5 |
| C | 0 | 207 | 6543 | 43.92 | 586 | 593 | 135.5 |
| D | 12 | 6 | 552566 | 3964.2 | 582 | 569 | 139.2 |
| D | 2 | 153 | 115636 | 826.36 | 582 | 569 | 139.2 |
| D | 2 | 249 | 101255 | 723.08 | 582 | 569 | 139.2 |
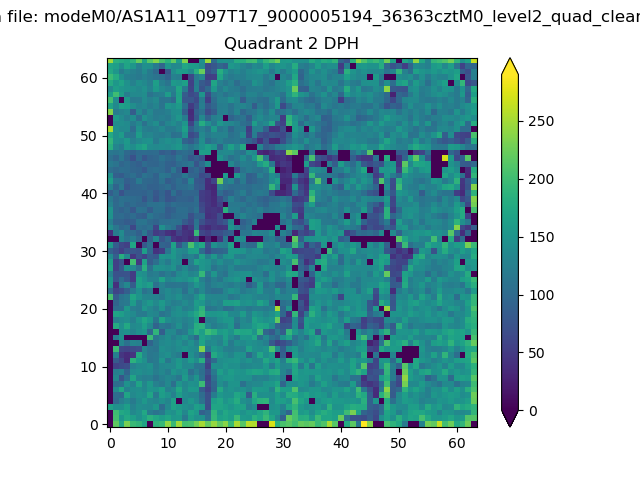
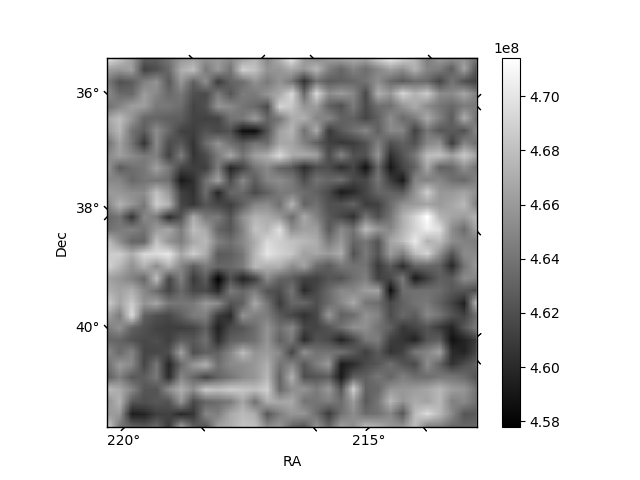
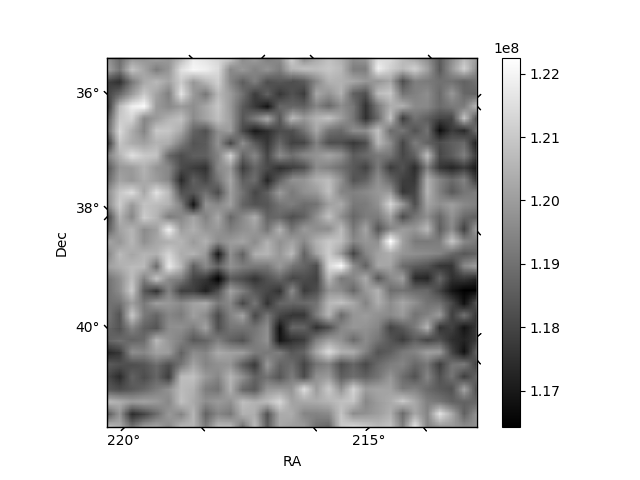
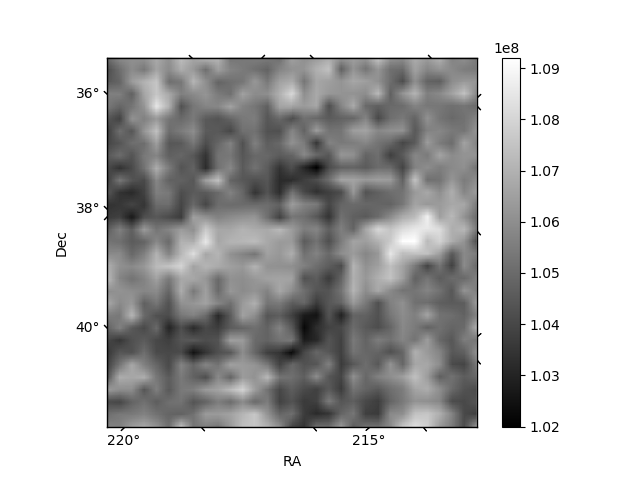
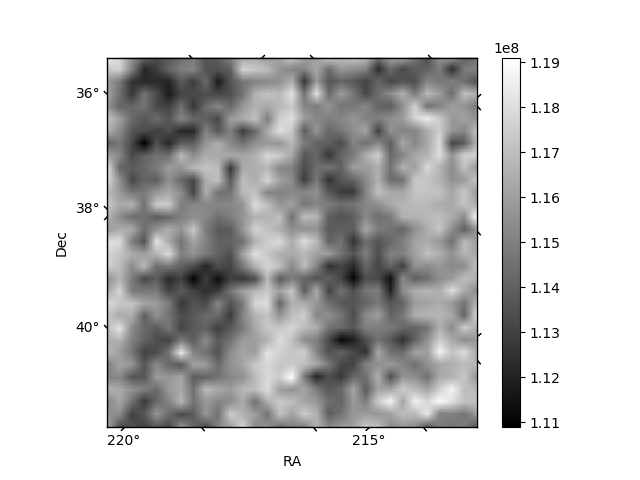
Histogram calculated using DETX and DETY for each event in the final _common_clean file
| Quadrant A | 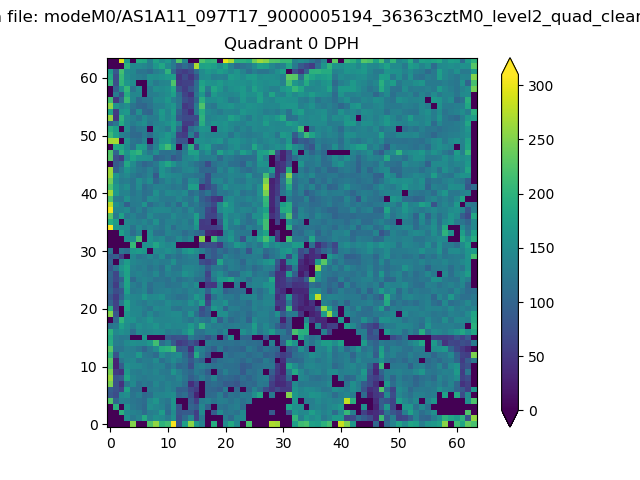 |
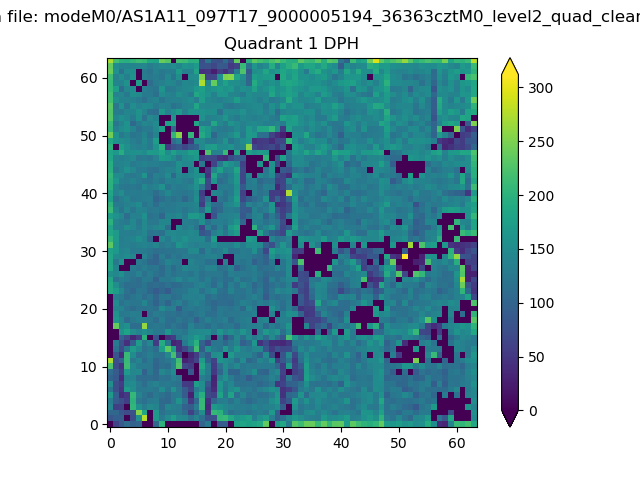 |
Quadrant B |
|---|---|---|---|
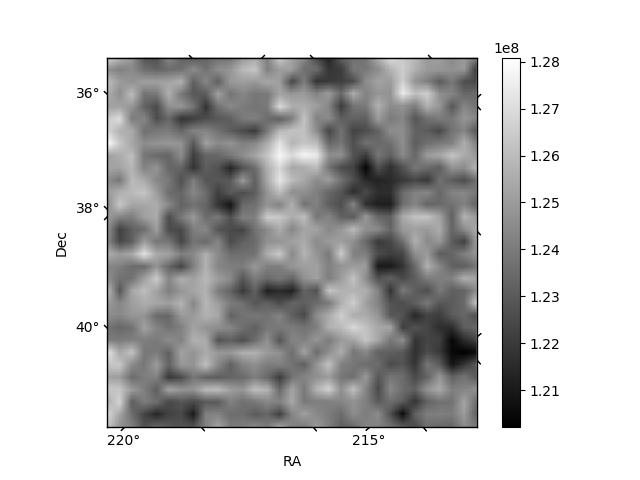
| Quadrant D | 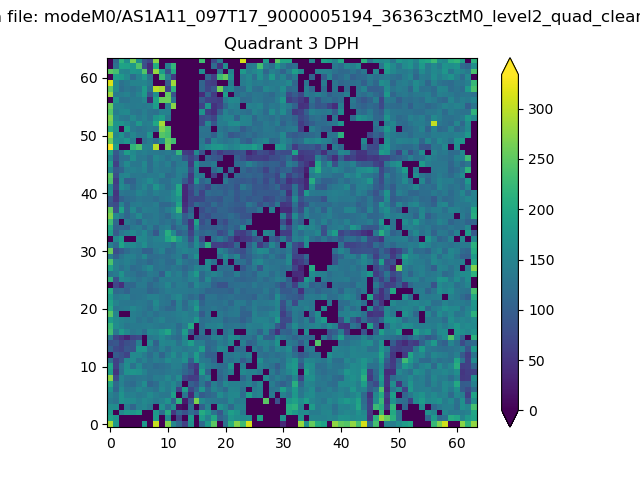 |
 |
Quadrant C |
| Plot type | Count rate plots | Images |
|---|---|---|
| Comparison with Poisson distribution Blue bars denote a histogram of data divided into 1 sec bins. Red curve is a Poisson curve with rate = median count rate of data. |
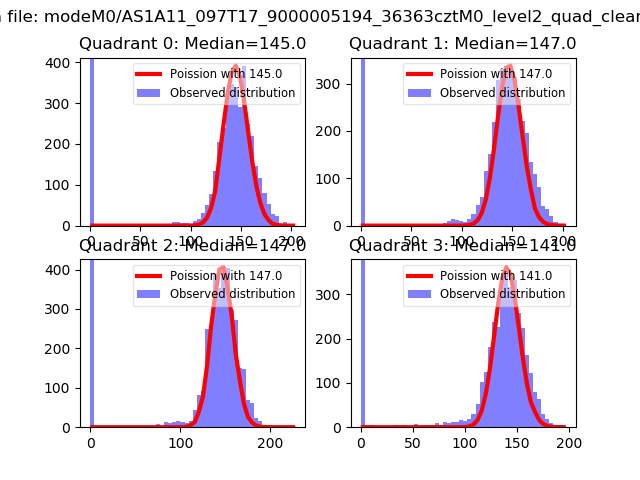 |
 |
| Quadrant-wise count rates Data is divided into 100 sec bins |
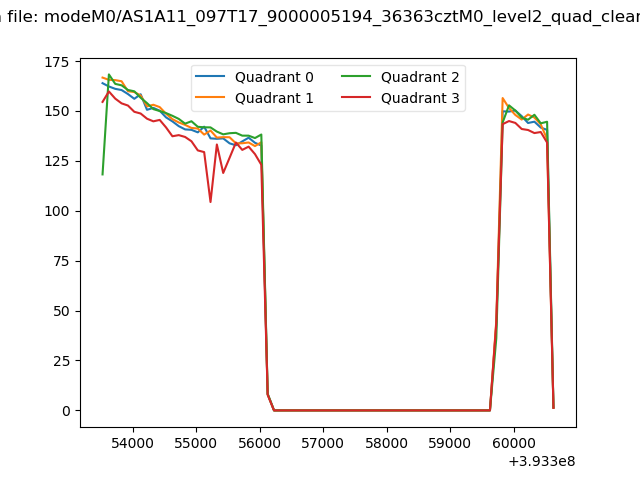 |
|
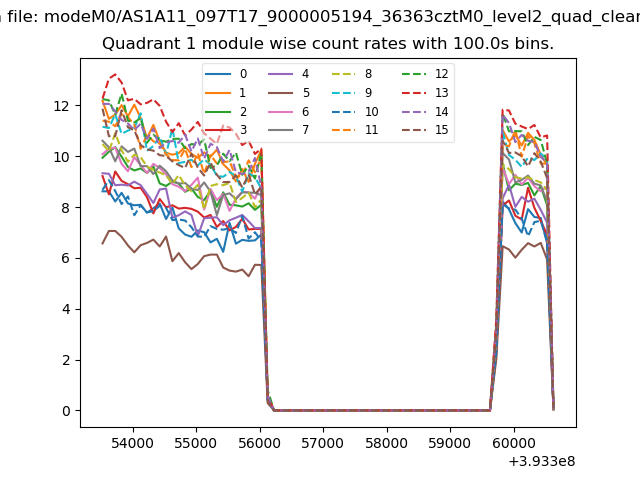
| Module-wise count rates for Quadrant A Data is divided into 100 sec bins |
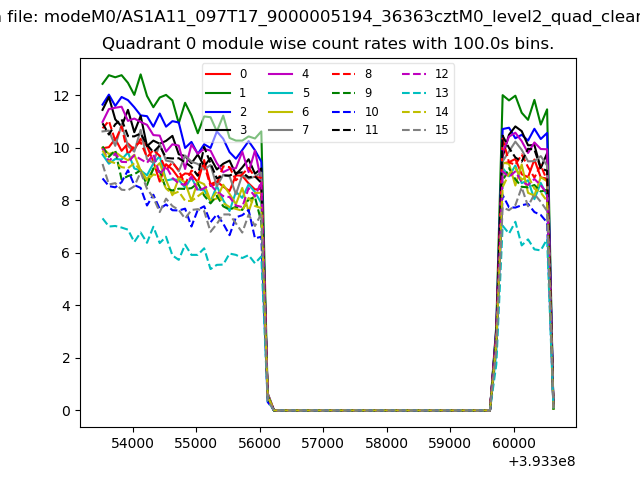 |
 |
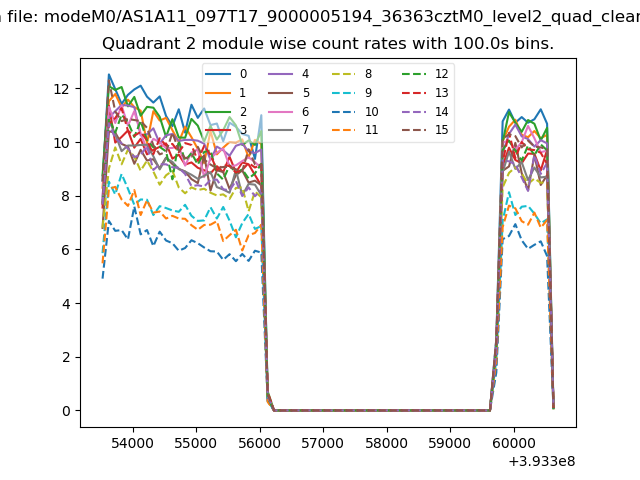
| Module-wise count rates for Quadrant B Data is divided into 100 sec bins |
 |
 |
| Module-wise count rates for Quadrant C Data is divided into 100 sec bins |
 |
 |
| Module-wise count rates for Quadrant D Data is divided into 100 sec bins |
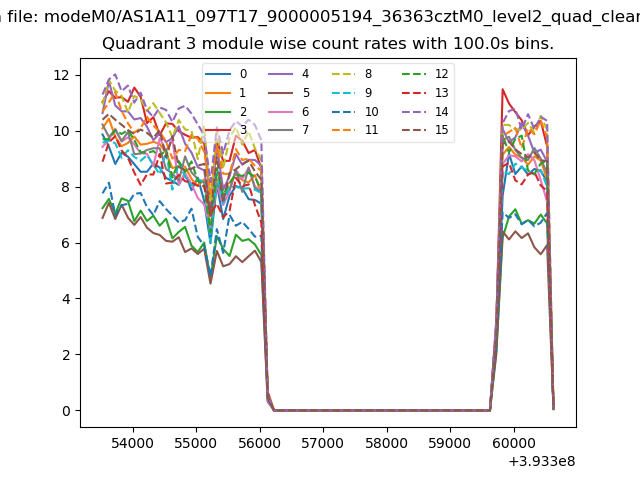 |
 |
| Parameter | Plot |
|---|---|
| CZT HV Monitor | 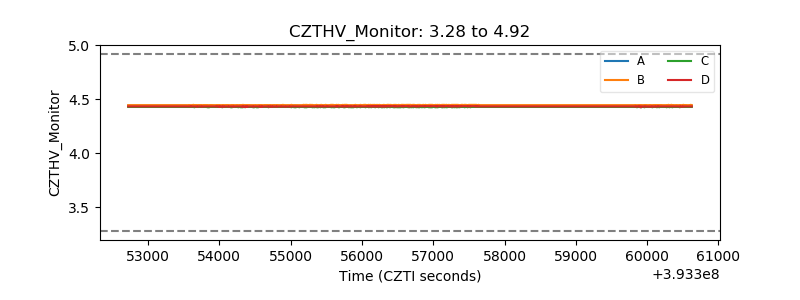 |
| D_VDD | 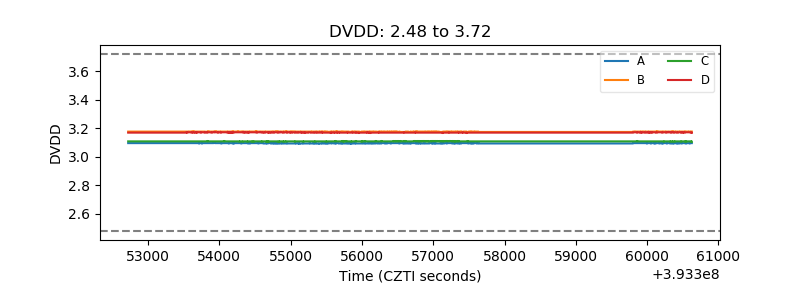 |
| Temperature 1 | 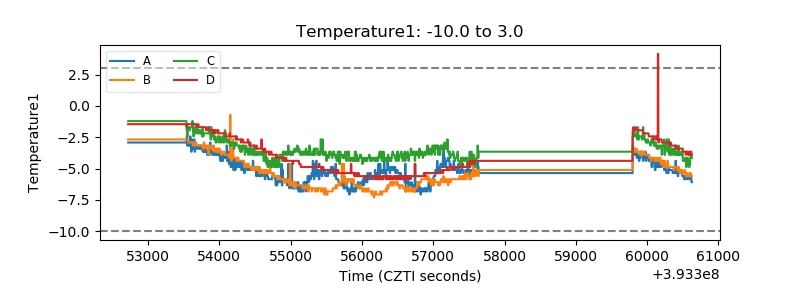 |
| Veto HV Monitor | 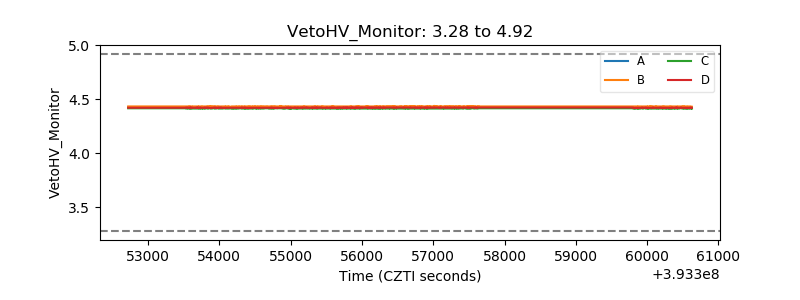 |
| Veto LLD | 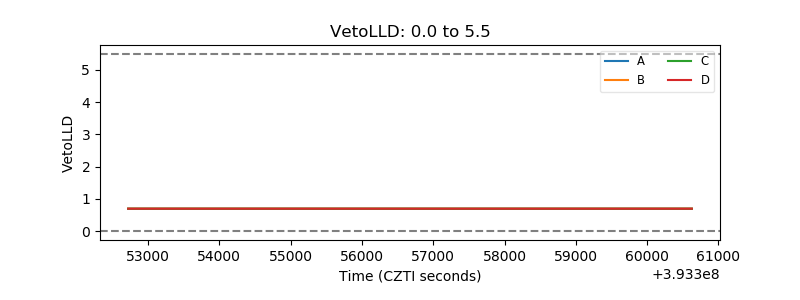 |
| Alpha Counter | 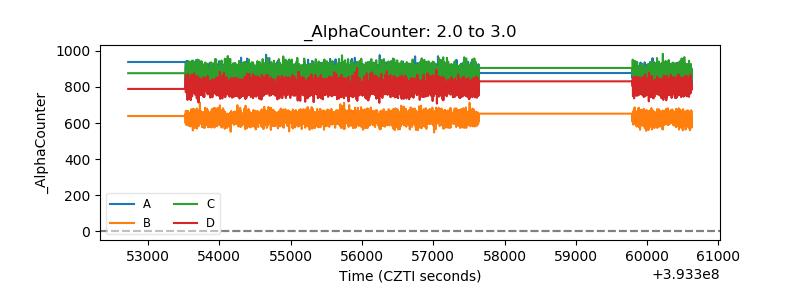 |
| _CPM_Rate | 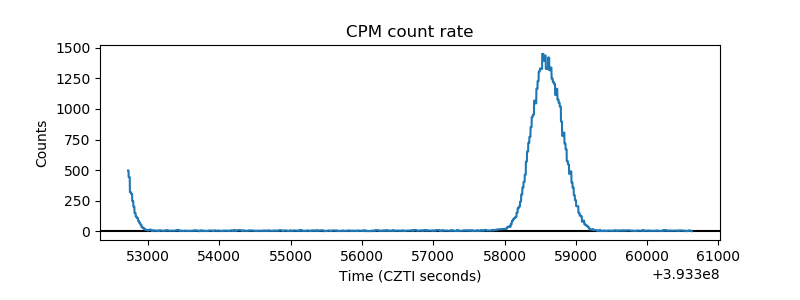 |
| CZT Counter | 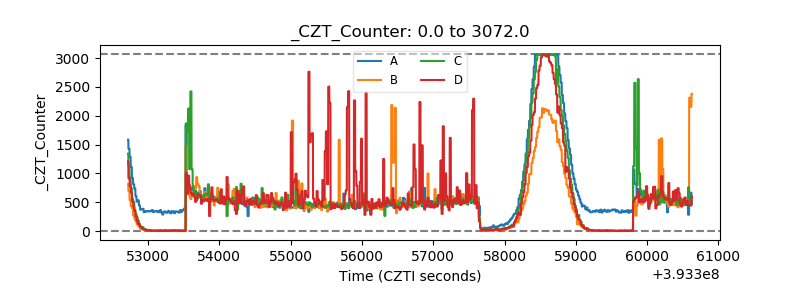 |
| +2.5 Volts monitor | 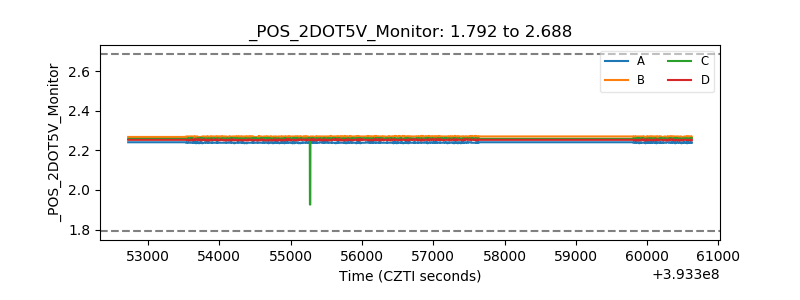 |
| +5 Volts monitor | 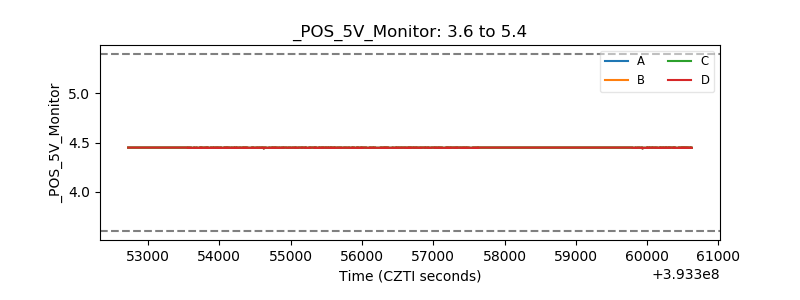 |
| _ROLL_ROT | 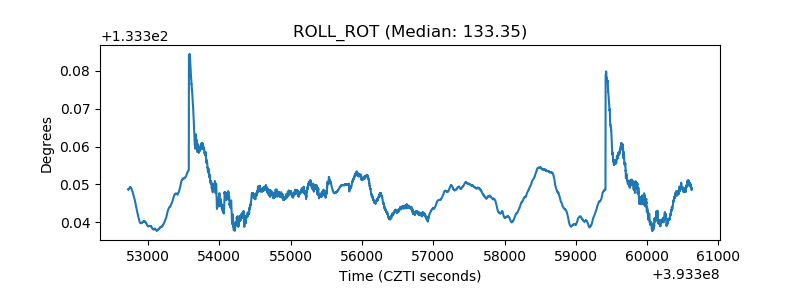 |
| _Roll_DEC | 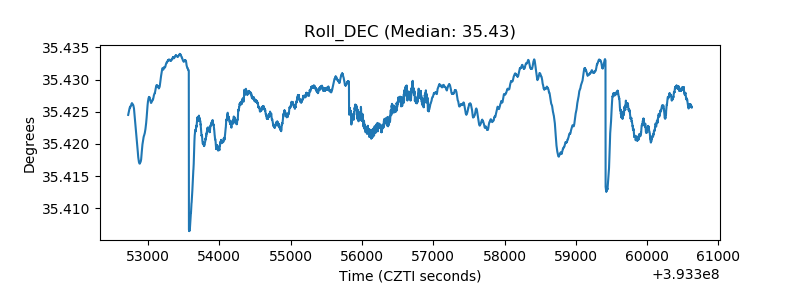 |
| _Roll_RA | 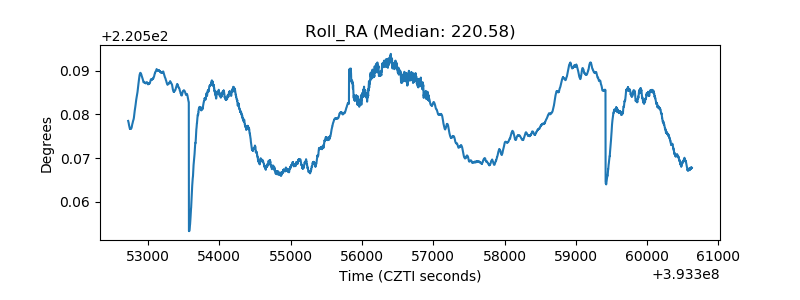 |
| Veto Counter | 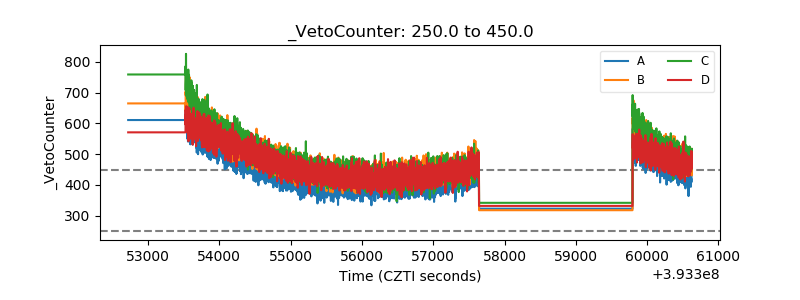 |