| Param | Original file | Final file |
|---|---|---|
| Filename | modeM0/AS1A11_097T17_9000005194_36361cztM0_level2.evt | modeM0/AS1A11_097T17_9000005194_36361cztM0_level2_quad_clean.evt |
| Size (bytes) | 439,041,600 | 94,826,880 |
| Size | 418.7 MB | 90.4 MB |
| Events in quadrant A | 2,740,947 | 641,338 |
| Events in quadrant B | 2,998,803 | 637,311 |
| Events in quadrant C | 3,127,838 | 633,260 |
| Events in quadrant D | 4,077,372 | 596,947 |
| Mode SS | |||
|---|---|---|---|
| Quadrant | BADHDUFLAG | Total packets | Discarded packets |
| A | 0 | 106 | 0 |
| B | 0 | 106 | 0 |
| C | 0 | 106 | 0 |
| D | 0 | 106 | 0 |
| Mode M0 | |||
|---|---|---|---|
| Quadrant | BADHDUFLAG | Total packets | Discarded packets |
| A | 0 | 11433 | 3 |
| B | 0 | 12328 | 2 |
| C | 0 | 12439 | 2 |
| D | 0 | 15599 | 2 |
| Mode M9 | |||
|---|---|---|---|
| Quadrant | BADHDUFLAG | Total packets | Discarded packets |
| A | 0 | 20 | 0 |
| B | 0 | 20 | 0 |
| C | 0 | 20 | 0 |
| D | 0 | 21 | 0 |
| Quadrant | Total seconds | Saturated seconds | Saturation percentage |
|---|---|---|---|
| A | 5178 | 14 | 0.270375% |
| B | 5178 | 69 | 1.332561% |
| C | 5178 | 97 | 1.873310% |
| D | 5178 | 208 | 4.016995% |
Noise dominated data is calculated using 1-second bins in cleaned event files. If a bin has >2000 counts, and if more than 50% of those come from <1% of pixels, then it is considered to be noise-dominated and hence unusable.
| Quadrant | # 1 sec bins | Bins with >0 counts | Bins with >2000 counts | High rate bins dominated by noise | Noise dominated (total time) | Noise dominated (detector-on time) | Marked lightcurve |
|---|---|---|---|---|---|---|---|
| A | 7181 | 5179 | 1 | 1 | 0.01% | 0.02% | 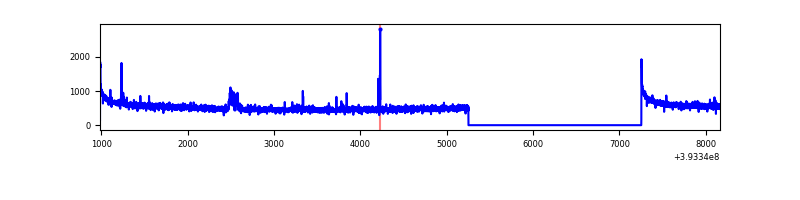 |
| B | 7181 | 5179 | 55 | 55 | 0.77% | 1.06% | 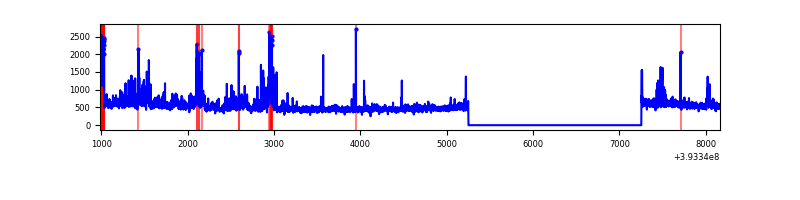 |
| C | 7181 | 5179 | 83 | 83 | 1.16% | 1.60% | 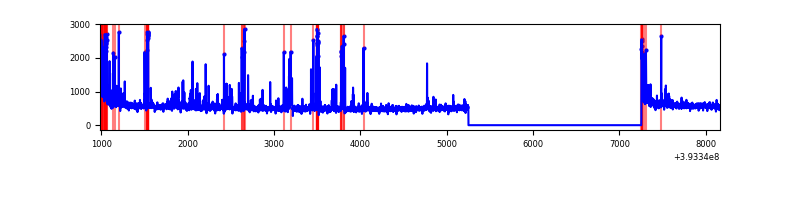 |
| D | 7181 | 5179 | 222 | 222 | 3.09% | 4.29% | 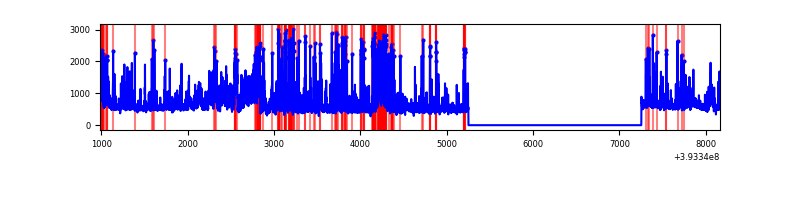 |
Top three noisy pixels from each quadrant. If the there are fewer than three noisy pixels in the level2.evt file, extra rows are filled as -1
| Pixel properties | Quadrant properties | ||||||
|---|---|---|---|---|---|---|---|
| Quadrant | DetID | PixID | Counts | Sigma | Mean | Median | Sigma |
| A | 10 | 83 | 183247 | 1410.59 | 644 | 634 | 129.5 |
| A | 12 | 189 | 41279 | 313.96 | 644 | 634 | 129.5 |
| A | 9 | 143 | 18021 | 134.31 | 644 | 634 | 129.5 |
| B | 5 | 172 | 293973 | 2493.91 | 627 | 613 | 117.6 |
| B | 0 | 213 | 72798 | 613.66 | 627 | 613 | 117.6 |
| B | 0 | 189 | 49211 | 413.14 | 627 | 613 | 117.6 |
| C | 0 | 207 | 290779 | 2019.89 | 624 | 631 | 143.6 |
| C | 15 | 214 | 219473 | 1523.48 | 624 | 631 | 143.6 |
| C | 0 | 10 | 180205 | 1250.12 | 624 | 631 | 143.6 |
| D | 12 | 6 | 644209 | 4316.08 | 622 | 608 | 149.1 |
| D | 2 | 249 | 493839 | 3307.67 | 622 | 608 | 149.1 |
| D | 12 | 235 | 144587 | 965.54 | 622 | 608 | 149.1 |
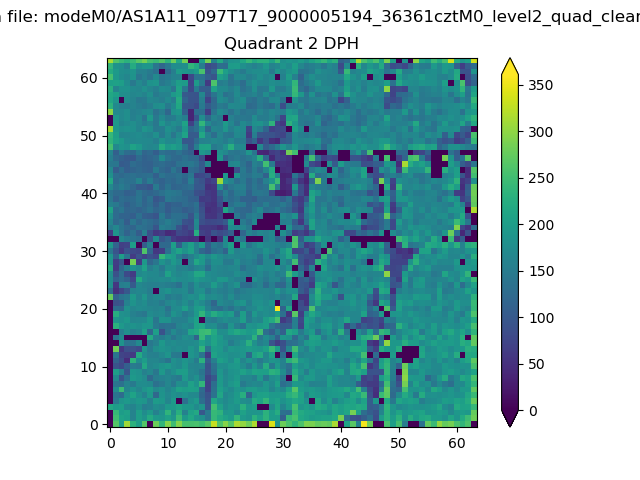
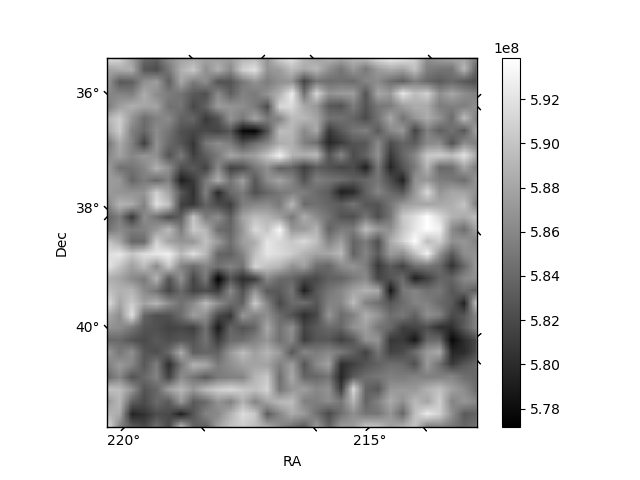
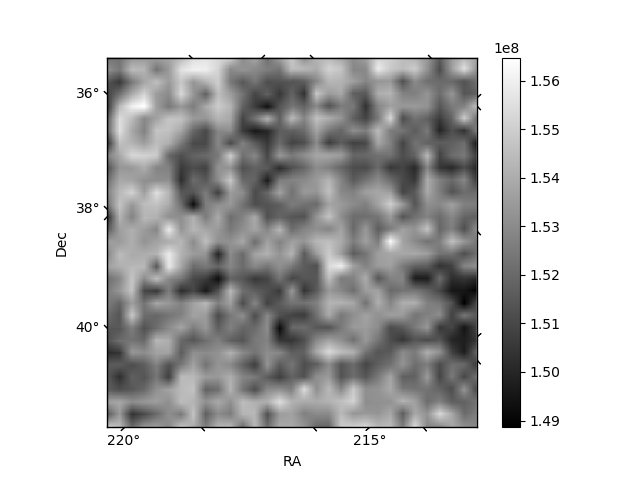
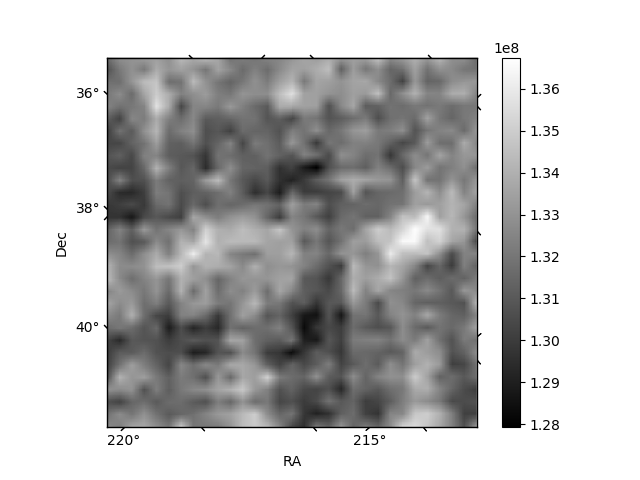
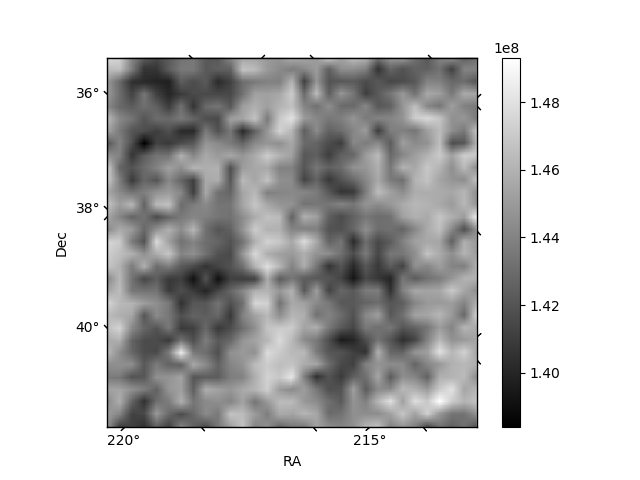
Histogram calculated using DETX and DETY for each event in the final _common_clean file
| Quadrant A | 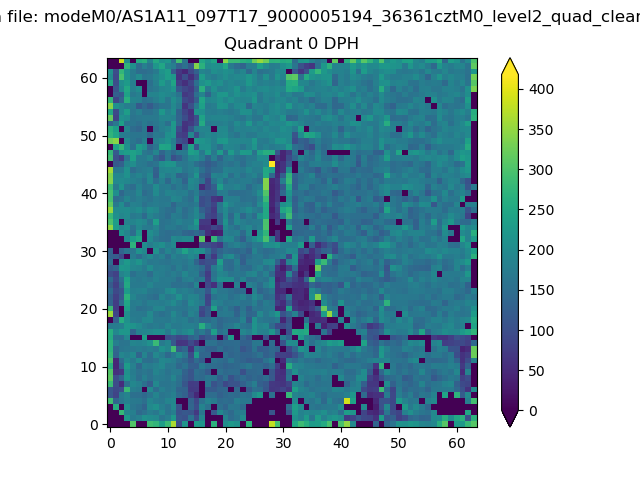 |
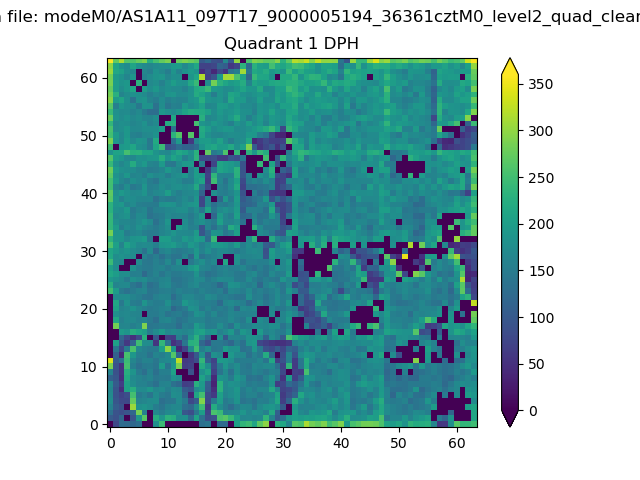 |
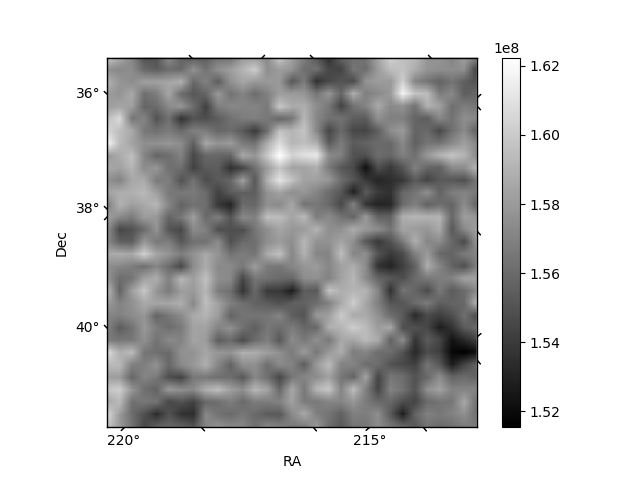
Quadrant B |
|---|---|---|---|
| Quadrant D | 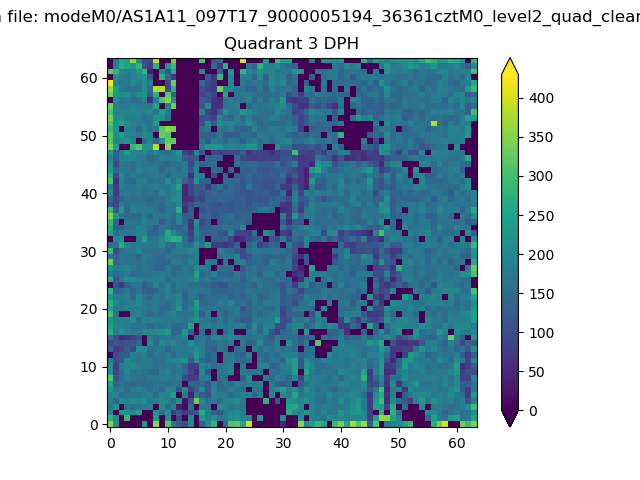 |
 |
Quadrant C |
| Plot type | Count rate plots | Images |
|---|---|---|
| Comparison with Poisson distribution Blue bars denote a histogram of data divided into 1 sec bins. Red curve is a Poisson curve with rate = median count rate of data. |
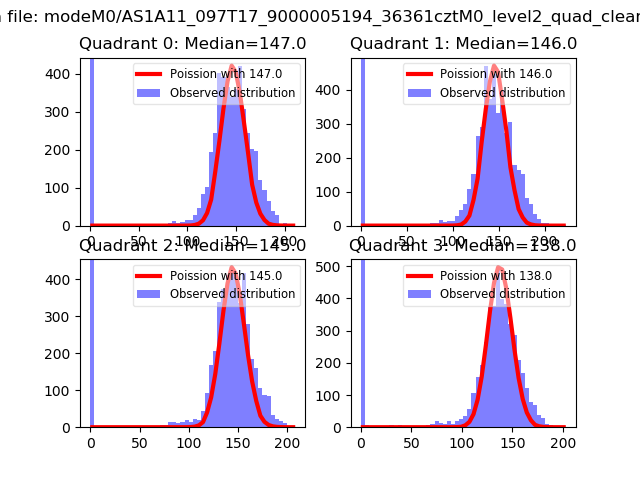 |
 |
| Quadrant-wise count rates Data is divided into 100 sec bins |
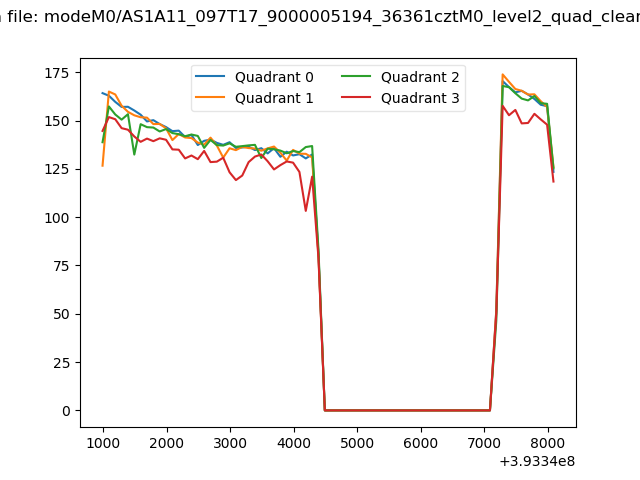 |
|
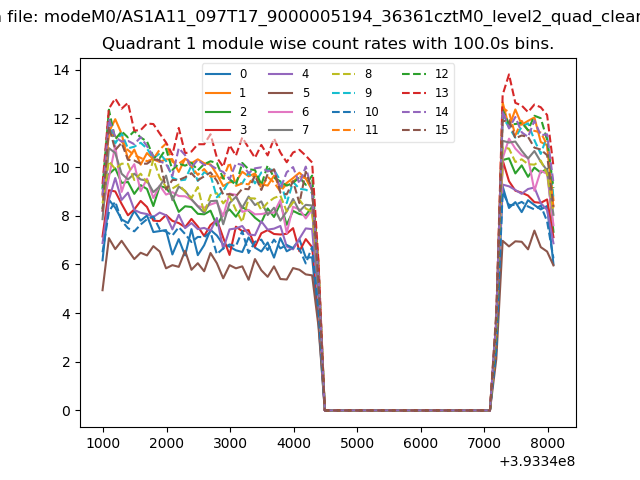
| Module-wise count rates for Quadrant A Data is divided into 100 sec bins |
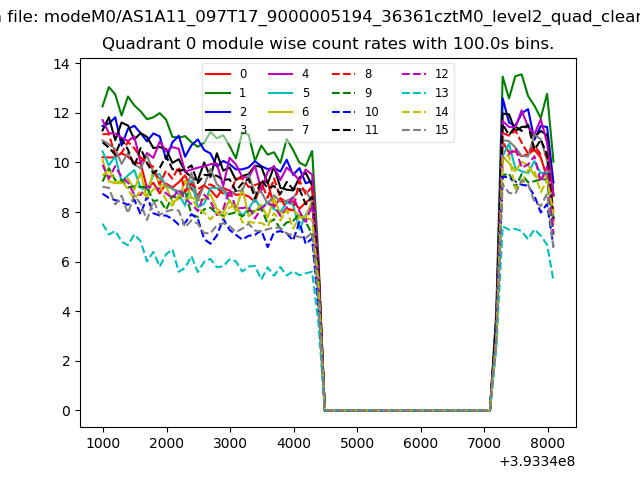 |
 |
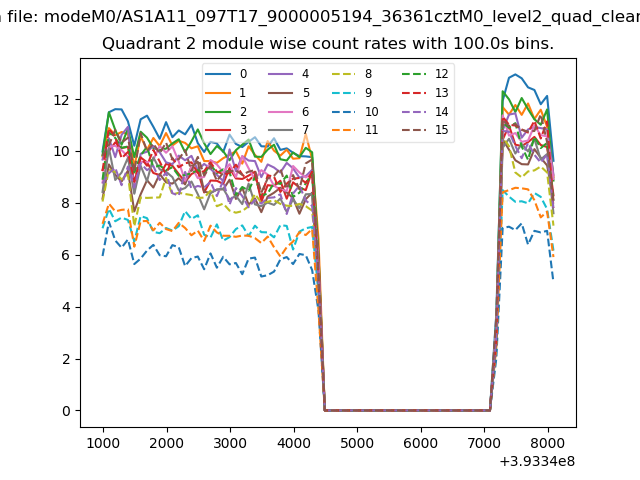
| Module-wise count rates for Quadrant B Data is divided into 100 sec bins |
 |
 |
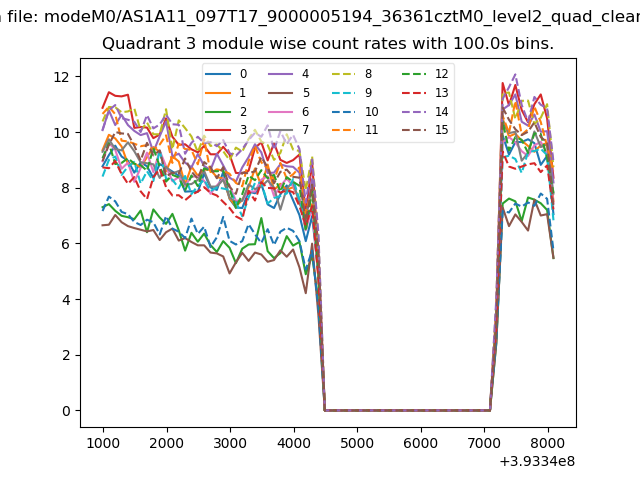
| Module-wise count rates for Quadrant C Data is divided into 100 sec bins |
 |
 |
| Module-wise count rates for Quadrant D Data is divided into 100 sec bins |
 |
 |
| Parameter | Plot |
|---|---|
| CZT HV Monitor | 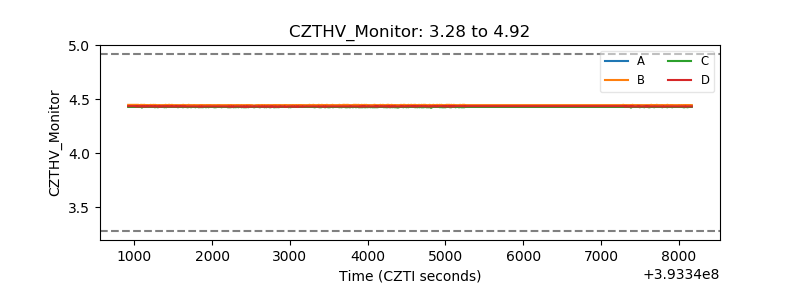 |
| D_VDD | 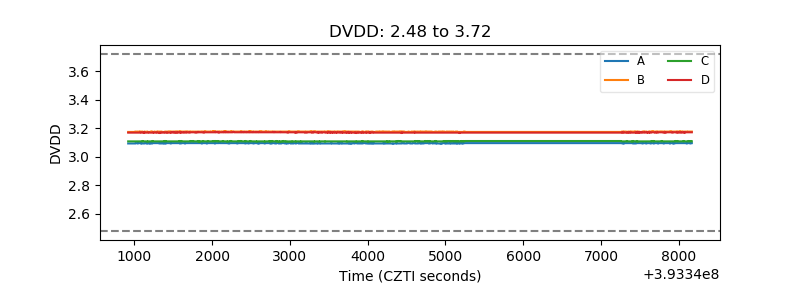 |
| Temperature 1 | 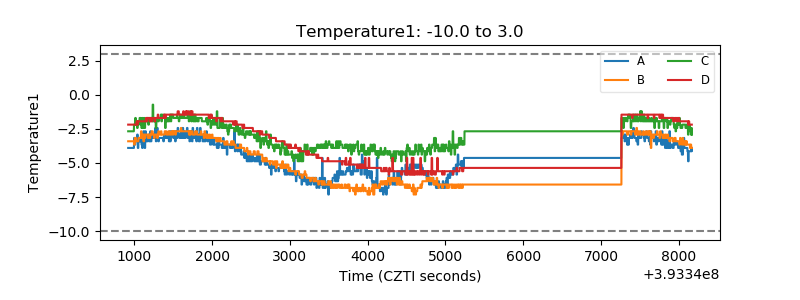 |
| Veto HV Monitor | 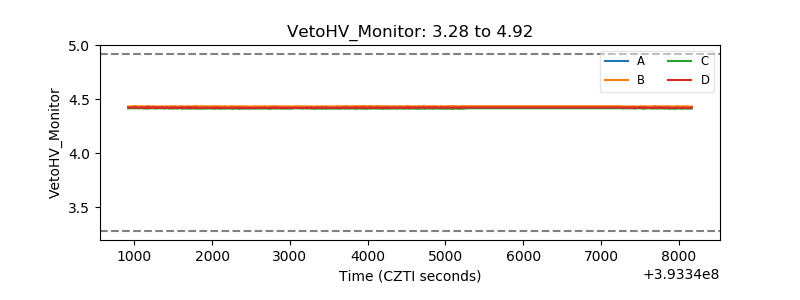 |
| Veto LLD | 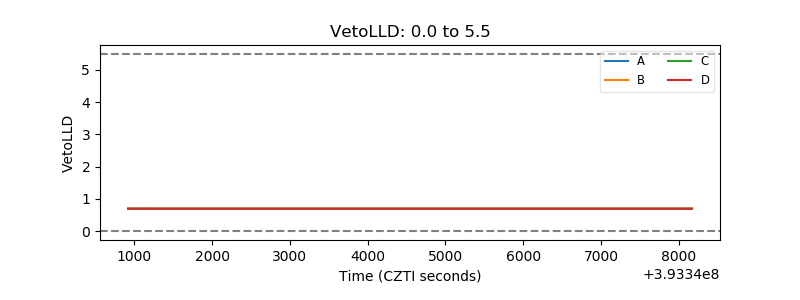 |
| Alpha Counter | 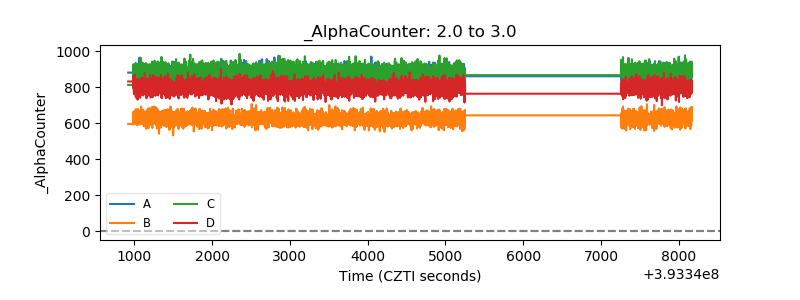 |
| _CPM_Rate | 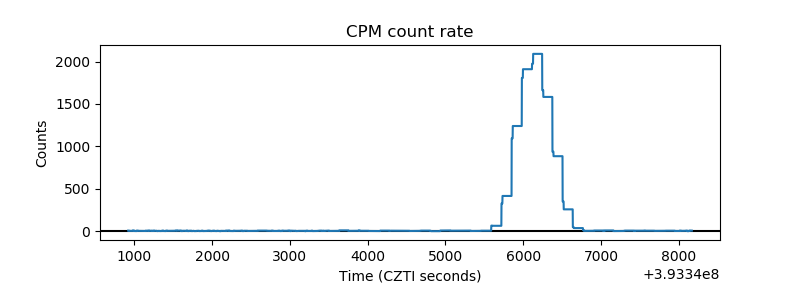 |
| CZT Counter | 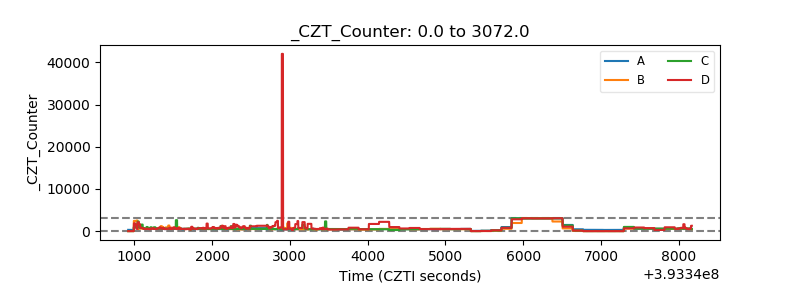 |
| +2.5 Volts monitor | 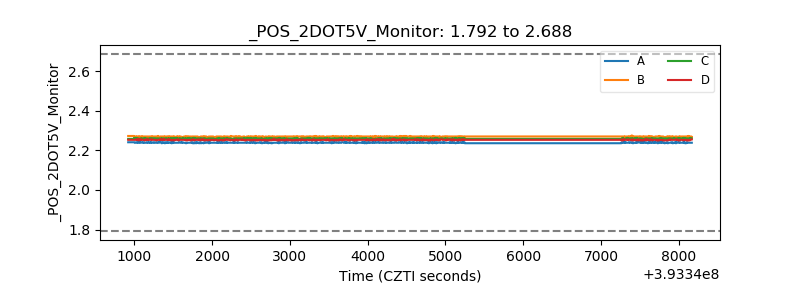 |
| +5 Volts monitor |  |
| _ROLL_ROT | 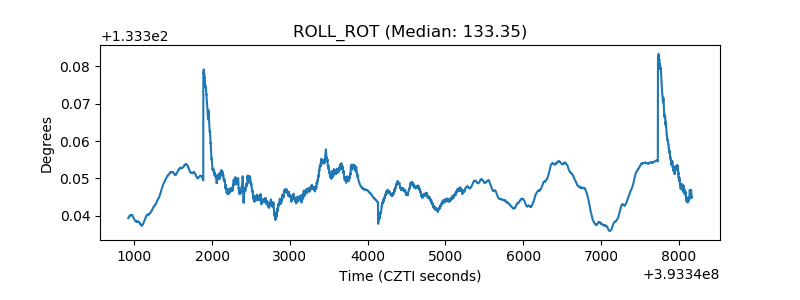 |
| _Roll_DEC | 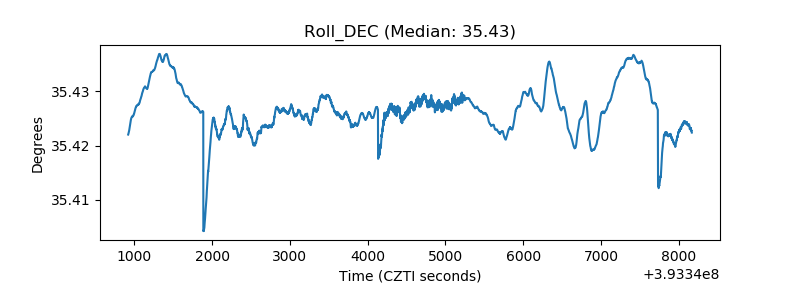 |
| _Roll_RA | 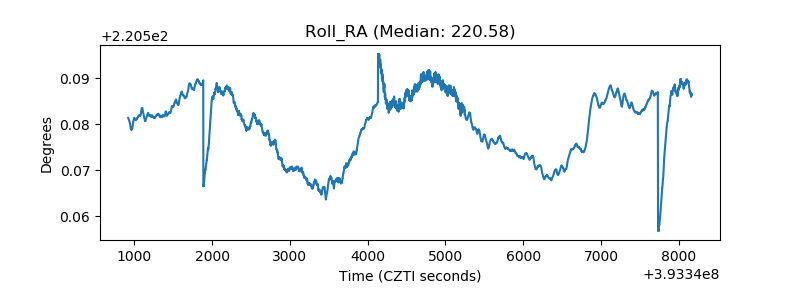 |
| Veto Counter | 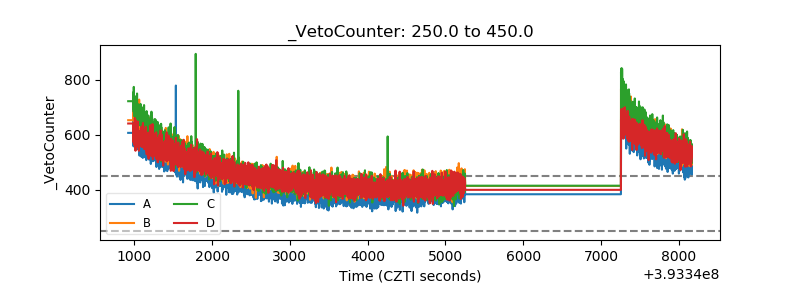 |