| Param | Original file | Final file |
|---|---|---|
| Filename | modeM0/AS1A11_097T17_9000005194_36357cztM0_level2.evt | modeM0/AS1A11_097T17_9000005194_36357cztM0_level2_quad_clean.evt |
| Size (bytes) | 513,832,320 | 86,232,960 |
| Size | 490.0 MB | 82.2 MB |
| Events in quadrant A | 3,037,363 | 552,206 |
| Events in quadrant B | 3,941,747 | 551,535 |
| Events in quadrant C | 3,313,535 | 555,403 |
| Events in quadrant D | 4,846,507 | 517,606 |
| Mode SS | |||
|---|---|---|---|
| Quadrant | BADHDUFLAG | Total packets | Discarded packets |
| A | 0 | 128 | 0 |
| B | 0 | 128 | 0 |
| C | 0 | 128 | 0 |
| D | 0 | 128 | 0 |
| Mode M0 | |||
|---|---|---|---|
| Quadrant | BADHDUFLAG | Total packets | Discarded packets |
| A | 0 | 12999 | 3 |
| B | 0 | 15793 | 2 |
| C | 0 | 13607 | 5 |
| D | 0 | 18613 | 2 |
| Mode M9 | |||
|---|---|---|---|
| Quadrant | BADHDUFLAG | Total packets | Discarded packets |
| A | 0 | 31 | 0 |
| B | 0 | 31 | 0 |
| C | 0 | 31 | 0 |
| D | 0 | 31 | 0 |
| Quadrant | Total seconds | Saturated seconds | Saturation percentage |
|---|---|---|---|
| A | 6230 | 12 | 0.192616% |
| B | 6230 | 294 | 4.719101% |
| C | 6228 | 65 | 1.043674% |
| D | 6230 | 361 | 5.794543% |
Noise dominated data is calculated using 1-second bins in cleaned event files. If a bin has >2000 counts, and if more than 50% of those come from <1% of pixels, then it is considered to be noise-dominated and hence unusable.
| Quadrant | # 1 sec bins | Bins with >0 counts | Bins with >2000 counts | High rate bins dominated by noise | Noise dominated (total time) | Noise dominated (detector-on time) | Marked lightcurve |
|---|---|---|---|---|---|---|---|
| A | 9336 | 6232 | 1 | 1 | 0.01% | 0.02% | 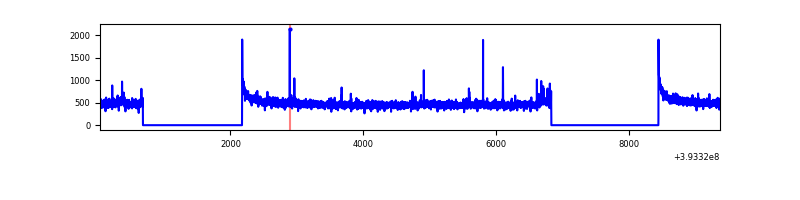 |
| B | 9336 | 6232 | 238 | 238 | 2.55% | 3.82% | 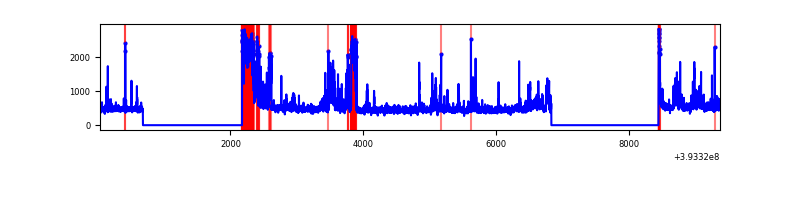 |
| C | 9336 | 6231 | 58 | 58 | 0.62% | 0.93% | 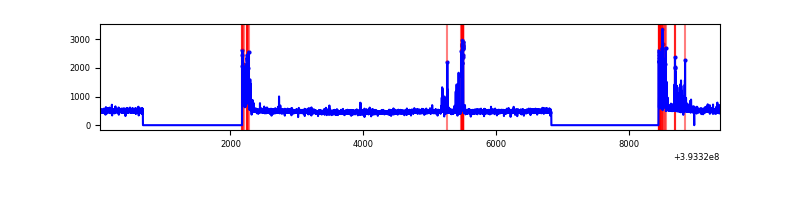 |
| D | 9336 | 6231 | 363 | 363 | 3.89% | 5.83% | 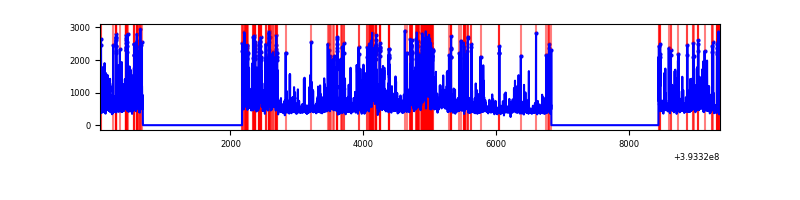 |
Top three noisy pixels from each quadrant. If the there are fewer than three noisy pixels in the level2.evt file, extra rows are filled as -1
| Pixel properties | Quadrant properties | ||||||
|---|---|---|---|---|---|---|---|
| Quadrant | DetID | PixID | Counts | Sigma | Mean | Median | Sigma |
| A | 10 | 83 | 200829 | 1368.25 | 717 | 702 | 146.3 |
| A | 12 | 189 | 41401 | 278.26 | 717 | 702 | 146.3 |
| A | 9 | 143 | 16726 | 109.55 | 717 | 702 | 146.3 |
| B | 5 | 236 | 679028 | 5024.37 | 697 | 678 | 135.0 |
| B | 5 | 172 | 381618 | 2821.53 | 697 | 678 | 135.0 |
| B | 5 | 255 | 29567 | 213.97 | 697 | 678 | 135.0 |
| C | 15 | 214 | 263160 | 1614.23 | 695 | 701 | 162.6 |
| C | 0 | 10 | 245269 | 1504.2 | 695 | 701 | 162.6 |
| C | 0 | 207 | 98990 | 604.52 | 695 | 701 | 162.6 |
| D | 13 | 171 | 576975 | 3396.7 | 686 | 667 | 169.7 |
| D | 12 | 6 | 492095 | 2896.43 | 686 | 667 | 169.7 |
| D | 2 | 249 | 409843 | 2411.64 | 686 | 667 | 169.7 |
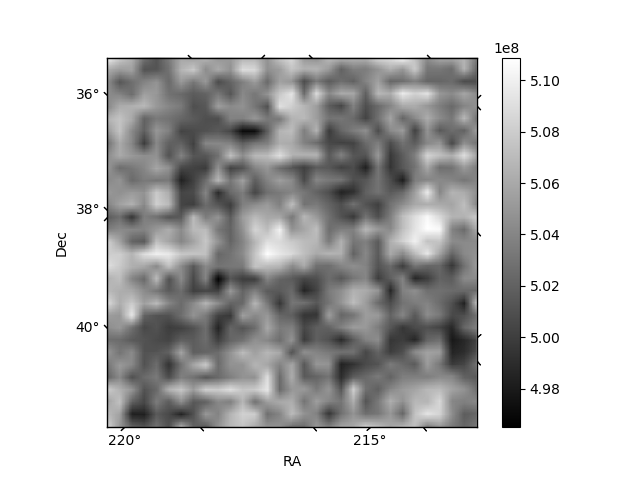
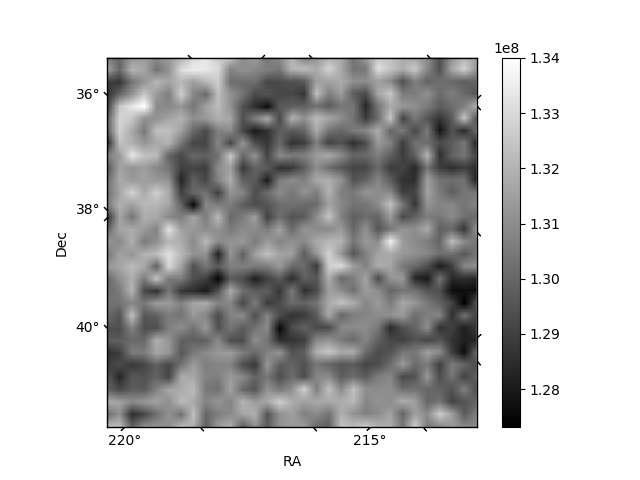
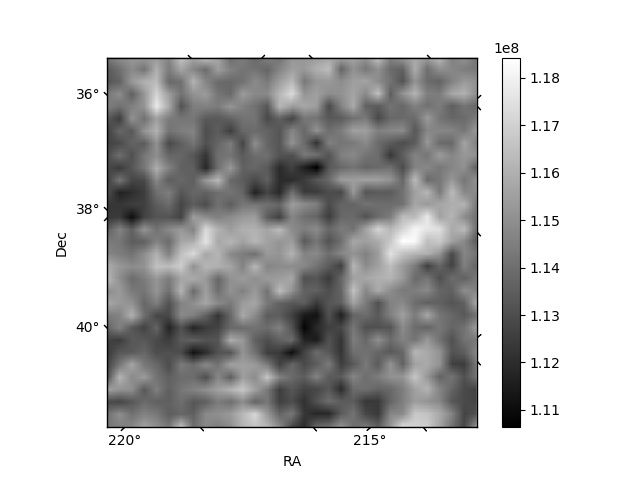
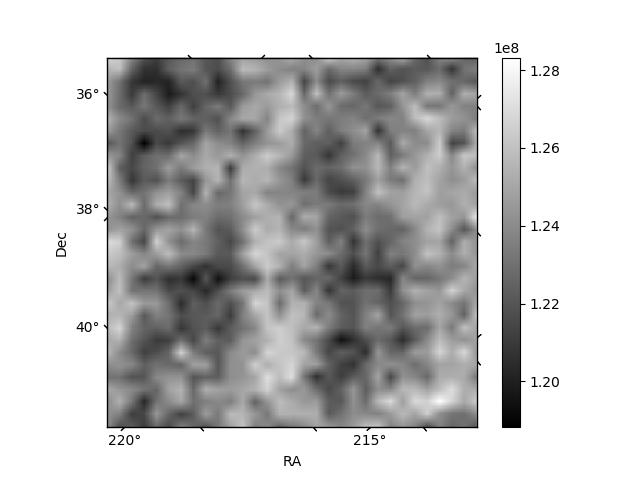
Histogram calculated using DETX and DETY for each event in the final _common_clean file
| Quadrant A | 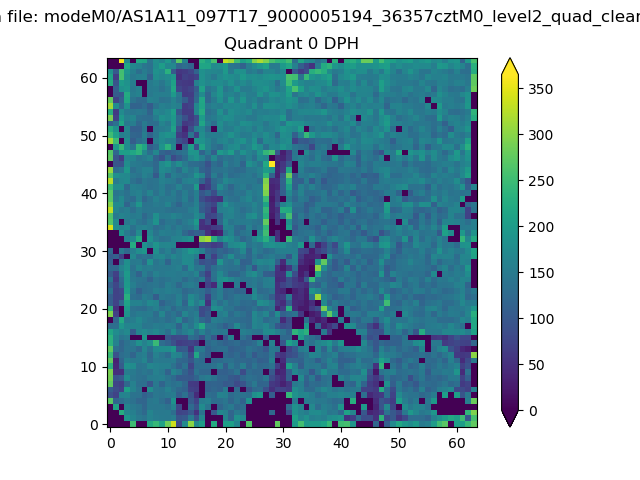 |
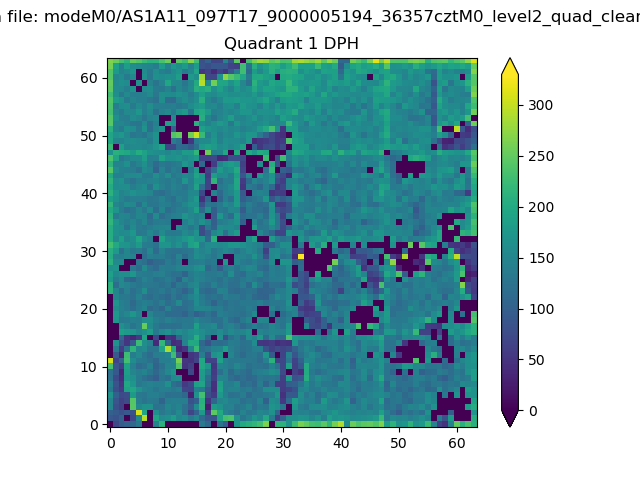 |
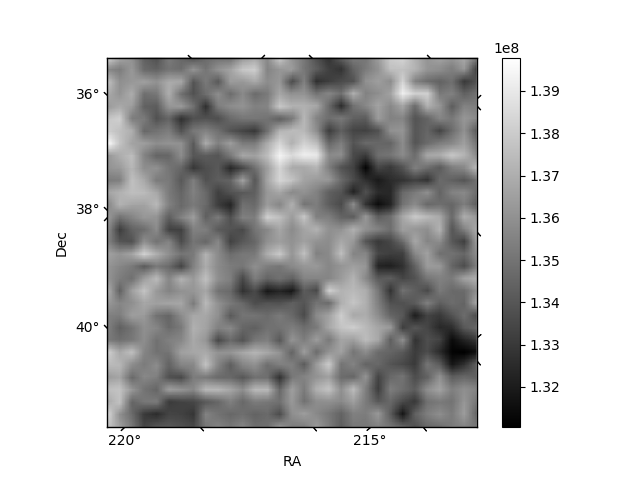
Quadrant B |
|---|---|---|---|
| Quadrant D | 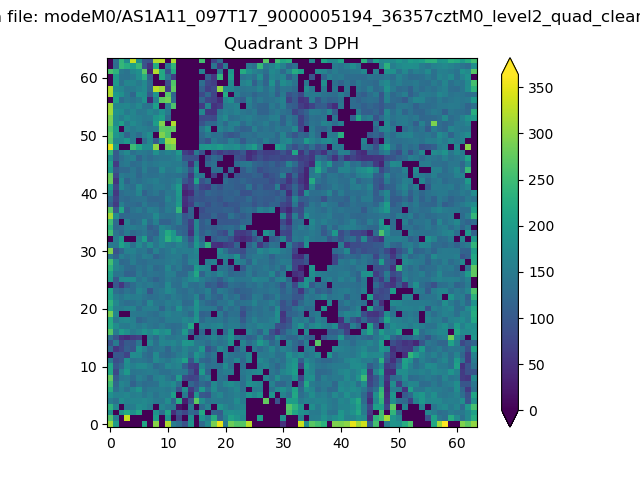 |
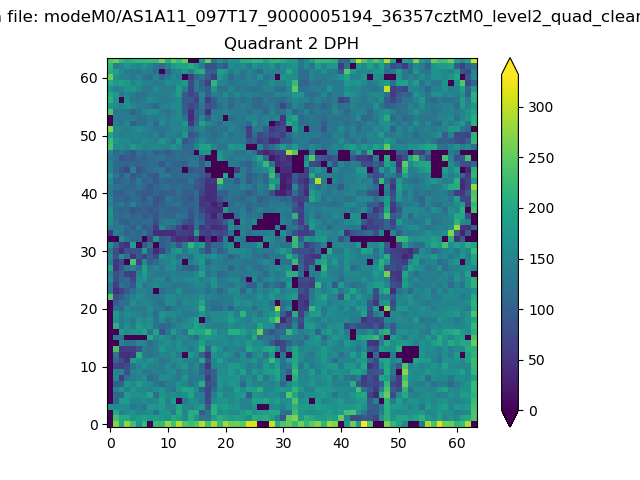 |
Quadrant C |
| Plot type | Count rate plots | Images |
|---|---|---|
| Comparison with Poisson distribution Blue bars denote a histogram of data divided into 1 sec bins. Red curve is a Poisson curve with rate = median count rate of data. |
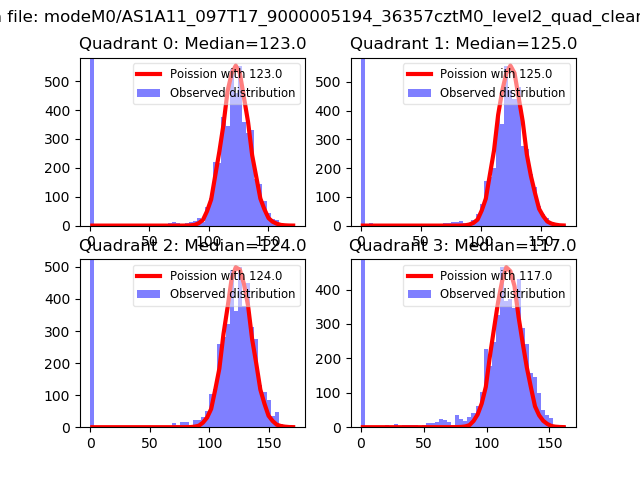 |
 |
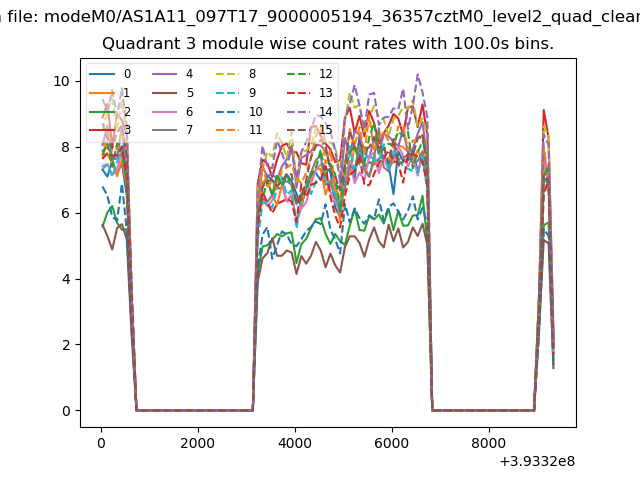
| Quadrant-wise count rates Data is divided into 100 sec bins |
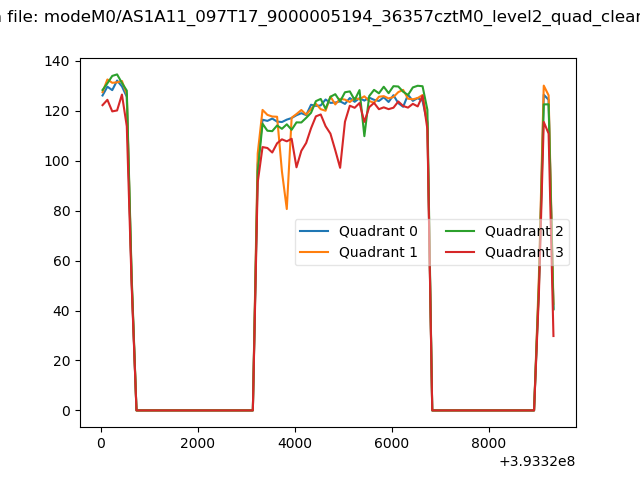 |
|
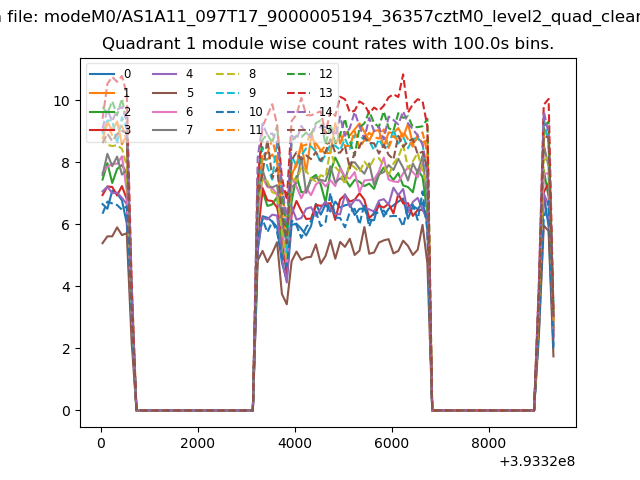
| Module-wise count rates for Quadrant A Data is divided into 100 sec bins |
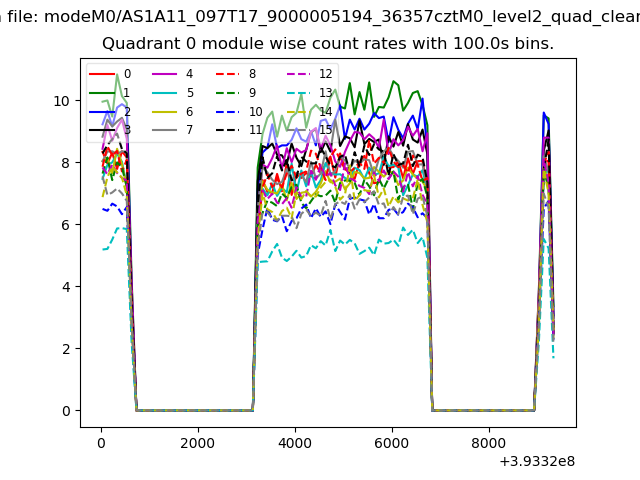 |
 |
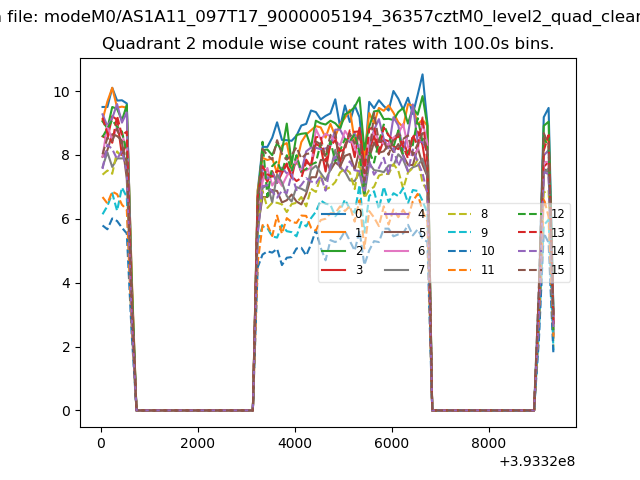
| Module-wise count rates for Quadrant B Data is divided into 100 sec bins |
 |
 |
| Module-wise count rates for Quadrant C Data is divided into 100 sec bins |
 |
 |
| Module-wise count rates for Quadrant D Data is divided into 100 sec bins |
 |
 |
| Parameter | Plot |
|---|---|
| CZT HV Monitor | 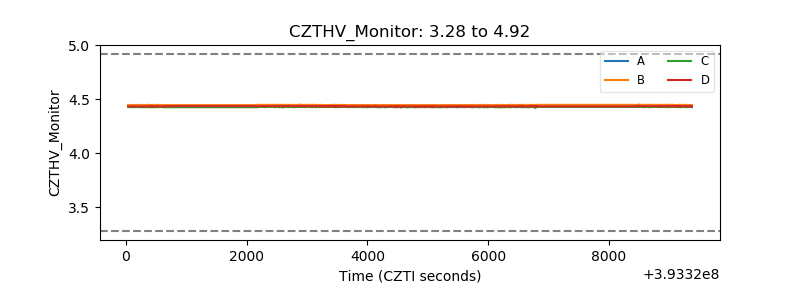 |
| D_VDD | 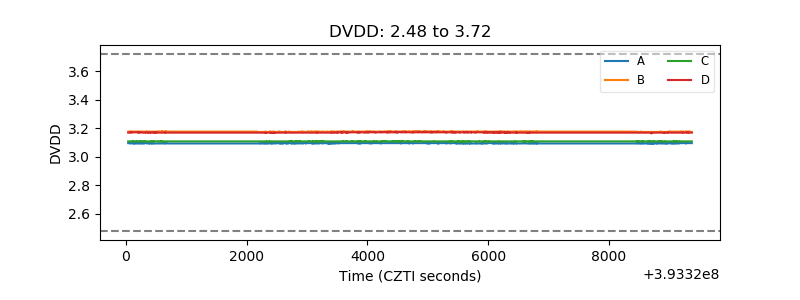 |
| Temperature 1 | 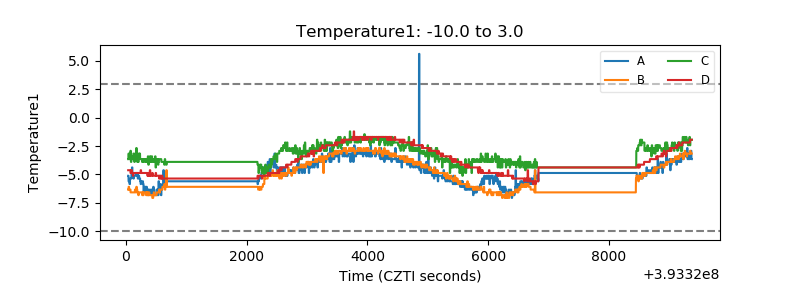 |
| Veto HV Monitor | 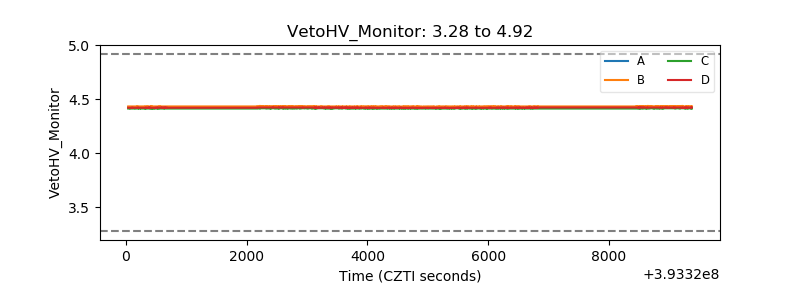 |
| Veto LLD | 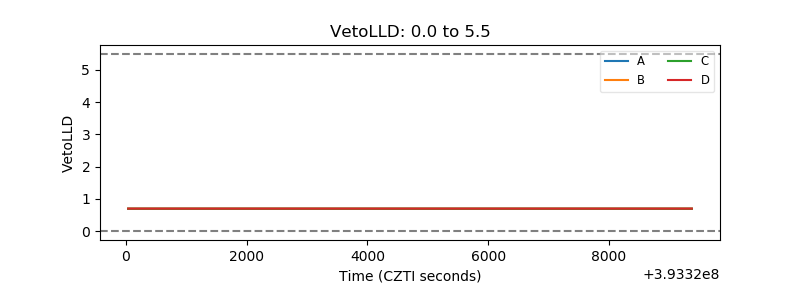 |
| Alpha Counter | 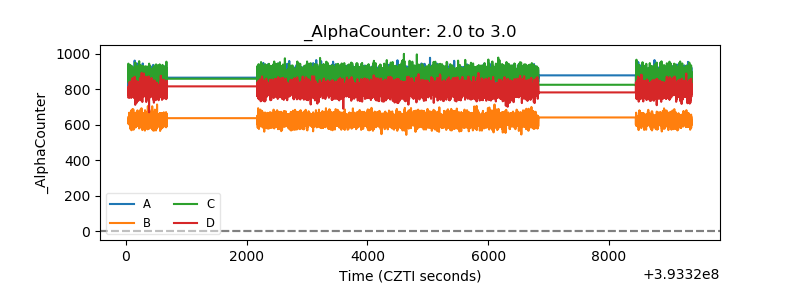 |
| _CPM_Rate | 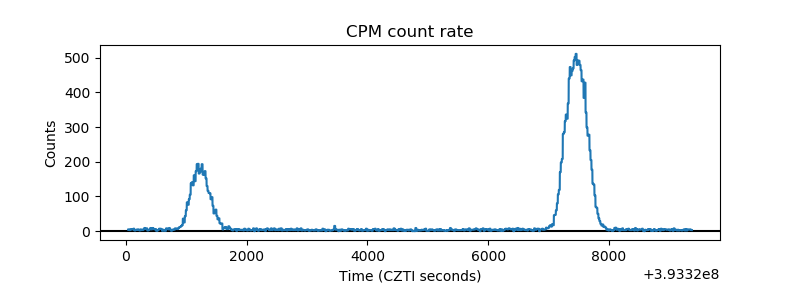 |
| CZT Counter | 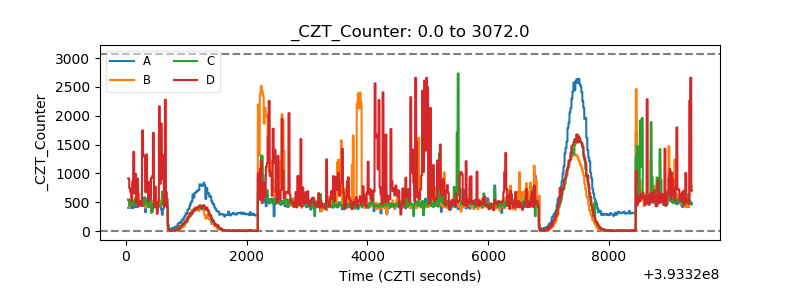 |
| +2.5 Volts monitor | 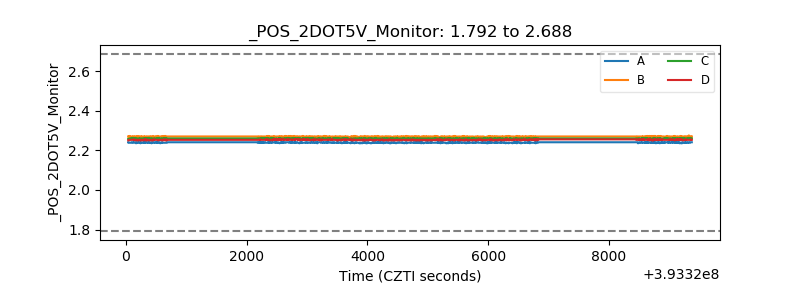 |
| +5 Volts monitor | 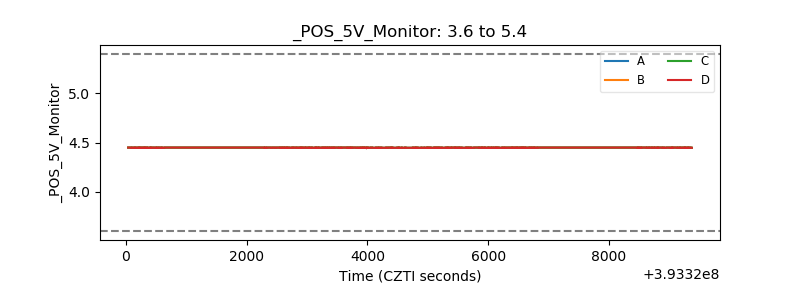 |
| _ROLL_ROT | 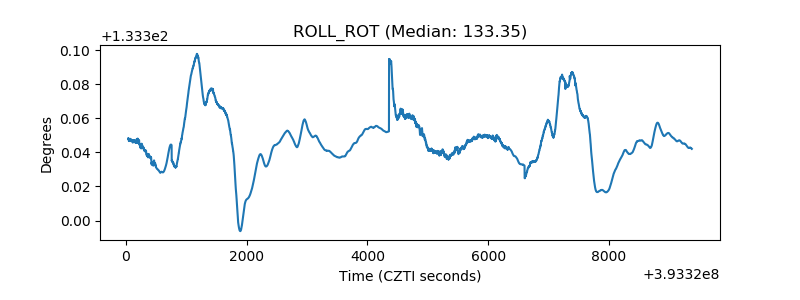 |
| _Roll_DEC | 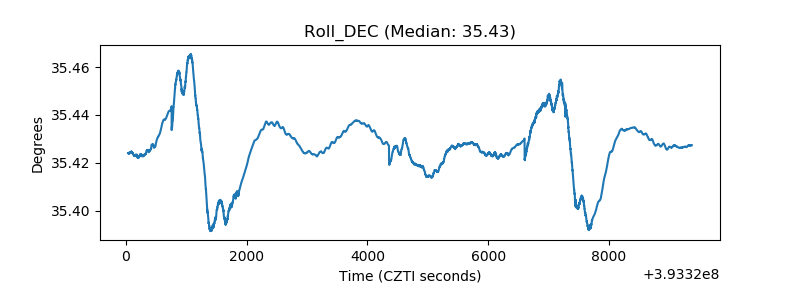 |
| _Roll_RA | 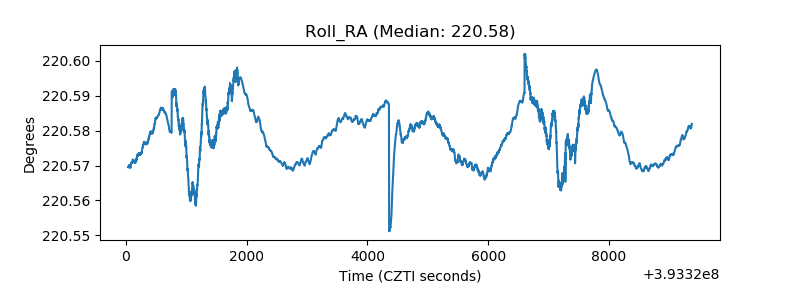 |
| Veto Counter | 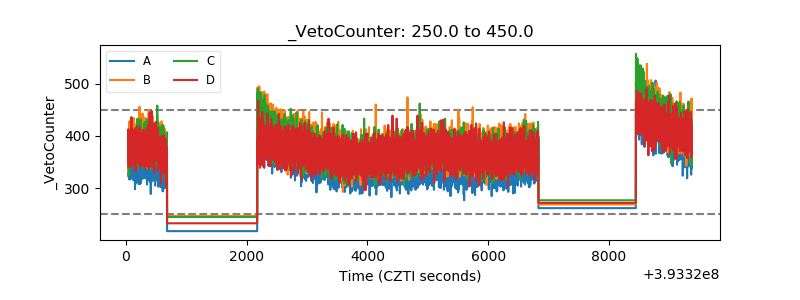 |