| Param | Original file | Final file |
|---|---|---|
| Filename | modeM0/AS1A11_097T17_9000005194cztM0_level2.evt | modeM0/AS1A11_097T17_9000005194cztM0_level2_quad_clean.evt |
| Size (bytes) | 4,722,065,280 | 790,551,360 |
| Size | 4.4 GB | 753.9 MB |
| Events in quadrant A | 28,514,835 | 5,084,981 |
| Events in quadrant B | 36,214,461 | 5,037,178 |
| Events in quadrant C | 32,174,501 | 5,091,709 |
| Events in quadrant D | 42,181,241 | 4,733,338 |
| Mode SS | |||
|---|---|---|---|
| Quadrant | BADHDUFLAG | Total packets | Discarded packets |
| A | 0 | 1196 | 0 |
| B | 0 | 1196 | 0 |
| C | 0 | 1196 | 0 |
| D | 0 | 1196 | 0 |
| Mode M0 | |||
|---|---|---|---|
| Quadrant | BADHDUFLAG | Total packets | Discarded packets |
| A | 0 | 121868 | 0 |
| B | 0 | 145784 | 0 |
| C | 0 | 130704 | 0 |
| D | 0 | 164750 | 0 |
| Mode M9 | |||
|---|---|---|---|
| Quadrant | BADHDUFLAG | Total packets | Discarded packets |
| A | 0 | 221 | 0 |
| B | 0 | 221 | 0 |
| C | 0 | 221 | 0 |
| D | 0 | 221 | 0 |
| Quadrant | Total seconds | Saturated seconds | Saturation percentage |
|---|---|---|---|
| A | 58266 | 118 | 0.202519% |
| B | 58266 | 2124 | 3.645351% |
| C | 58264 | 891 | 1.529246% |
| D | 58266 | 2917 | 5.006350% |
Noise dominated data is calculated using 1-second bins in cleaned event files. If a bin has >2000 counts, and if more than 50% of those come from <1% of pixels, then it is considered to be noise-dominated and hence unusable.
| Quadrant | # 1 sec bins | Bins with >0 counts | Bins with >2000 counts | High rate bins dominated by noise | Noise dominated (total time) | Noise dominated (detector-on time) | Marked lightcurve |
|---|---|---|---|---|---|---|---|
| A | 80550 | 58280 | 35 | 35 | 0.04% | 0.06% | 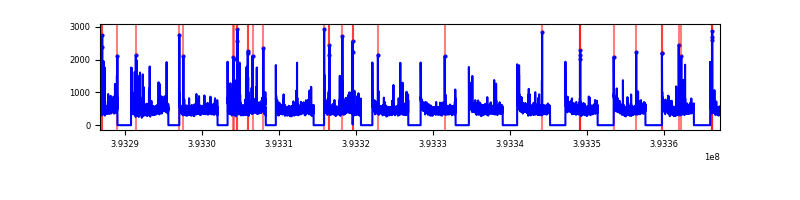 |
| B | 80550 | 58280 | 1648 | 1648 | 2.05% | 2.83% | 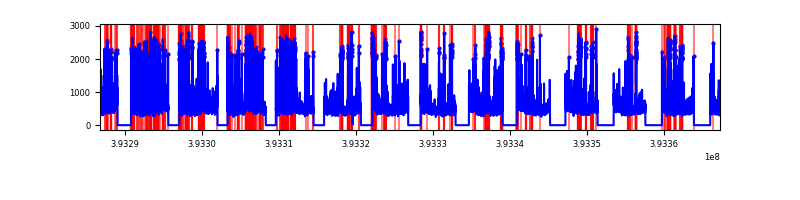 |
| C | 80550 | 58278 | 837 | 837 | 1.04% | 1.44% | 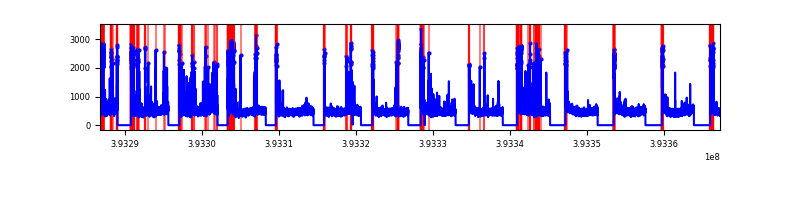 |
| D | 80549 | 58278 | 3032 | 3032 | 3.76% | 5.20% | 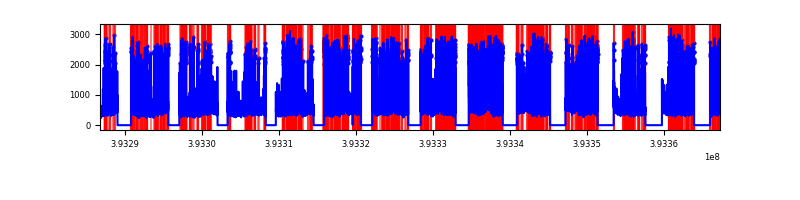 |
Top three noisy pixels from each quadrant. If the there are fewer than three noisy pixels in the level2.evt file, extra rows are filled as -1
| Pixel properties | Quadrant properties | ||||||
|---|---|---|---|---|---|---|---|
| Quadrant | DetID | PixID | Counts | Sigma | Mean | Median | Sigma |
| A | 10 | 83 | 1582450 | 1176.92 | 6737 | 6612 | 1338.9 |
| A | 9 | 143 | 440822 | 324.29 | 6737 | 6612 | 1338.9 |
| A | 12 | 189 | 364097 | 266.99 | 6737 | 6612 | 1338.9 |
| B | 5 | 172 | 5202683 | 4178.91 | 6593 | 6418 | 1243.5 |
| B | 5 | 236 | 3263456 | 2619.35 | 6593 | 6418 | 1243.5 |
| B | 0 | 189 | 516662 | 410.34 | 6593 | 6418 | 1243.5 |
| C | 0 | 207 | 2780864 | 1839.09 | 6560 | 6619 | 1508.5 |
| C | 15 | 214 | 2428098 | 1605.24 | 6560 | 6619 | 1508.5 |
| C | 0 | 10 | 1422790 | 938.8 | 6560 | 6619 | 1508.5 |
| D | 12 | 6 | 6978979 | 4465.56 | 6468 | 6307 | 1561.4 |
| D | 2 | 249 | 2912724 | 1861.38 | 6468 | 6307 | 1561.4 |
| D | 13 | 171 | 1907334 | 1217.49 | 6468 | 6307 | 1561.4 |
Histogram calculated using DETX and DETY for each event in the final _common_clean file
| Quadrant A | 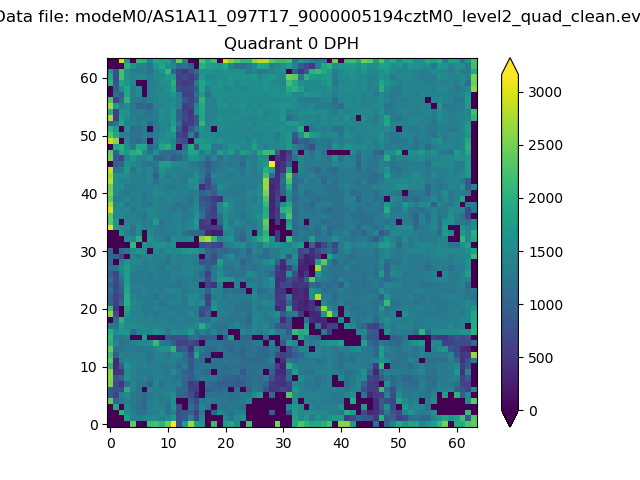 |
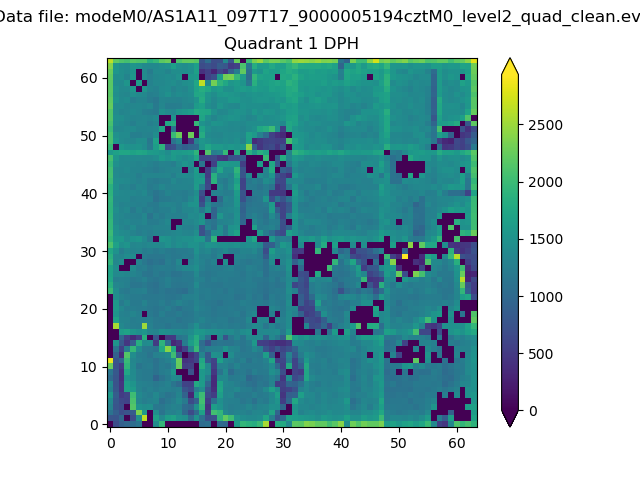 |
Quadrant B |
|---|---|---|---|
| Quadrant D | 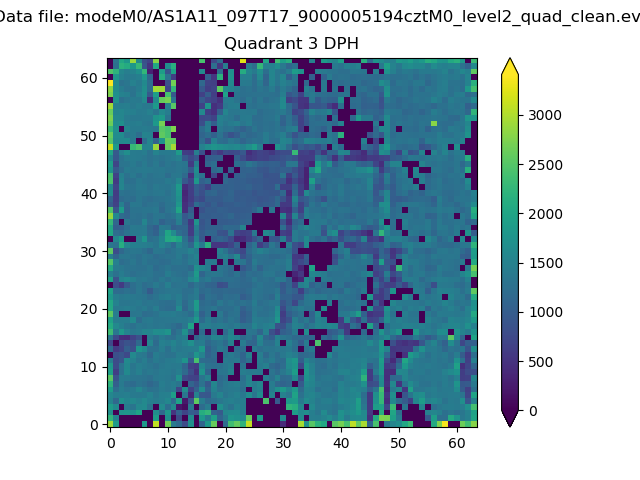 |
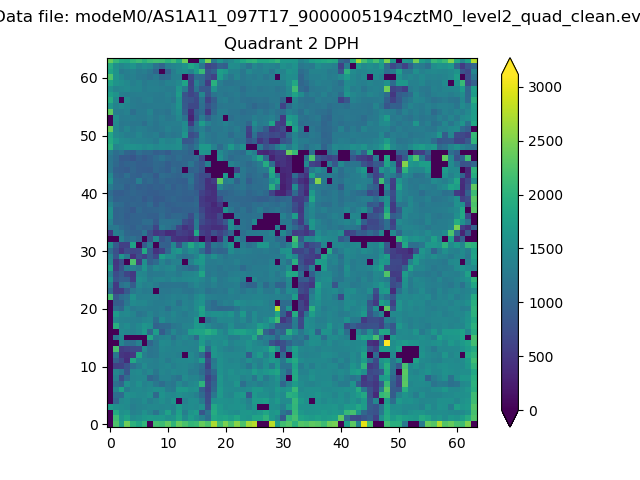 |
Quadrant C |
| Plot type | Count rate plots | Images |
|---|---|---|
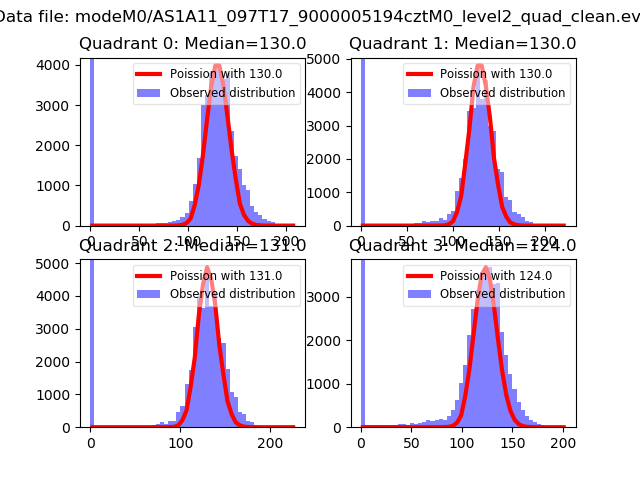
| Comparison with Poisson distribution Blue bars denote a histogram of data divided into 1 sec bins. Red curve is a Poisson curve with rate = median count rate of data. |
 |
 |
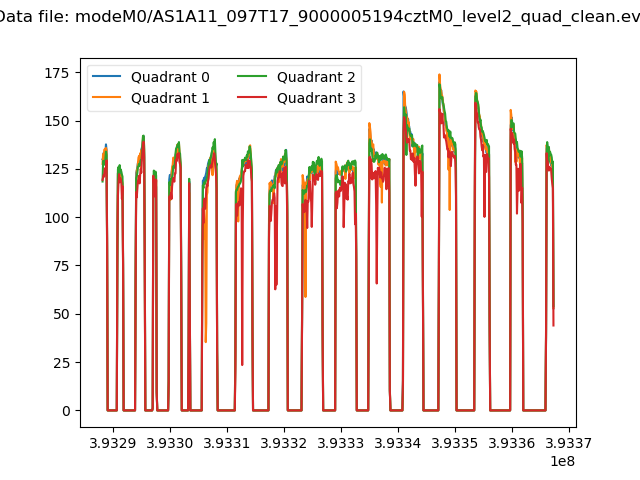
| Quadrant-wise count rates Data is divided into 100 sec bins |
 |
|
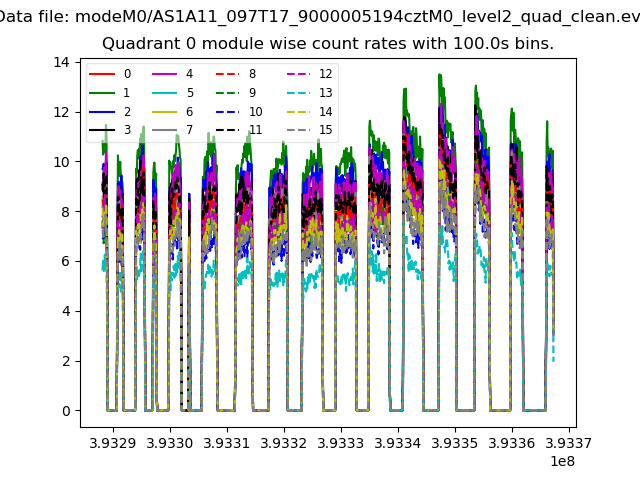
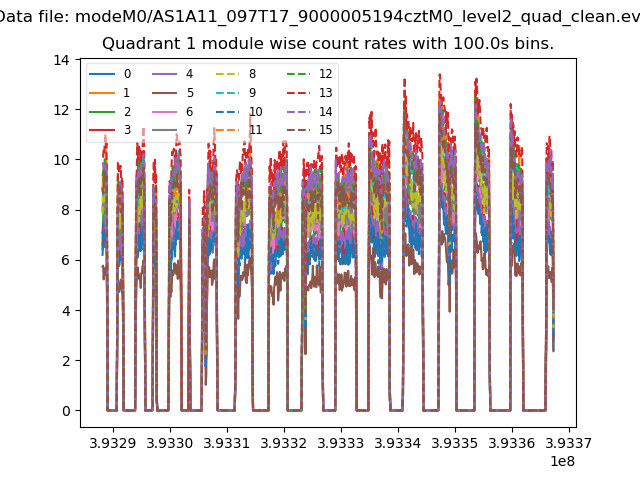
| Module-wise count rates for Quadrant A Data is divided into 100 sec bins |
 |
 |
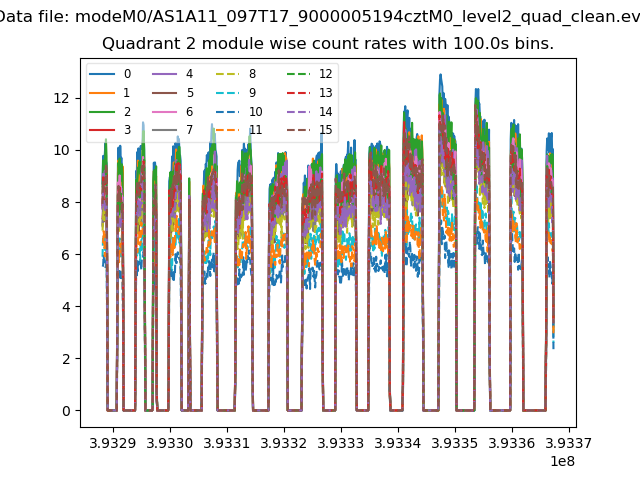
| Module-wise count rates for Quadrant B Data is divided into 100 sec bins |
 |
 |
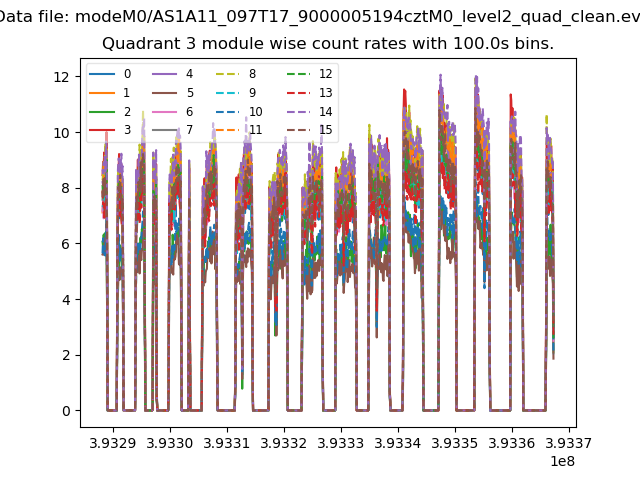
| Module-wise count rates for Quadrant C Data is divided into 100 sec bins |
 |
 |
| Module-wise count rates for Quadrant D Data is divided into 100 sec bins |
 |
 |
| Parameter | Plot |
|---|---|
| CZT HV Monitor | 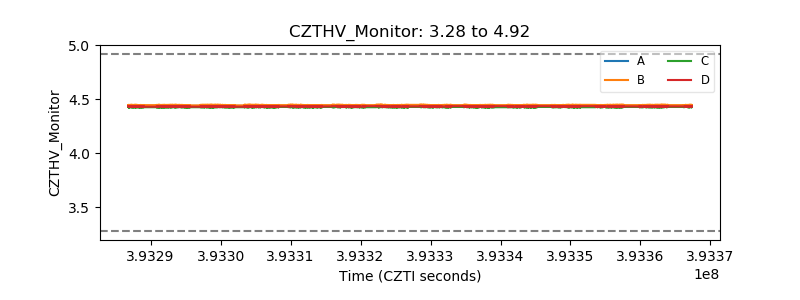 |
| D_VDD | 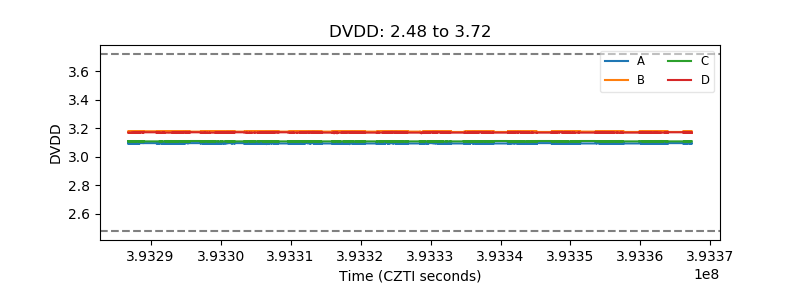 |
| Temperature 1 | 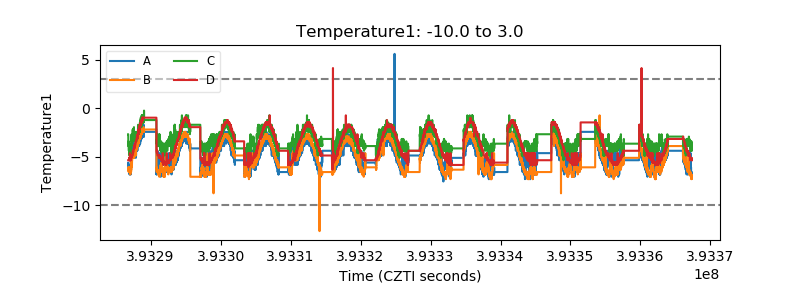 |
| Veto HV Monitor |  |
| Veto LLD | 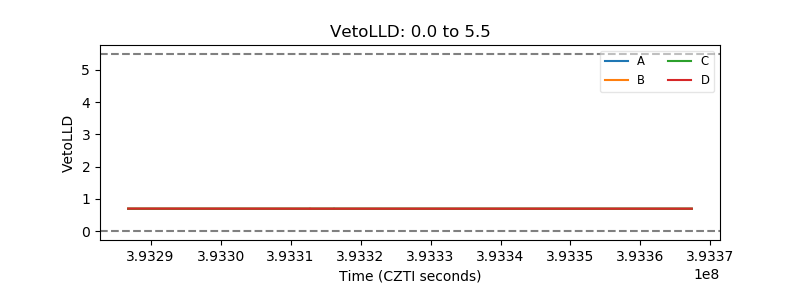 |
| Alpha Counter | 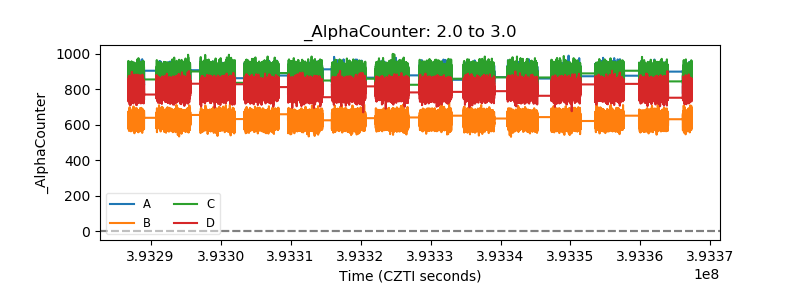 |
| _CPM_Rate | 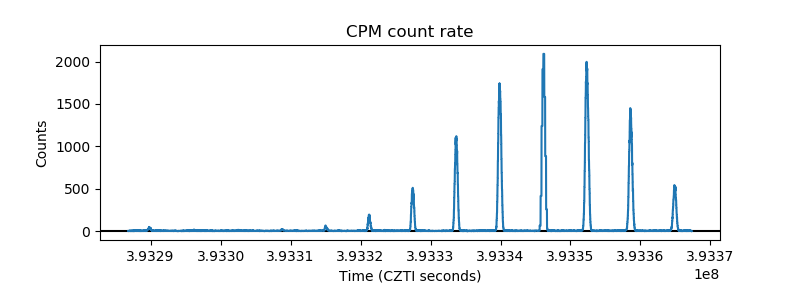 |
| CZT Counter | 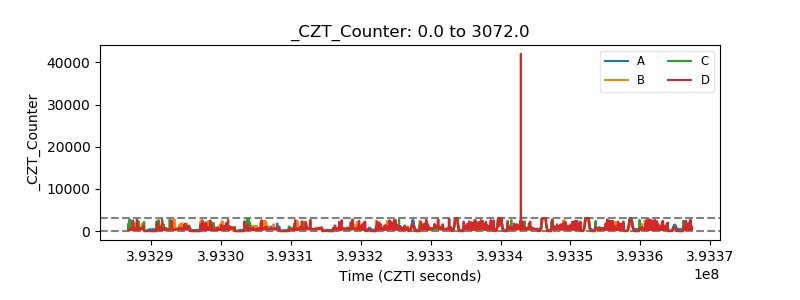 |
| +2.5 Volts monitor | 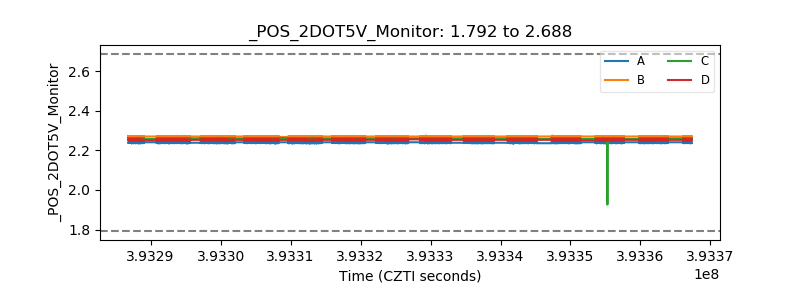 |
| +5 Volts monitor | 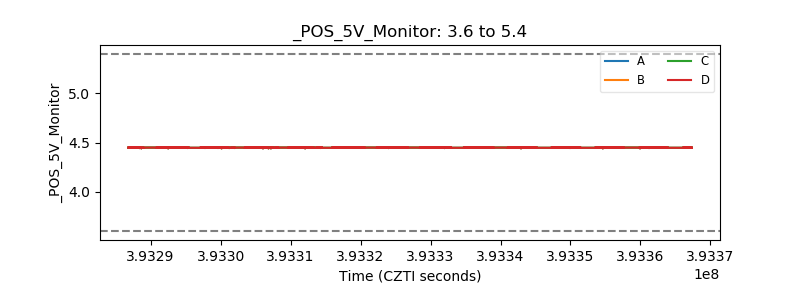 |
| _ROLL_ROT | 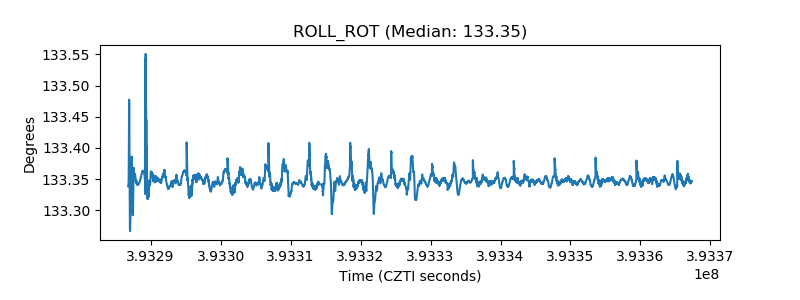 |
| _Roll_DEC |  |
| _Roll_RA | 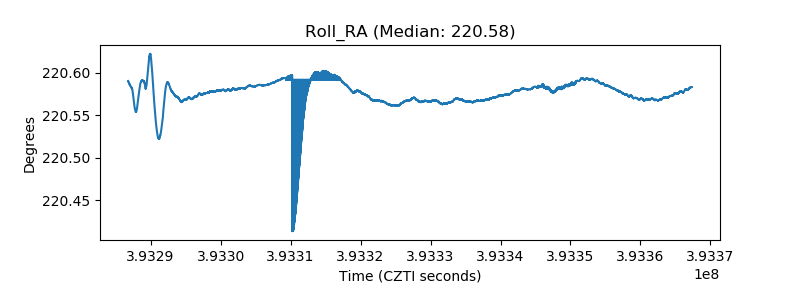 |
| Veto Counter | 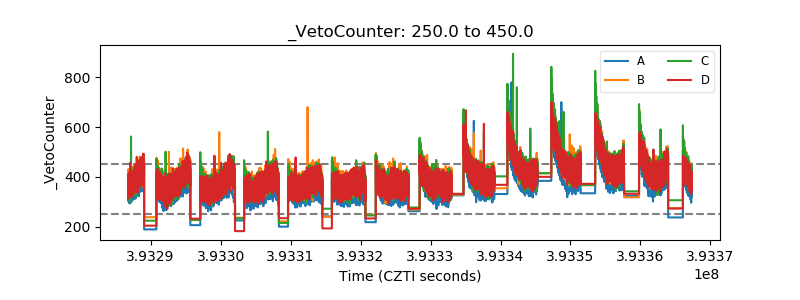 |