| Param | Original file | Final file |
|---|---|---|
| Filename | modeM0/AS1A10_103T02_9000005192_36349cztM0_level2.evt | modeM0/AS1A10_103T02_9000005192_36349cztM0_level2_quad_clean.evt |
| Size (bytes) | 406,848,960 | 81,803,520 |
| Size | 388.0 MB | 78.0 MB |
| Events in quadrant A | 2,434,071 | 558,046 |
| Events in quadrant B | 2,973,667 | 542,208 |
| Events in quadrant C | 2,615,221 | 533,904 |
| Events in quadrant D | 3,966,899 | 500,805 |
| Mode M9 | |||
|---|---|---|---|
| Quadrant | BADHDUFLAG | Total packets | Discarded packets |
| A | 0 | 23 | 0 |
| B | 0 | 23 | 0 |
| C | 0 | 23 | 0 |
| D | 0 | 24 | 0 |
| Mode SS | |||
|---|---|---|---|
| Quadrant | BADHDUFLAG | Total packets | Discarded packets |
| A | 0 | 100 | 0 |
| B | 0 | 100 | 0 |
| C | 0 | 100 | 0 |
| D | 0 | 100 | 0 |
| Mode M0 | |||
|---|---|---|---|
| Quadrant | BADHDUFLAG | Total packets | Discarded packets |
| A | 0 | 10393 | 3 |
| B | 0 | 12015 | 2 |
| C | 0 | 10777 | 2 |
| D | 0 | 15107 | 2 |
| Quadrant | Total seconds | Saturated seconds | Saturation percentage |
|---|---|---|---|
| A | 4875 | 15 | 0.307692% |
| B | 4875 | 217 | 4.451282% |
| C | 4875 | 67 | 1.374359% |
| D | 4875 | 284 | 5.825641% |
Noise dominated data is calculated using 1-second bins in cleaned event files. If a bin has >2000 counts, and if more than 50% of those come from <1% of pixels, then it is considered to be noise-dominated and hence unusable.
| Quadrant | # 1 sec bins | Bins with >0 counts | Bins with >2000 counts | High rate bins dominated by noise | Noise dominated (total time) | Noise dominated (detector-on time) | Marked lightcurve |
|---|---|---|---|---|---|---|---|
| A | 6997 | 4876 | 12 | 12 | 0.17% | 0.25% | 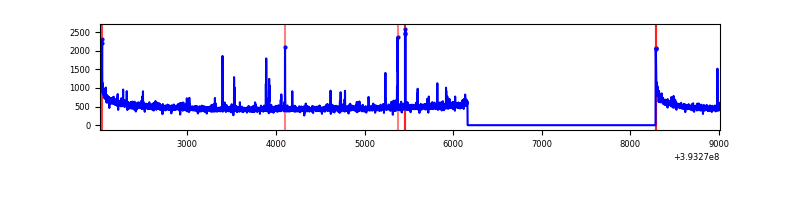 |
| B | 6997 | 4876 | 176 | 176 | 2.52% | 3.61% | 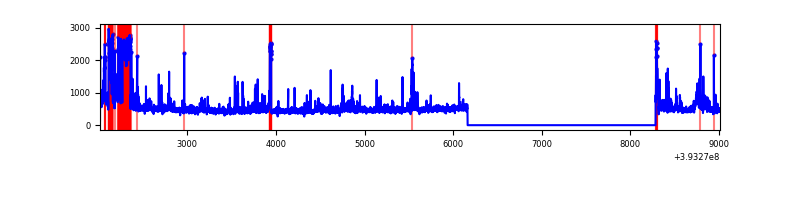 |
| C | 6997 | 4876 | 61 | 61 | 0.87% | 1.25% | 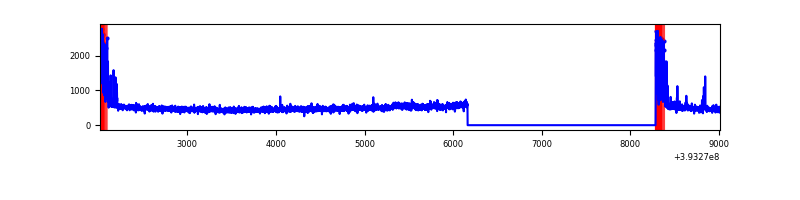 |
| D | 6997 | 4876 | 322 | 322 | 4.60% | 6.60% | 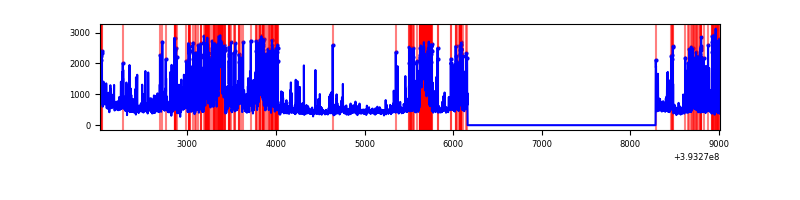 |
Top three noisy pixels from each quadrant. If the there are fewer than three noisy pixels in the level2.evt file, extra rows are filled as -1
| Pixel properties | Quadrant properties | ||||||
|---|---|---|---|---|---|---|---|
| Quadrant | DetID | PixID | Counts | Sigma | Mean | Median | Sigma |
| A | 10 | 83 | 178371 | 1565.22 | 561 | 552 | 113.6 |
| A | 9 | 143 | 51226 | 446.05 | 561 | 552 | 113.6 |
| A | 7 | 3 | 11536 | 96.68 | 561 | 552 | 113.6 |
| B | 5 | 236 | 445766 | 4345.51 | 547 | 534 | 102.5 |
| B | 5 | 172 | 98492 | 956.08 | 547 | 534 | 102.5 |
| B | 0 | 190 | 86919 | 843.13 | 547 | 534 | 102.5 |
| C | 0 | 10 | 253052 | 2034.8 | 538 | 543 | 124.1 |
| C | 15 | 214 | 208874 | 1678.8 | 538 | 543 | 124.1 |
| C | 0 | 207 | 42912 | 341.42 | 538 | 543 | 124.1 |
| D | 12 | 227 | 650483 | 5116.65 | 525 | 511 | 127.0 |
| D | 12 | 6 | 559987 | 4404.26 | 525 | 511 | 127.0 |
| D | 2 | 250 | 149236 | 1170.78 | 525 | 511 | 127.0 |
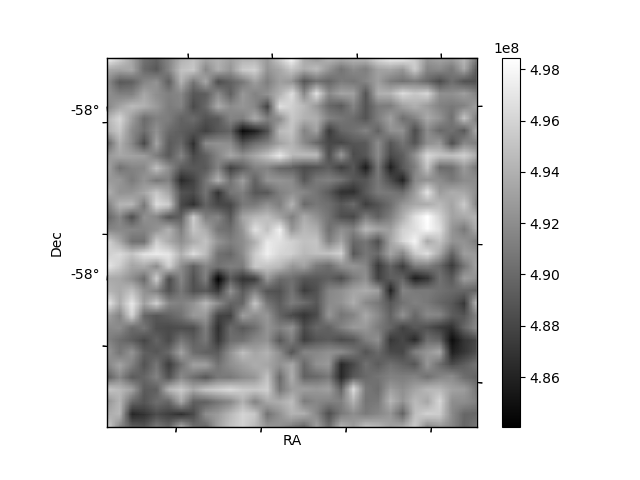
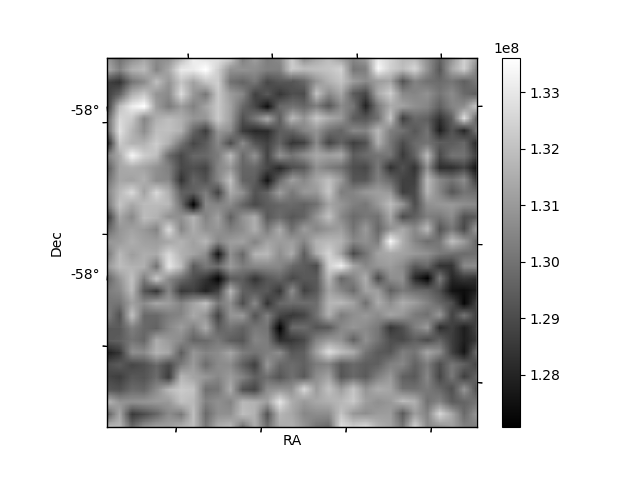
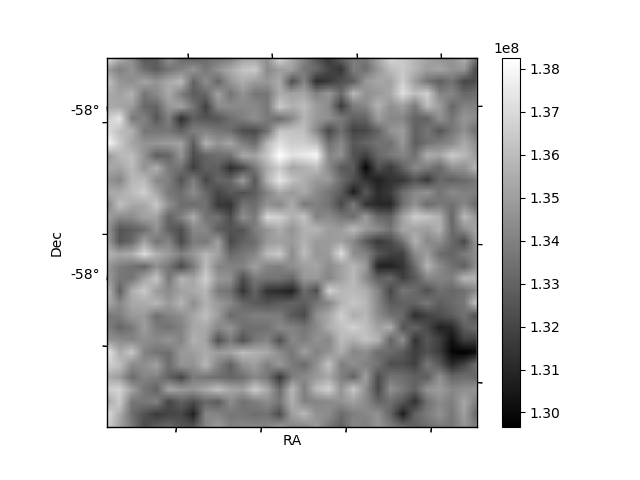
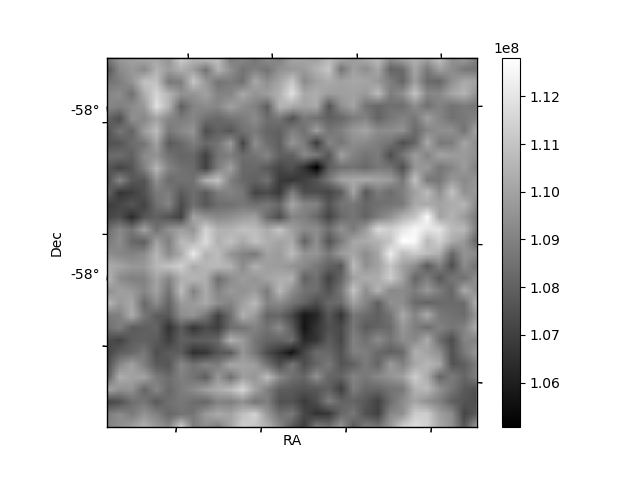
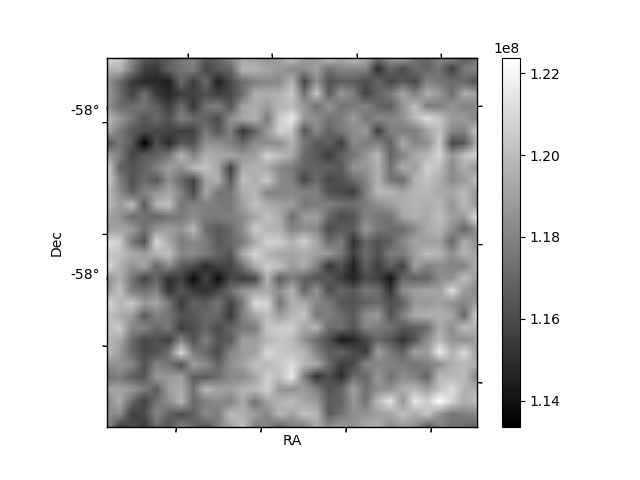
Histogram calculated using DETX and DETY for each event in the final _common_clean file
| Quadrant A | 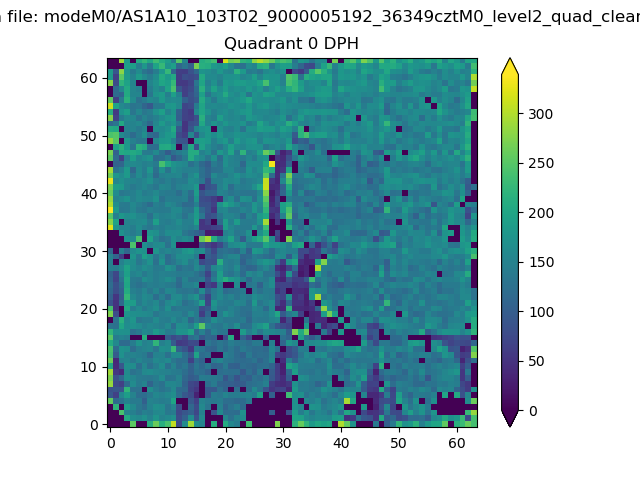 |
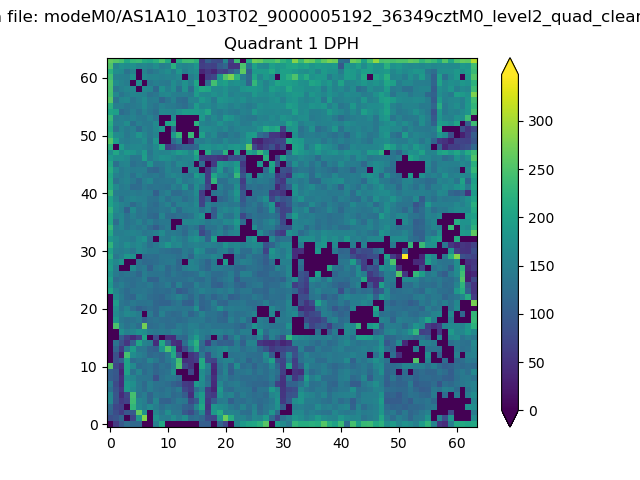 |
Quadrant B |
|---|---|---|---|
| Quadrant D | 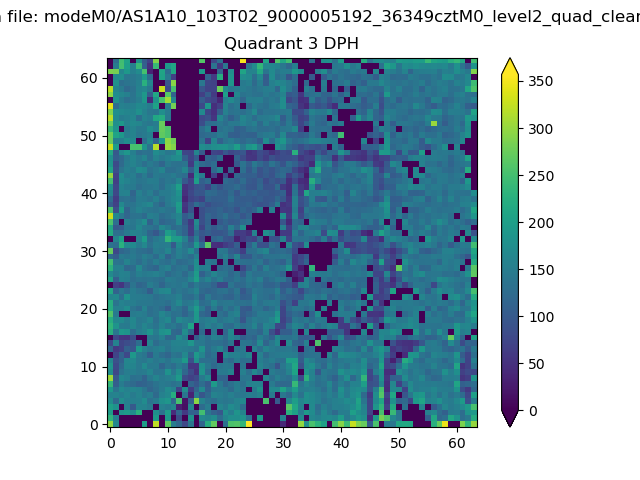 |
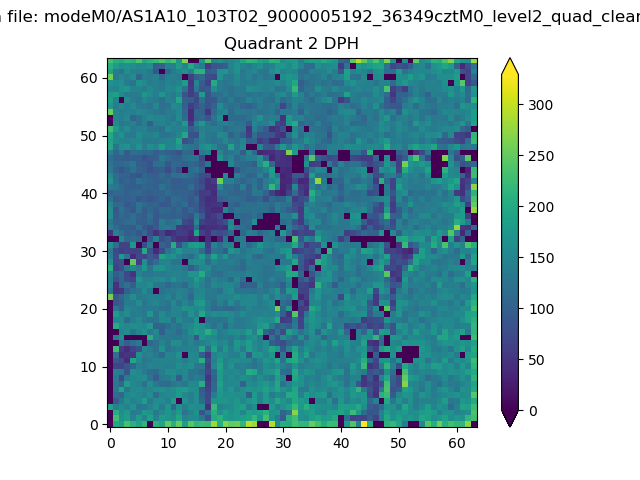 |
Quadrant C |
| Plot type | Count rate plots | Images |
|---|---|---|
| Comparison with Poisson distribution Blue bars denote a histogram of data divided into 1 sec bins. Red curve is a Poisson curve with rate = median count rate of data. |
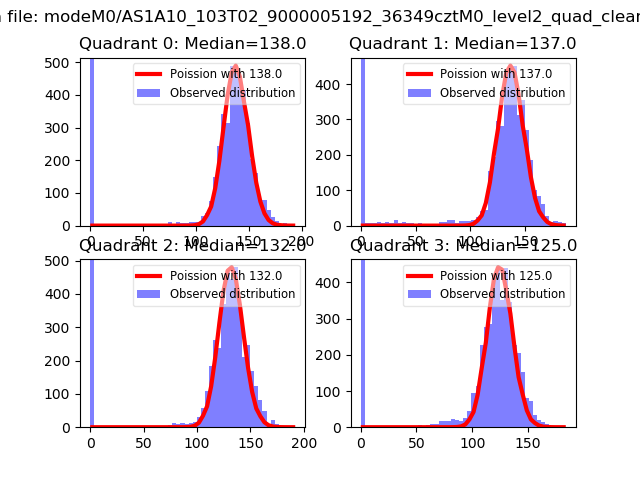 |
 |
| Quadrant-wise count rates Data is divided into 100 sec bins |
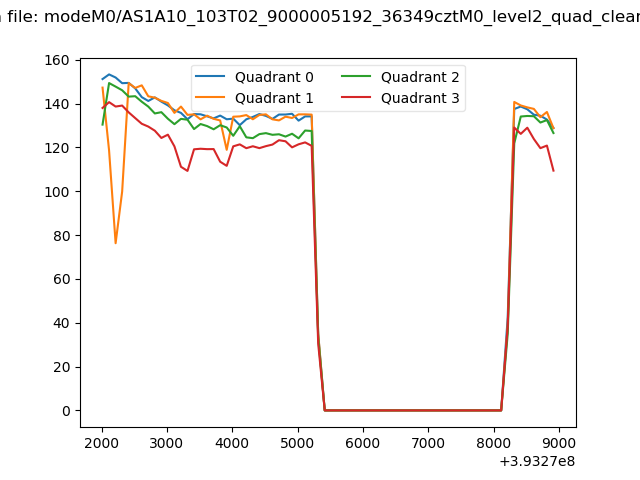 |
|
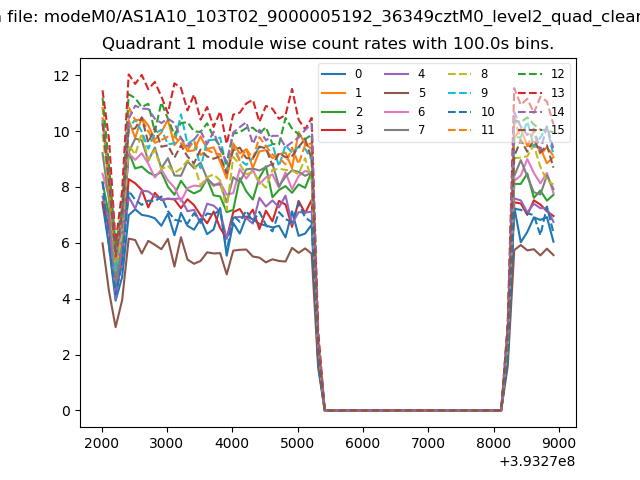
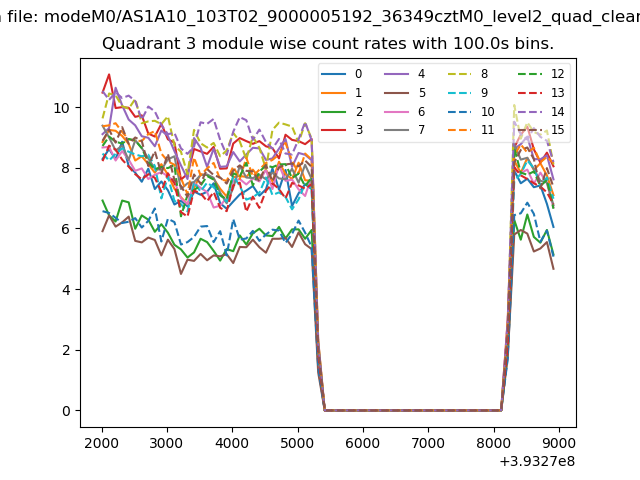
| Module-wise count rates for Quadrant A Data is divided into 100 sec bins |
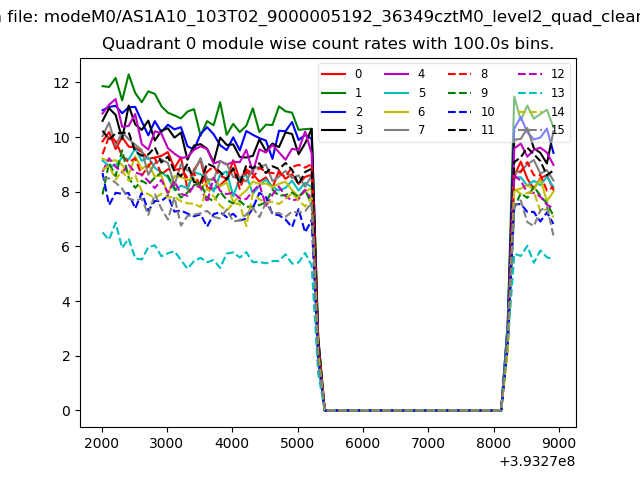 |
 |
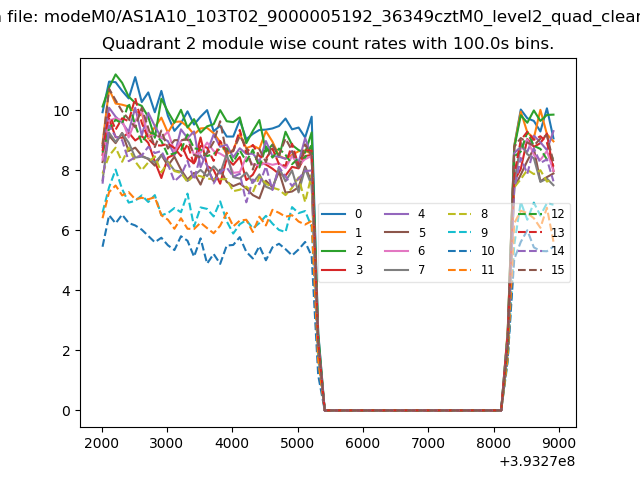
| Module-wise count rates for Quadrant B Data is divided into 100 sec bins |
 |
 |
| Module-wise count rates for Quadrant C Data is divided into 100 sec bins |
 |
 |
| Module-wise count rates for Quadrant D Data is divided into 100 sec bins |
 |
 |
| Parameter | Plot |
|---|---|
| CZT HV Monitor | 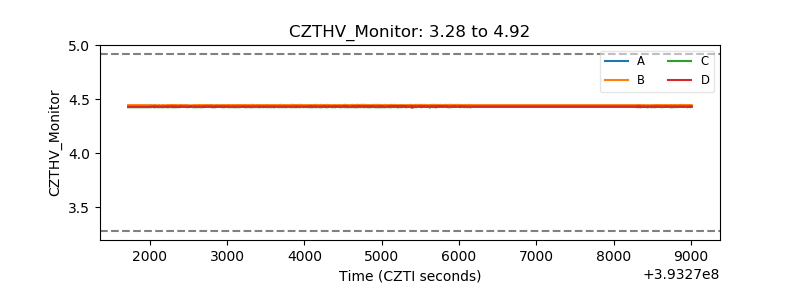 |
| D_VDD | 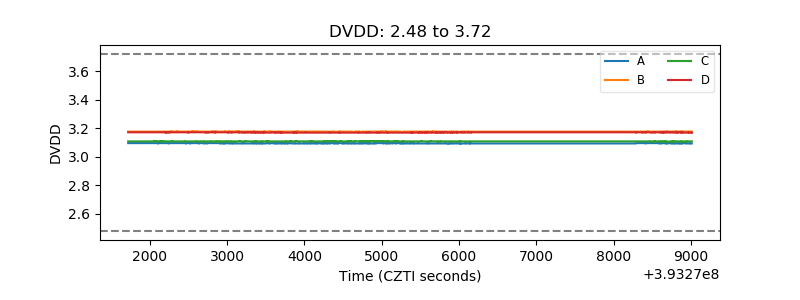 |
| Temperature 1 | 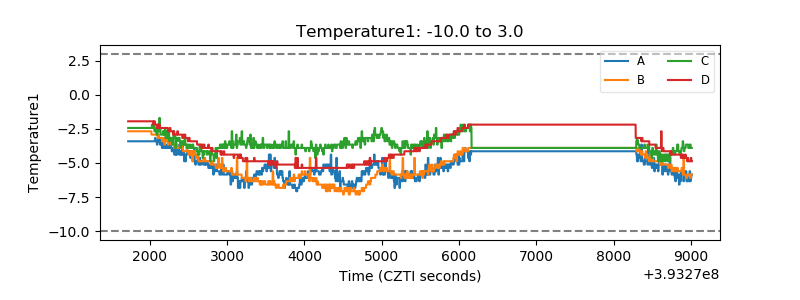 |
| Veto HV Monitor |  |
| Veto LLD | 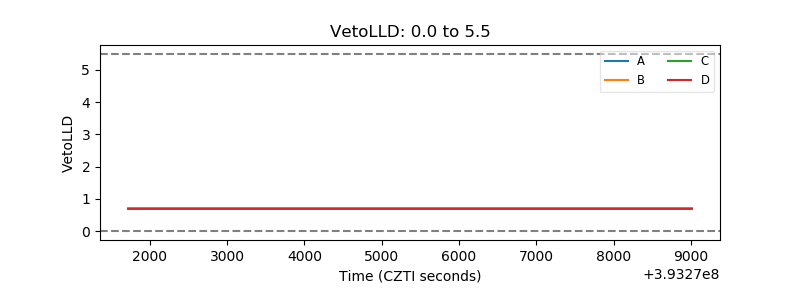 |
| Alpha Counter | 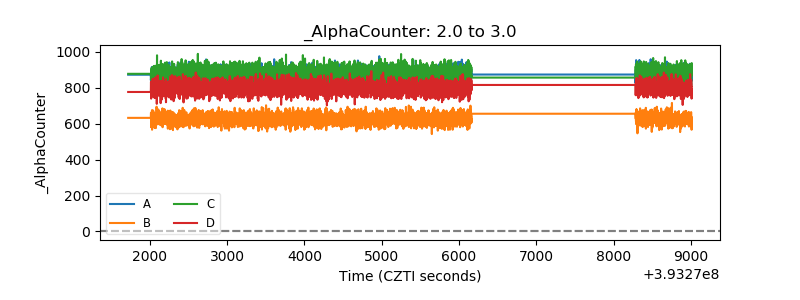 |
| _CPM_Rate | 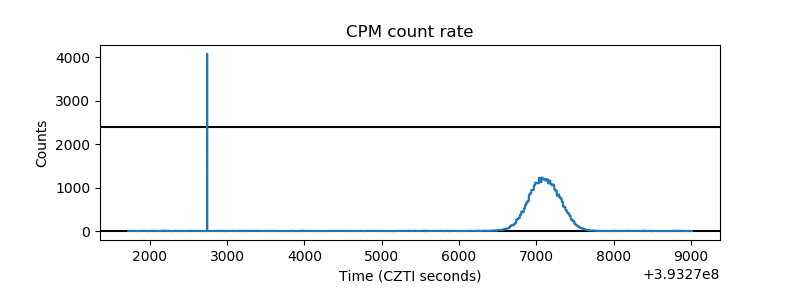 |
| CZT Counter | 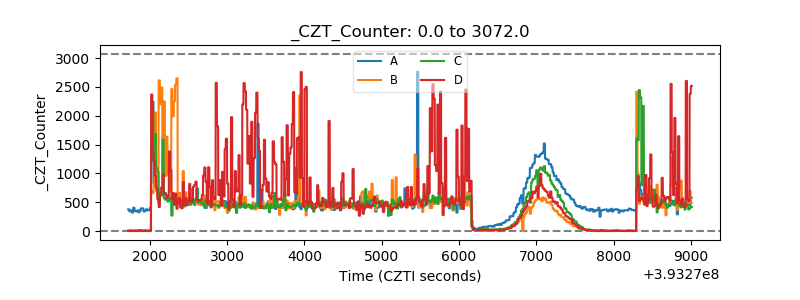 |
| +2.5 Volts monitor | 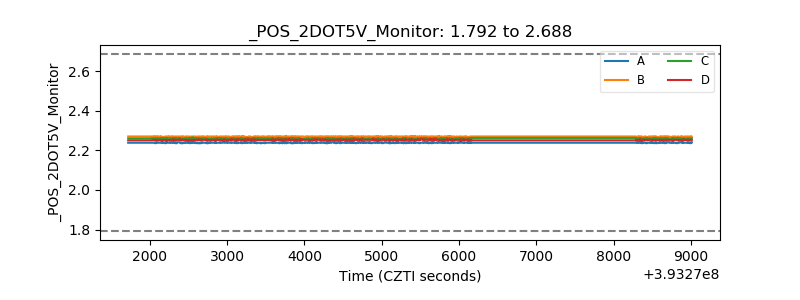 |
| +5 Volts monitor | 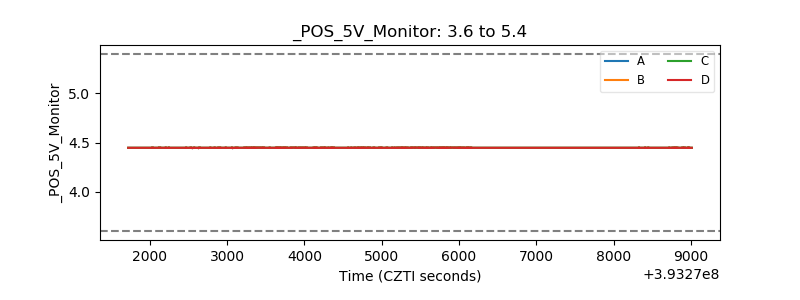 |
| _ROLL_ROT | 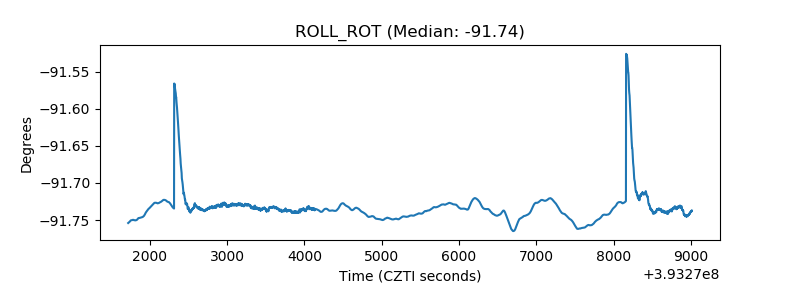 |
| _Roll_DEC | 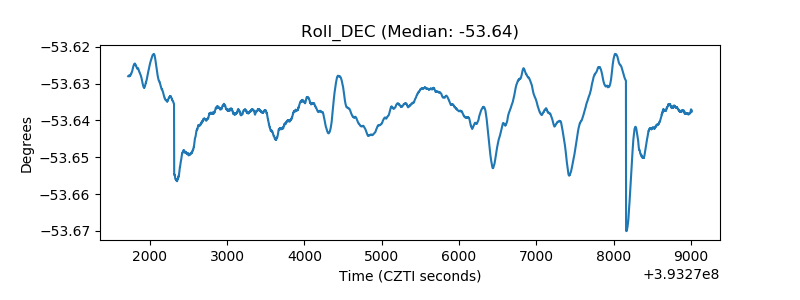 |
| _Roll_RA | 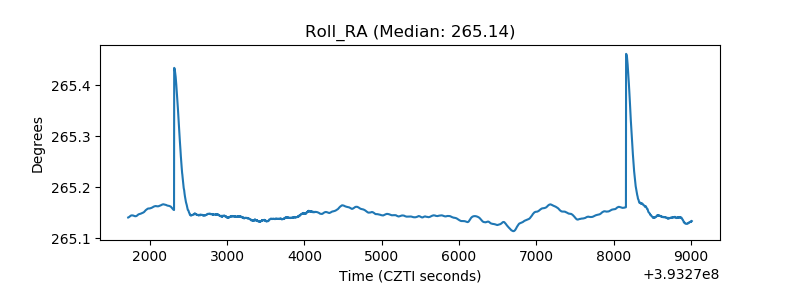 |
| Veto Counter | 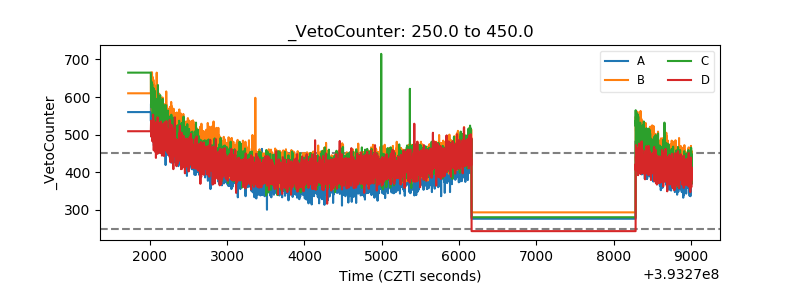 |