| Param | Original file | Final file |
|---|---|---|
| Filename | modeM0/AS1A10_103T02_9000005192_36348cztM0_level2.evt | modeM0/AS1A10_103T02_9000005192_36348cztM0_level2_quad_clean.evt |
| Size (bytes) | 463,858,560 | 96,721,920 |
| Size | 442.4 MB | 92.2 MB |
| Events in quadrant A | 2,655,359 | 674,988 |
| Events in quadrant B | 3,943,924 | 653,688 |
| Events in quadrant C | 2,929,502 | 642,677 |
| Events in quadrant D | 4,174,273 | 601,197 |
| Mode M9 | |||
|---|---|---|---|
| Quadrant | BADHDUFLAG | Total packets | Discarded packets |
| A | 0 | 24 | 0 |
| B | 0 | 24 | 0 |
| C | 0 | 24 | 0 |
| D | 0 | 25 | 0 |
| Mode SS | |||
|---|---|---|---|
| Quadrant | BADHDUFLAG | Total packets | Discarded packets |
| A | 0 | 104 | 0 |
| B | 0 | 104 | 0 |
| C | 0 | 104 | 0 |
| D | 0 | 104 | 0 |
| Mode M0 | |||
|---|---|---|---|
| Quadrant | BADHDUFLAG | Total packets | Discarded packets |
| A | 0 | 11083 | 3 |
| B | 0 | 15078 | 2 |
| C | 0 | 11806 | 2 |
| D | 0 | 15874 | 2 |
| Quadrant | Total seconds | Saturated seconds | Saturation percentage |
|---|---|---|---|
| A | 5083 | 18 | 0.354122% |
| B | 5083 | 382 | 7.515247% |
| C | 5083 | 122 | 2.400157% |
| D | 5083 | 353 | 6.944718% |
Noise dominated data is calculated using 1-second bins in cleaned event files. If a bin has >2000 counts, and if more than 50% of those come from <1% of pixels, then it is considered to be noise-dominated and hence unusable.
| Quadrant | # 1 sec bins | Bins with >0 counts | Bins with >2000 counts | High rate bins dominated by noise | Noise dominated (total time) | Noise dominated (detector-on time) | Marked lightcurve |
|---|---|---|---|---|---|---|---|
| A | 7205 | 5084 | 14 | 14 | 0.19% | 0.28% | 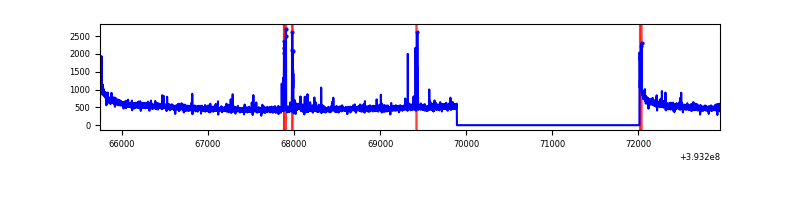 |
| B | 7205 | 5084 | 315 | 315 | 4.37% | 6.20% | 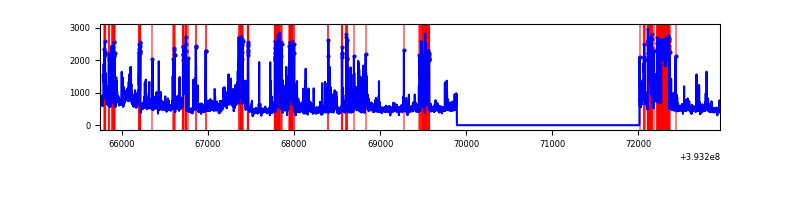 |
| C | 7205 | 5084 | 115 | 115 | 1.60% | 2.26% | 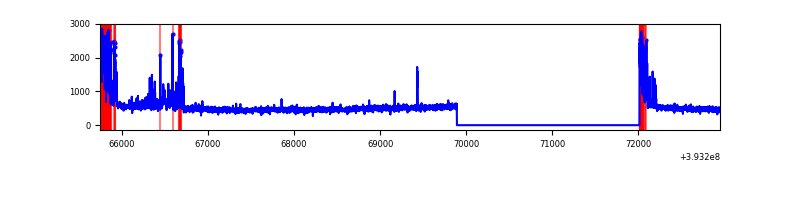 |
| D | 7205 | 5083 | 375 | 375 | 5.20% | 7.38% | 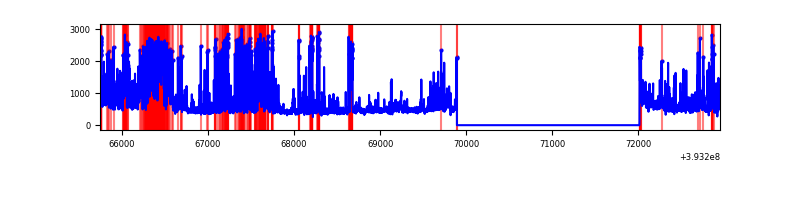 |
Top three noisy pixels from each quadrant. If the there are fewer than three noisy pixels in the level2.evt file, extra rows are filled as -1
| Pixel properties | Quadrant properties | ||||||
|---|---|---|---|---|---|---|---|
| Quadrant | DetID | PixID | Counts | Sigma | Mean | Median | Sigma |
| A | 10 | 83 | 188101 | 1525.91 | 609 | 600 | 122.9 |
| A | 9 | 143 | 75225 | 607.31 | 609 | 600 | 122.9 |
| A | 7 | 3 | 25587 | 203.35 | 609 | 600 | 122.9 |
| B | 5 | 172 | 717096 | 6562.42 | 584 | 572 | 109.2 |
| B | 5 | 236 | 562871 | 5149.92 | 584 | 572 | 109.2 |
| B | 4 | 171 | 100911 | 918.97 | 584 | 572 | 109.2 |
| C | 0 | 10 | 281584 | 2138.4 | 574 | 577 | 131.4 |
| C | 15 | 214 | 216959 | 1646.62 | 574 | 577 | 131.4 |
| C | 0 | 207 | 159825 | 1211.84 | 574 | 577 | 131.4 |
| D | 2 | 249 | 514196 | 3790.31 | 563 | 550 | 135.5 |
| D | 13 | 171 | 410960 | 3028.51 | 563 | 550 | 135.5 |
| D | 12 | 6 | 399690 | 2945.34 | 563 | 550 | 135.5 |
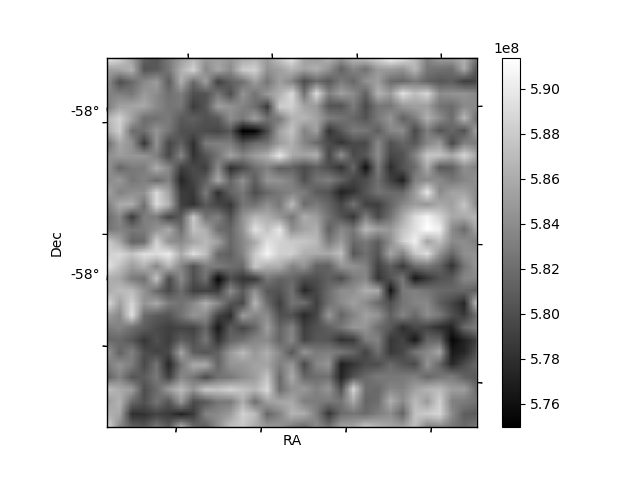
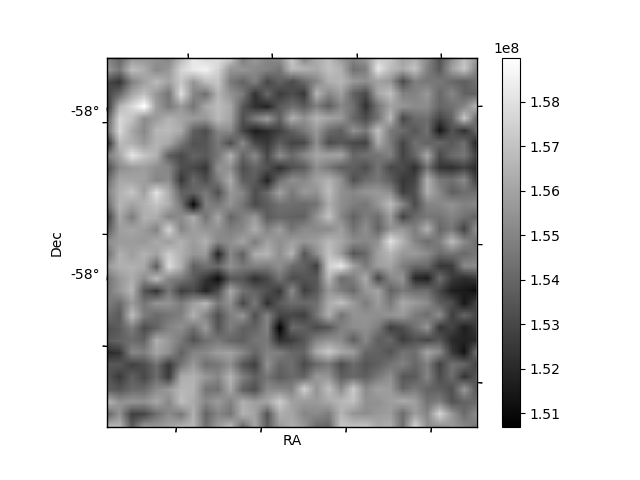
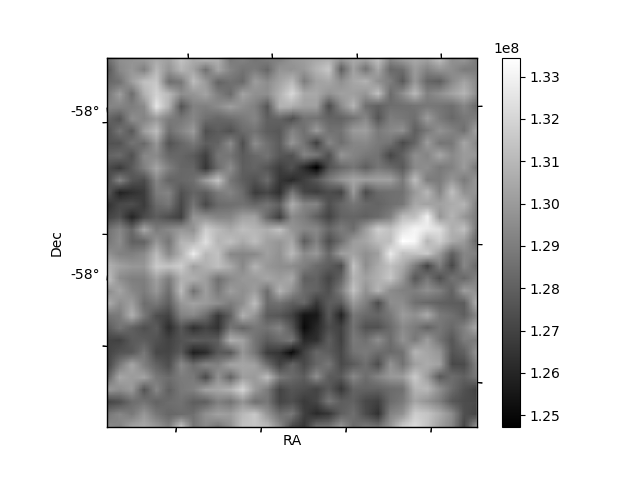
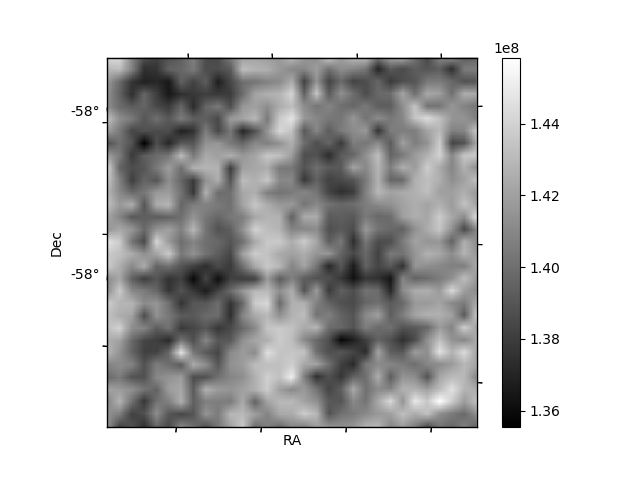
Histogram calculated using DETX and DETY for each event in the final _common_clean file
| Quadrant A | 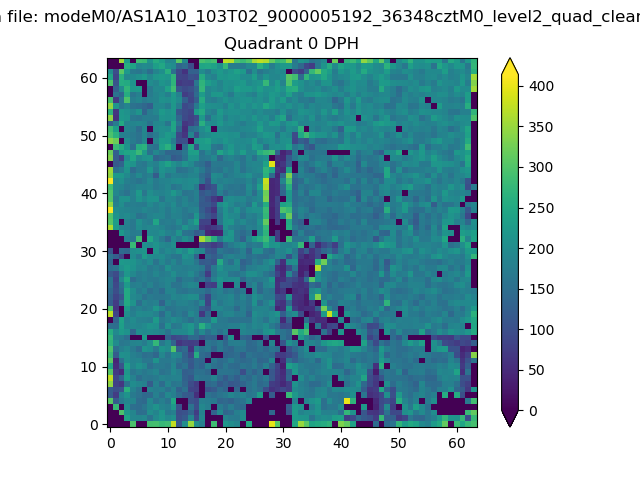 |
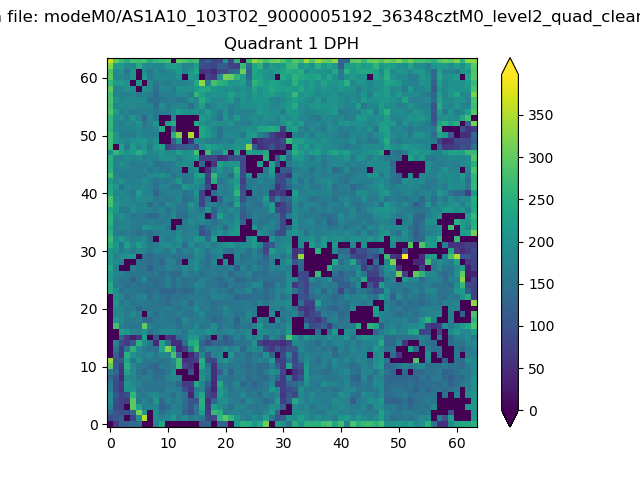 |
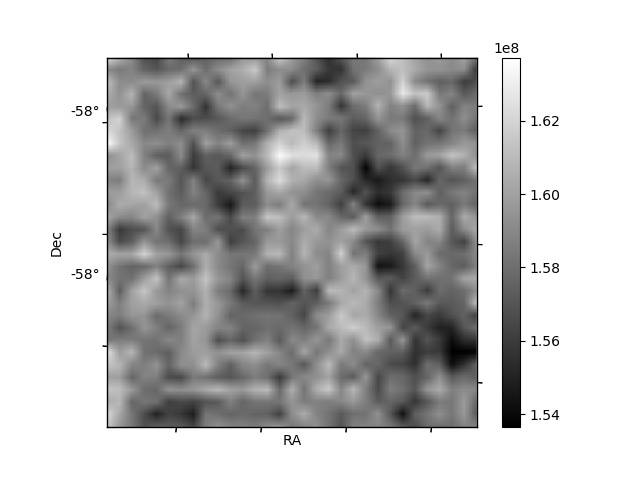
Quadrant B |
|---|---|---|---|
| Quadrant D | 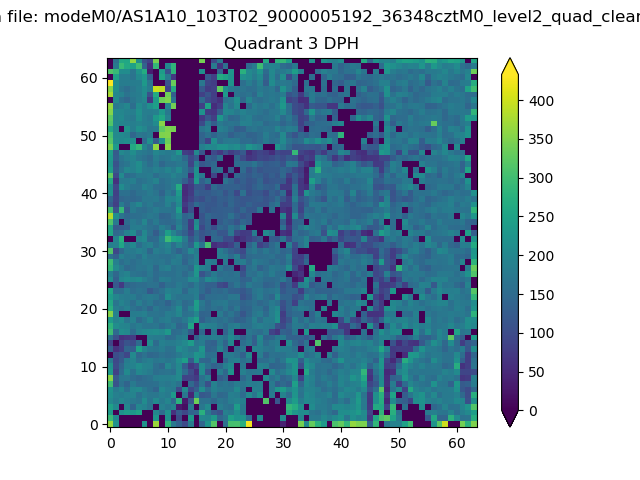 |
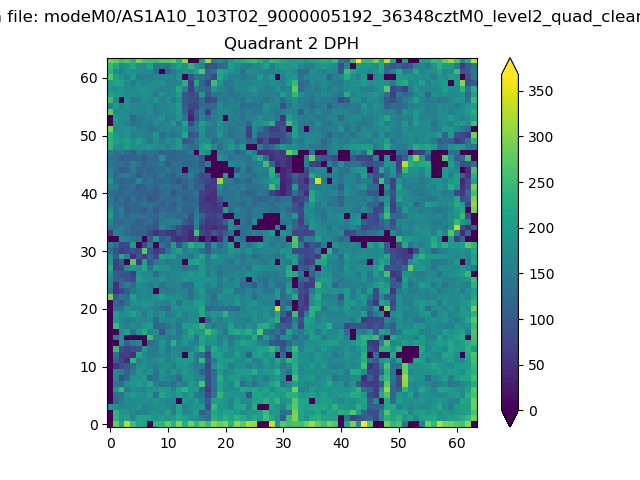 |
Quadrant C |
| Plot type | Count rate plots | Images |
|---|---|---|
| Comparison with Poisson distribution Blue bars denote a histogram of data divided into 1 sec bins. Red curve is a Poisson curve with rate = median count rate of data. |
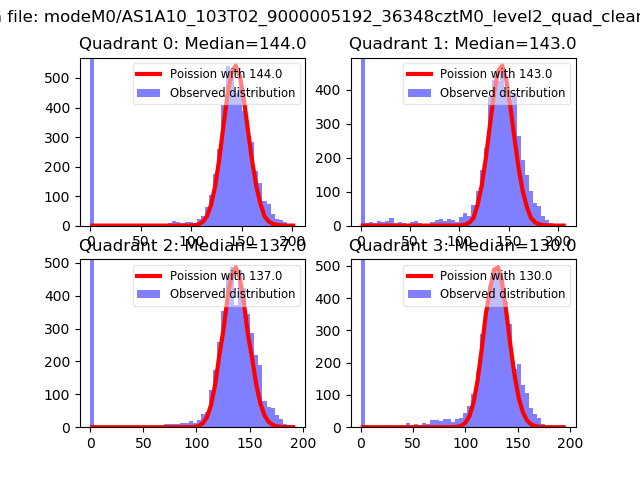 |
 |
| Quadrant-wise count rates Data is divided into 100 sec bins |
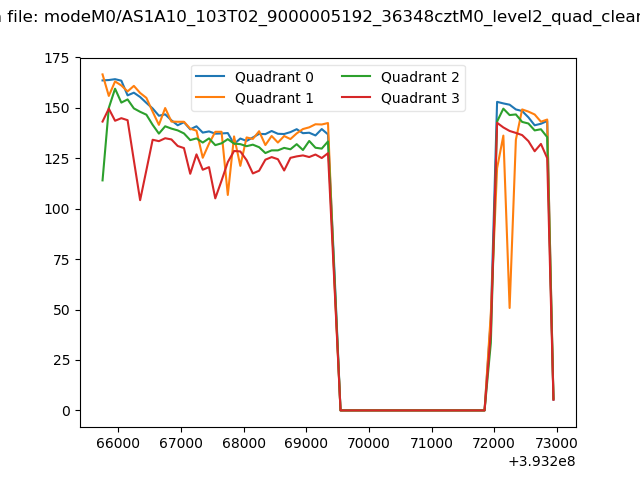 |
|
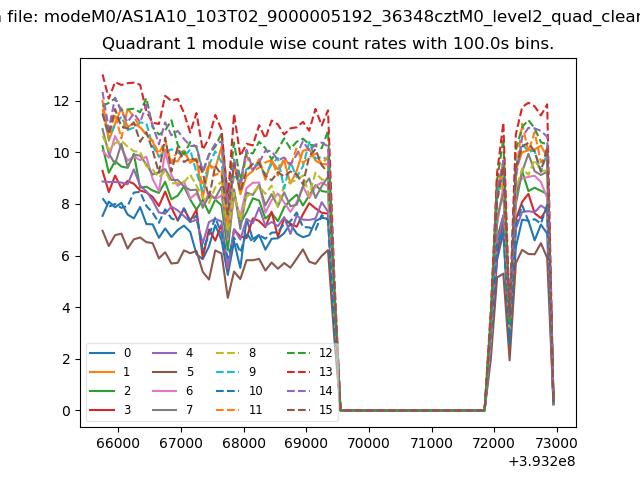
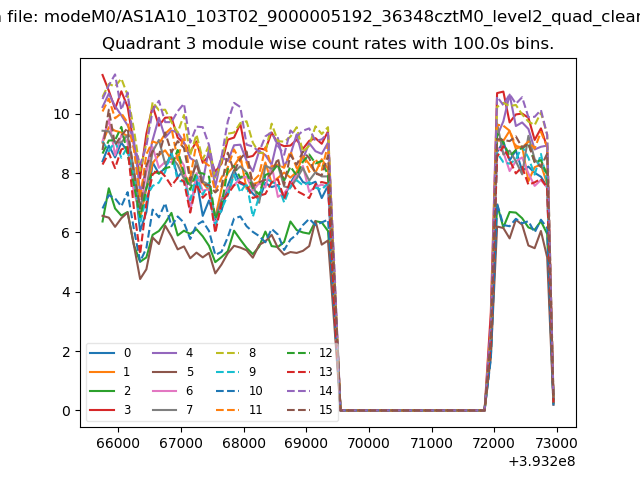
| Module-wise count rates for Quadrant A Data is divided into 100 sec bins |
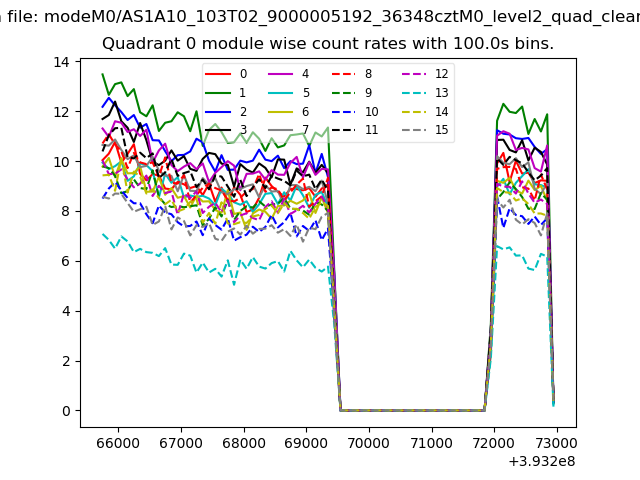 |
 |
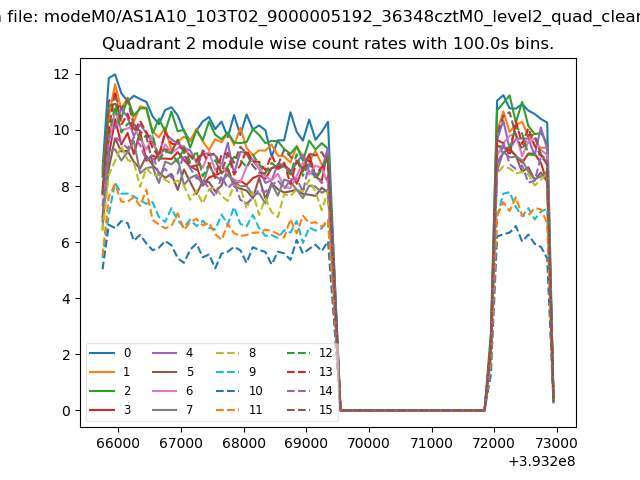
| Module-wise count rates for Quadrant B Data is divided into 100 sec bins |
 |
 |
| Module-wise count rates for Quadrant C Data is divided into 100 sec bins |
 |
 |
| Module-wise count rates for Quadrant D Data is divided into 100 sec bins |
 |
 |
| Parameter | Plot |
|---|---|
| CZT HV Monitor | 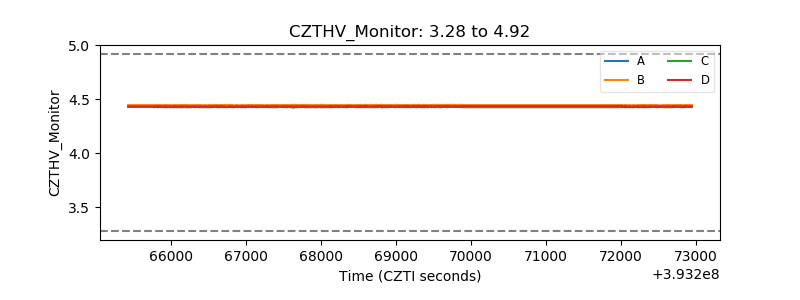 |
| D_VDD | 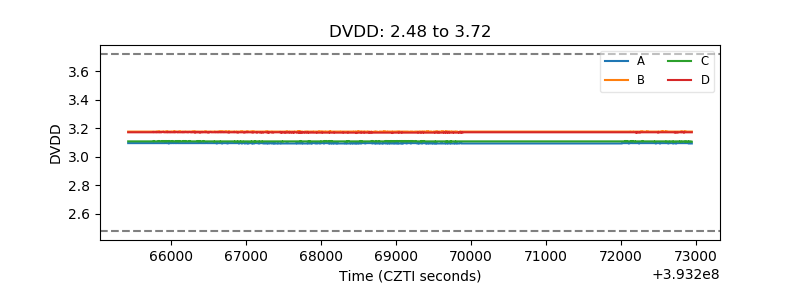 |
| Temperature 1 | 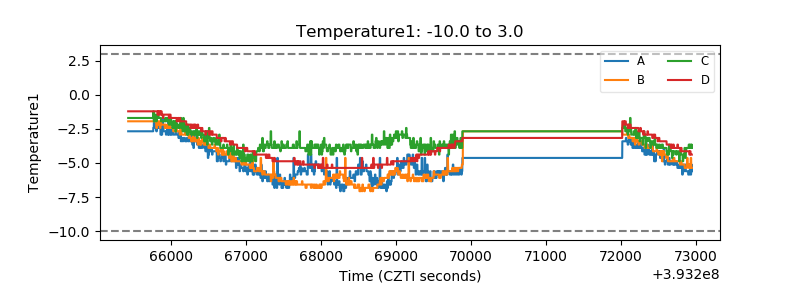 |
| Veto HV Monitor | 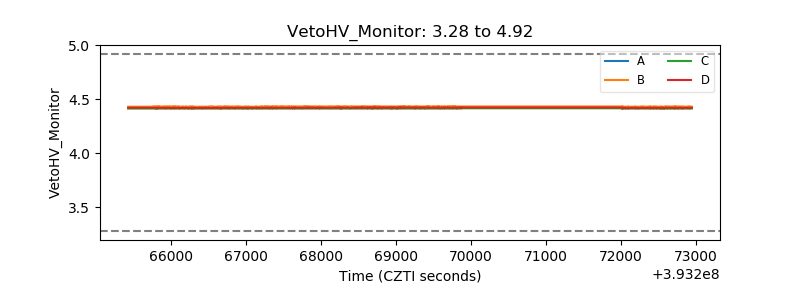 |
| Veto LLD | 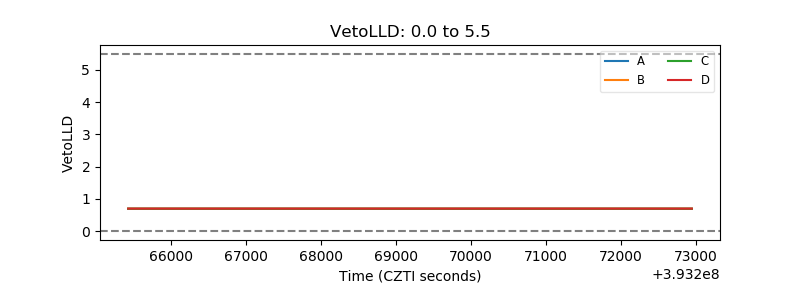 |
| Alpha Counter | 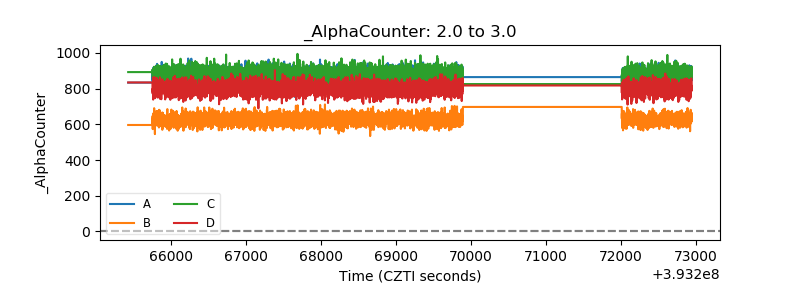 |
| _CPM_Rate | 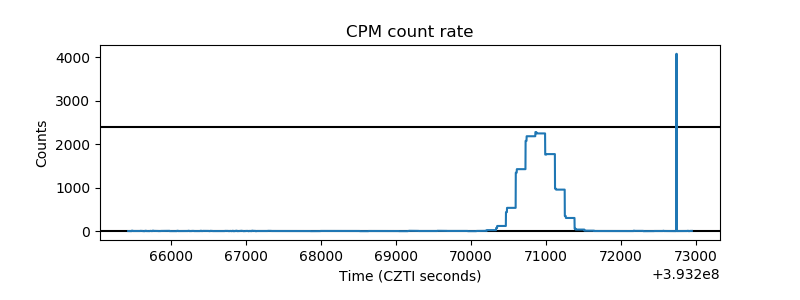 |
| CZT Counter | 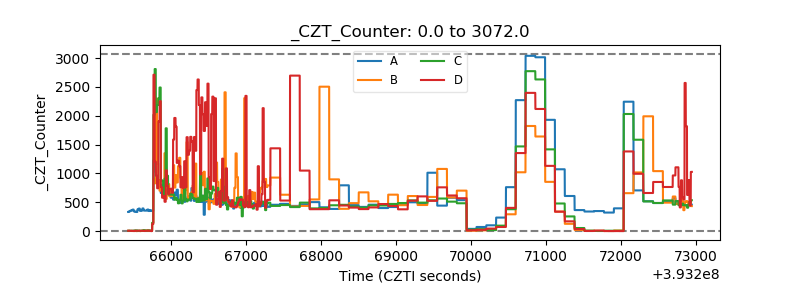 |
| +2.5 Volts monitor | 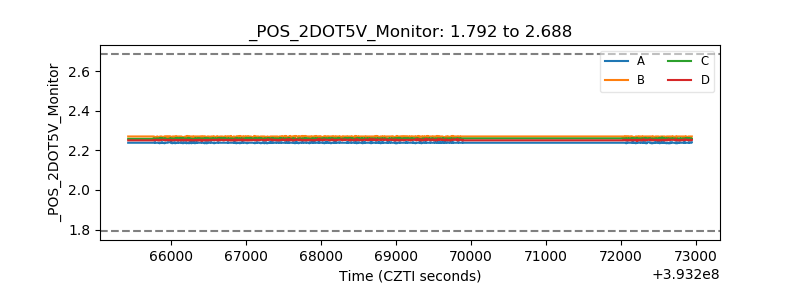 |
| +5 Volts monitor | 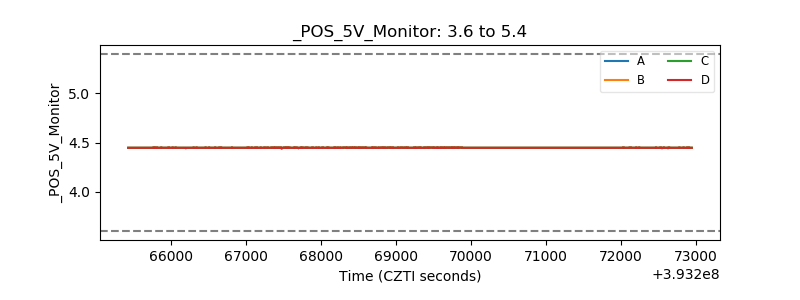 |
| _ROLL_ROT | 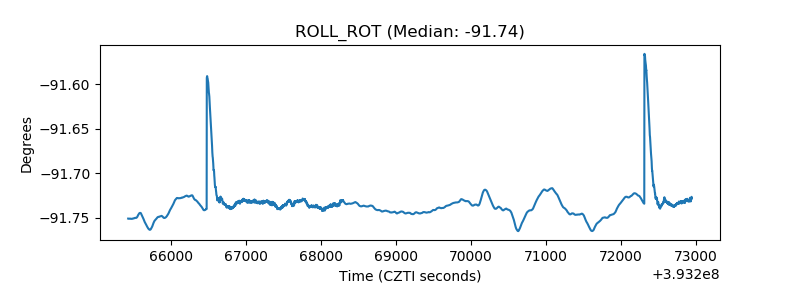 |
| _Roll_DEC | 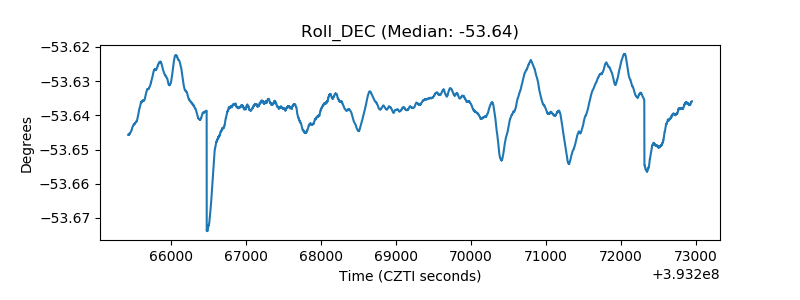 |
| _Roll_RA | 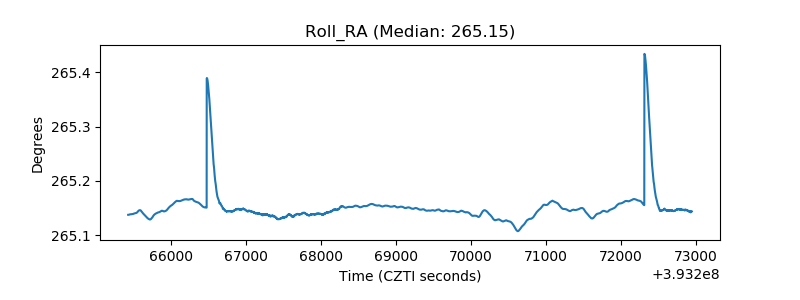 |
| Veto Counter | 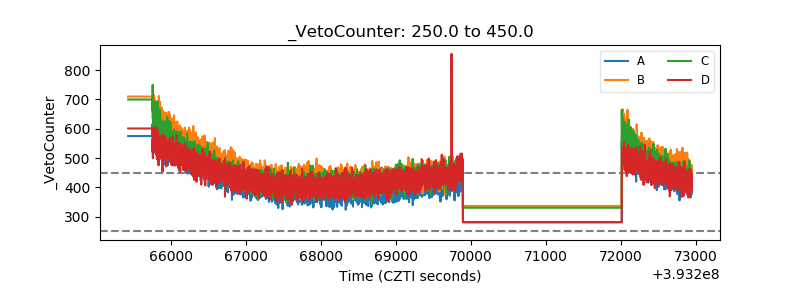 |