| Param | Original file | Final file |
|---|---|---|
| Filename | modeM0/AS1A10_103T02_9000005192_36347cztM0_level2.evt | modeM0/AS1A10_103T02_9000005192_36347cztM0_level2_quad_clean.evt |
| Size (bytes) | 444,214,080 | 109,468,800 |
| Size | 423.6 MB | 104.4 MB |
| Events in quadrant A | 2,769,281 | 763,334 |
| Events in quadrant B | 3,572,789 | 759,734 |
| Events in quadrant C | 3,225,667 | 727,253 |
| Events in quadrant D | 3,527,866 | 696,203 |
| Mode M9 | |||
|---|---|---|---|
| Quadrant | BADHDUFLAG | Total packets | Discarded packets |
| A | 0 | 33 | 0 |
| B | 0 | 33 | 0 |
| C | 0 | 33 | 0 |
| D | 0 | 34 | 0 |
| Mode SS | |||
|---|---|---|---|
| Quadrant | BADHDUFLAG | Total packets | Discarded packets |
| A | 0 | 106 | 0 |
| B | 0 | 106 | 0 |
| C | 0 | 106 | 0 |
| D | 0 | 106 | 0 |
| Mode M0 | |||
|---|---|---|---|
| Quadrant | BADHDUFLAG | Total packets | Discarded packets |
| A | 0 | 11522 | 3 |
| B | 0 | 14129 | 2 |
| C | 0 | 12815 | 2 |
| D | 0 | 14016 | 2 |
| Quadrant | Total seconds | Saturated seconds | Saturation percentage |
|---|---|---|---|
| A | 5270 | 16 | 0.303605% |
| B | 5270 | 163 | 3.092979% |
| C | 5270 | 140 | 2.656546% |
| D | 5270 | 230 | 4.364326% |
Noise dominated data is calculated using 1-second bins in cleaned event files. If a bin has >2000 counts, and if more than 50% of those come from <1% of pixels, then it is considered to be noise-dominated and hence unusable.
| Quadrant | # 1 sec bins | Bins with >0 counts | Bins with >2000 counts | High rate bins dominated by noise | Noise dominated (total time) | Noise dominated (detector-on time) | Marked lightcurve |
|---|---|---|---|---|---|---|---|
| A | 7303 | 5271 | 3 | 3 | 0.04% | 0.06% | 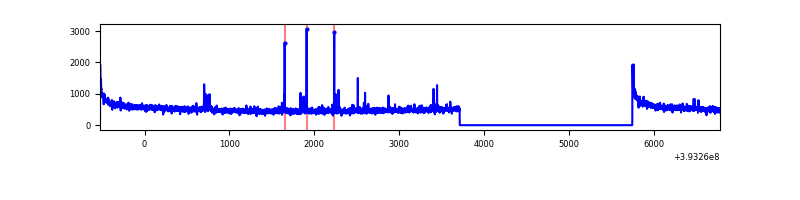 |
| B | 7303 | 5271 | 97 | 97 | 1.33% | 1.84% | 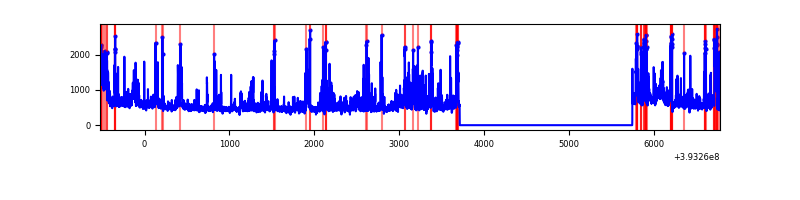 |
| C | 7303 | 5271 | 129 | 129 | 1.77% | 2.45% | 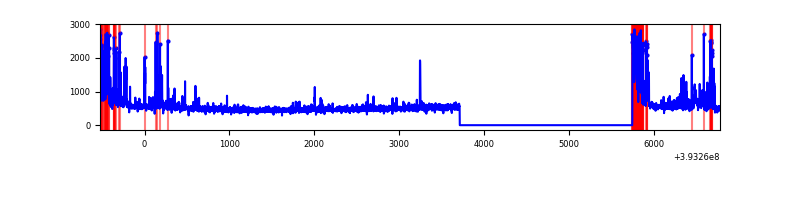 |
| D | 7303 | 5271 | 230 | 230 | 3.15% | 4.36% | 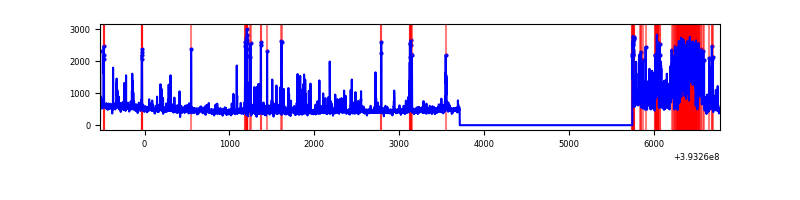 |
Top three noisy pixels from each quadrant. If the there are fewer than three noisy pixels in the level2.evt file, extra rows are filled as -1
| Pixel properties | Quadrant properties | ||||||
|---|---|---|---|---|---|---|---|
| Quadrant | DetID | PixID | Counts | Sigma | Mean | Median | Sigma |
| A | 10 | 83 | 193575 | 1499.66 | 647 | 637 | 128.7 |
| A | 9 | 143 | 38807 | 296.69 | 647 | 637 | 128.7 |
| A | 7 | 3 | 23083 | 174.47 | 647 | 637 | 128.7 |
| B | 5 | 172 | 385975 | 3230.63 | 636 | 621 | 119.3 |
| B | 5 | 236 | 329895 | 2760.48 | 636 | 621 | 119.3 |
| B | 0 | 213 | 96814 | 806.44 | 636 | 621 | 119.3 |
| C | 0 | 10 | 356254 | 2543.24 | 607 | 612 | 139.8 |
| C | 0 | 207 | 247869 | 1768.17 | 607 | 612 | 139.8 |
| C | 15 | 214 | 224486 | 1600.95 | 607 | 612 | 139.8 |
| D | 2 | 249 | 522466 | 3605.03 | 606 | 591 | 144.8 |
| D | 13 | 171 | 233955 | 1612.04 | 606 | 591 | 144.8 |
| D | 12 | 6 | 93823 | 644.03 | 606 | 591 | 144.8 |
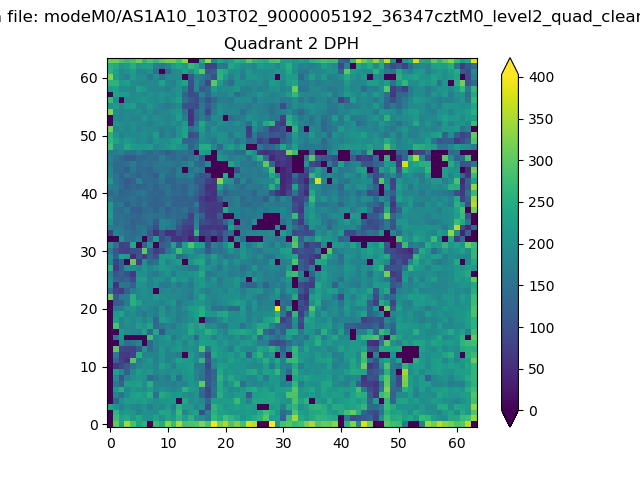
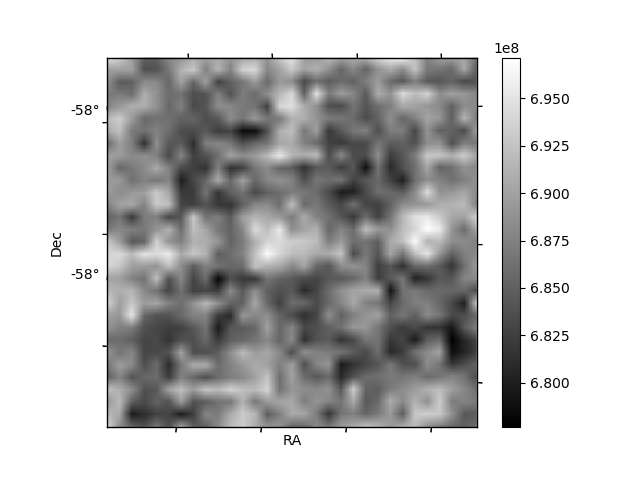
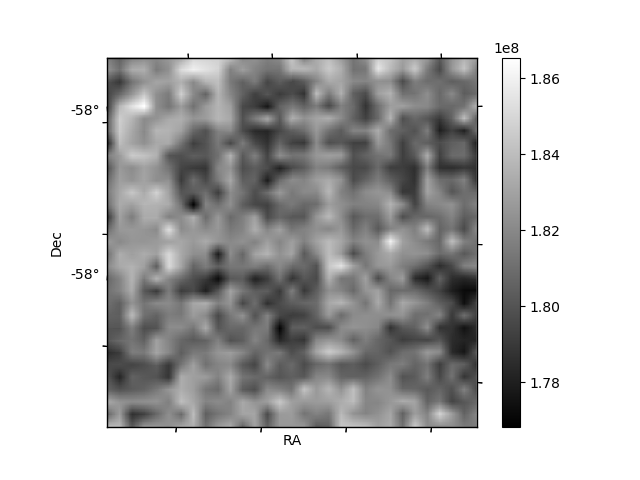
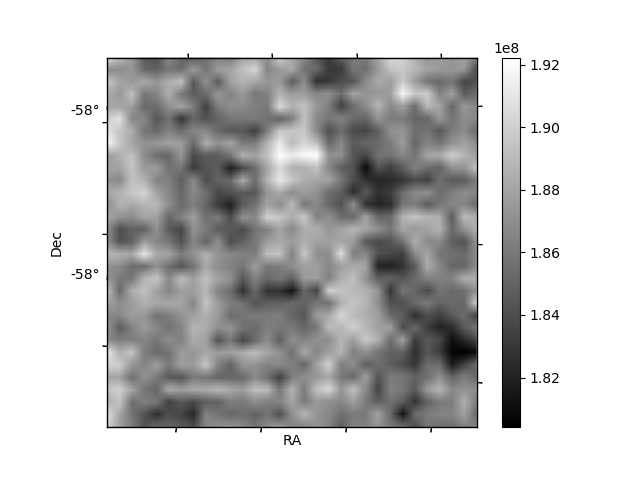
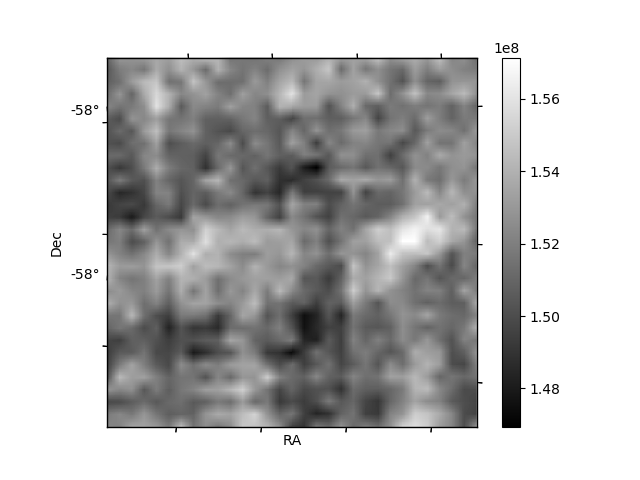
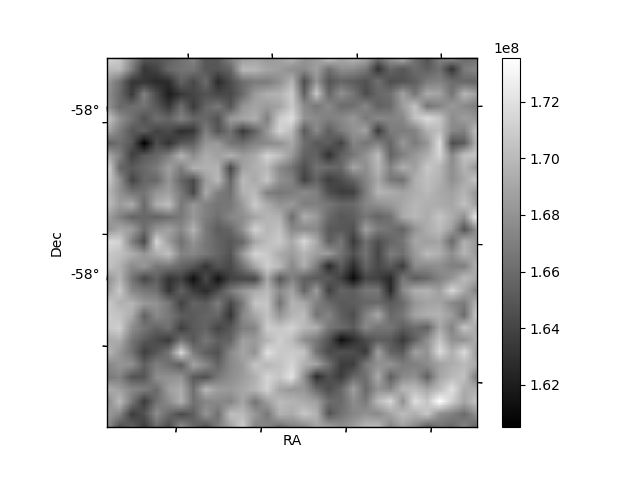
Histogram calculated using DETX and DETY for each event in the final _common_clean file
| Quadrant A | 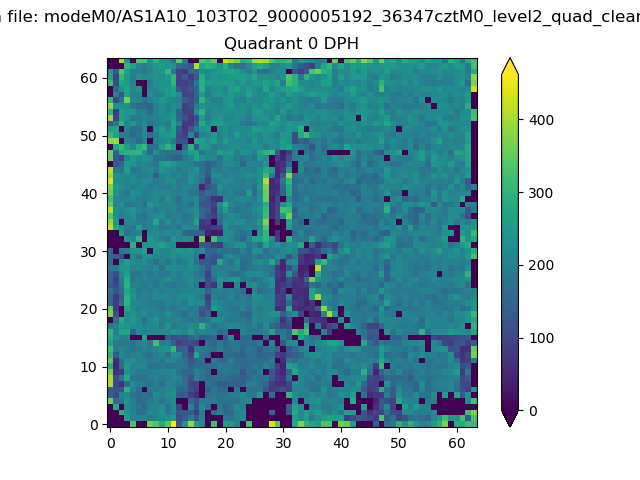 |
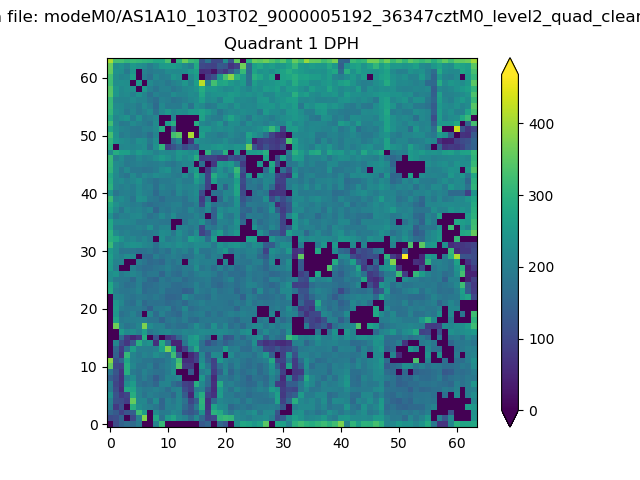 |
Quadrant B |
|---|---|---|---|
| Quadrant D | 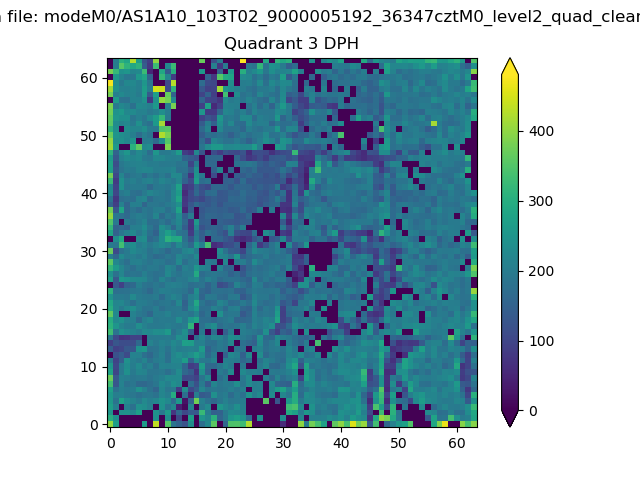 |
 |
Quadrant C |
| Plot type | Count rate plots | Images |
|---|---|---|
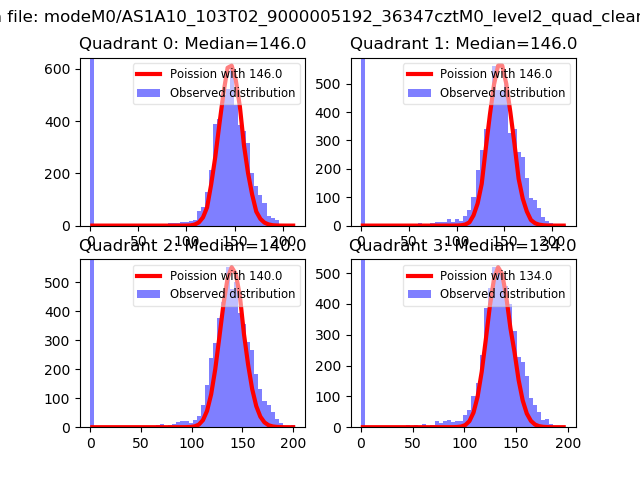
| Comparison with Poisson distribution Blue bars denote a histogram of data divided into 1 sec bins. Red curve is a Poisson curve with rate = median count rate of data. |
 |
 |
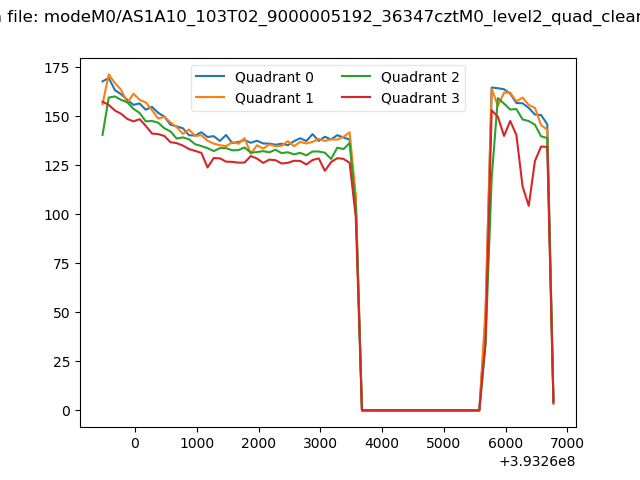
| Quadrant-wise count rates Data is divided into 100 sec bins |
 |
|
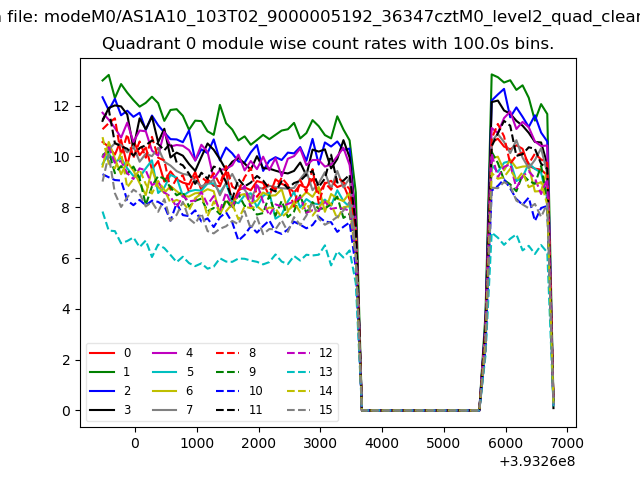
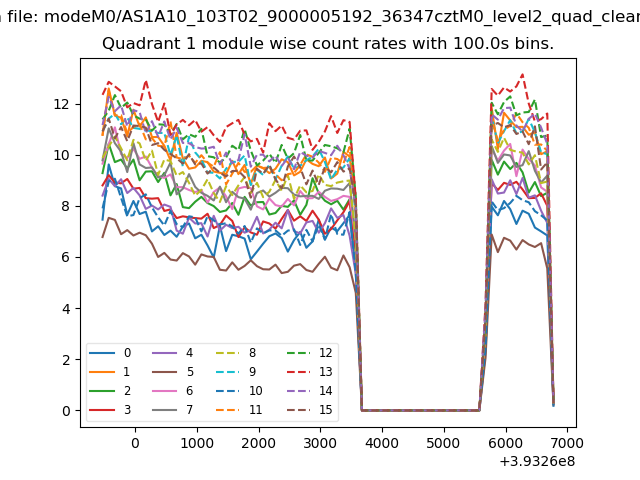
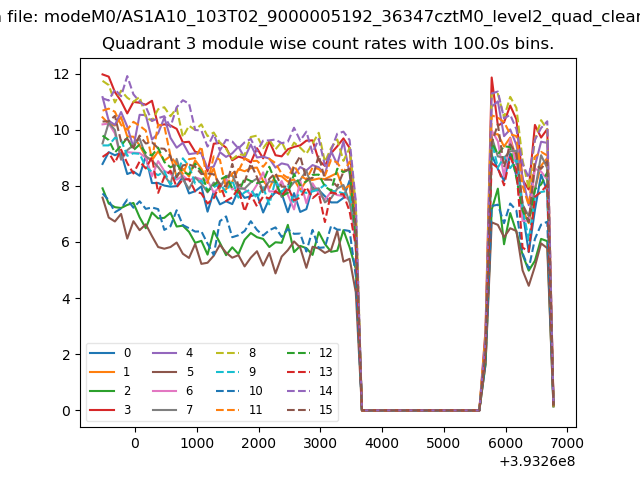
| Module-wise count rates for Quadrant A Data is divided into 100 sec bins |
 |
 |
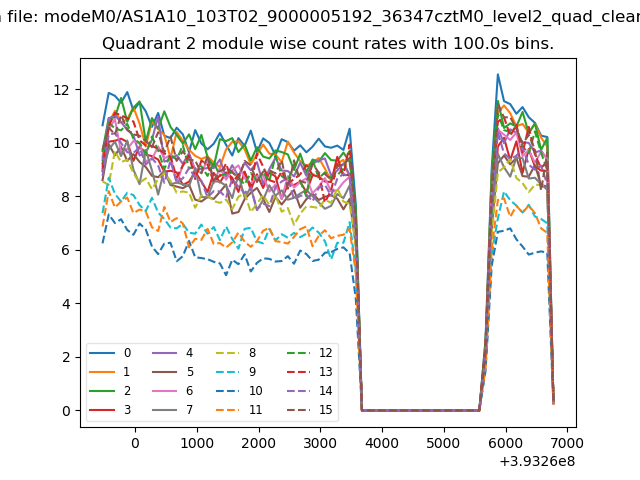
| Module-wise count rates for Quadrant B Data is divided into 100 sec bins |
 |
 |
| Module-wise count rates for Quadrant C Data is divided into 100 sec bins |
 |
 |
| Module-wise count rates for Quadrant D Data is divided into 100 sec bins |
 |
 |
| Parameter | Plot |
|---|---|
| CZT HV Monitor | 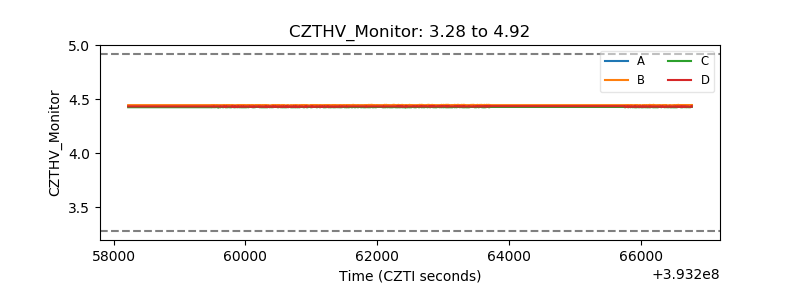 |
| D_VDD | 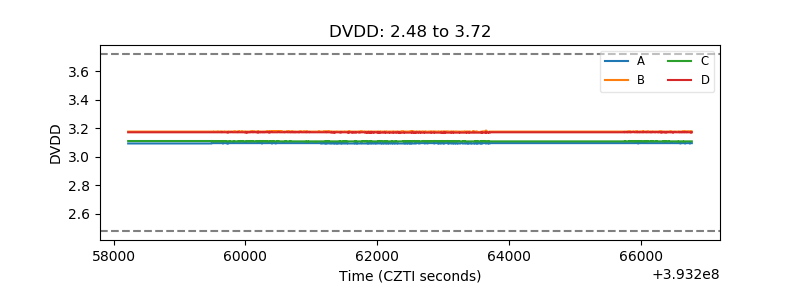 |
| Temperature 1 | 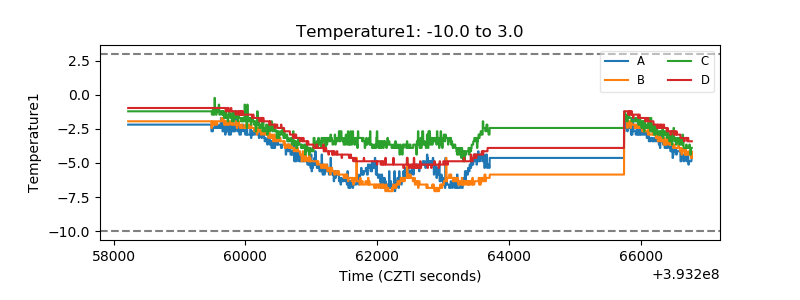 |
| Veto HV Monitor | 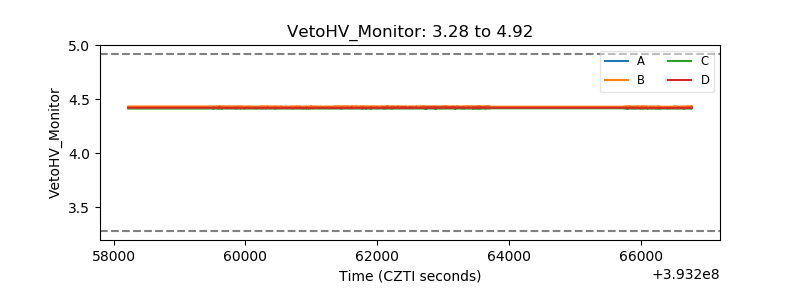 |
| Veto LLD | 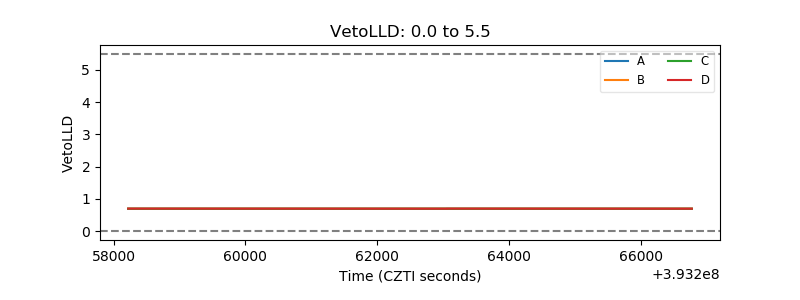 |
| Alpha Counter | 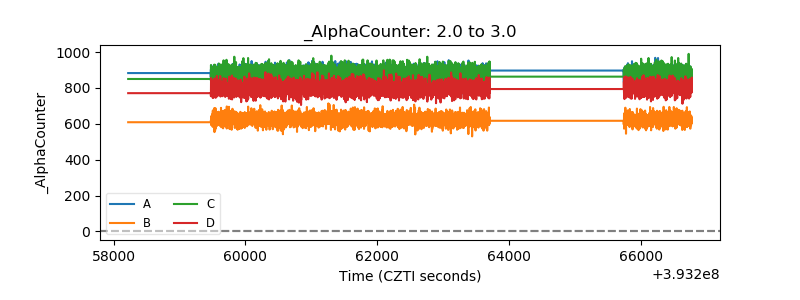 |
| _CPM_Rate | 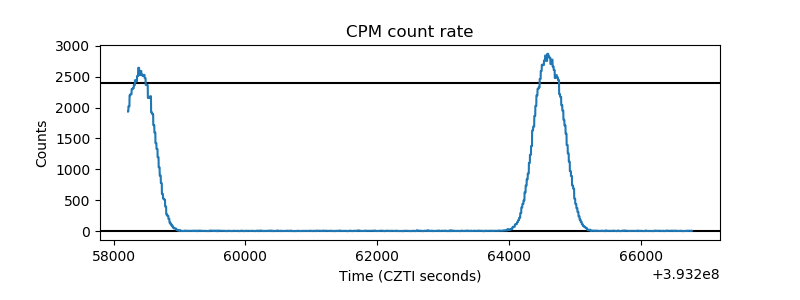 |
| CZT Counter | 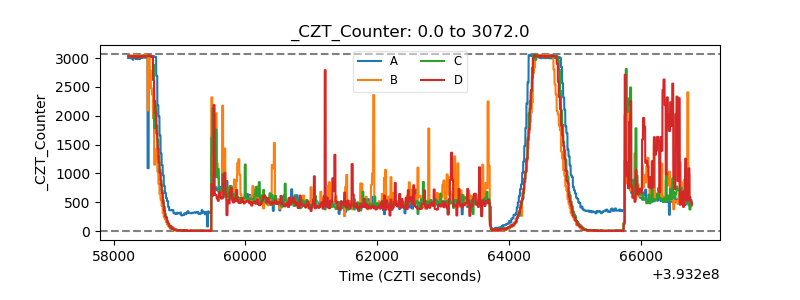 |
| +2.5 Volts monitor | 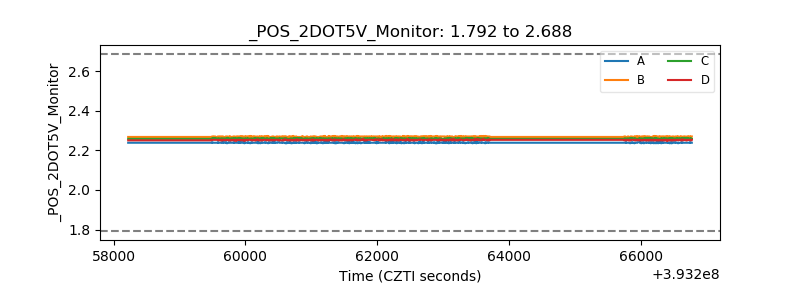 |
| +5 Volts monitor | 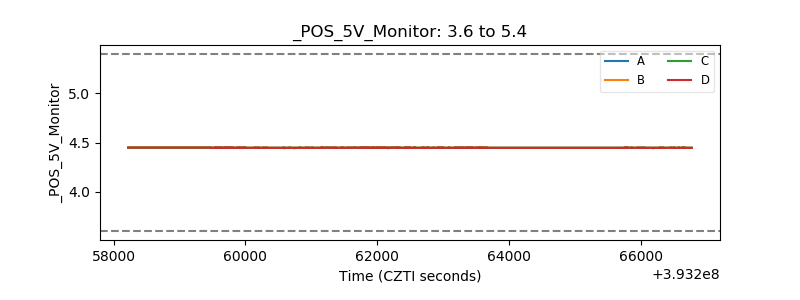 |
| _ROLL_ROT | 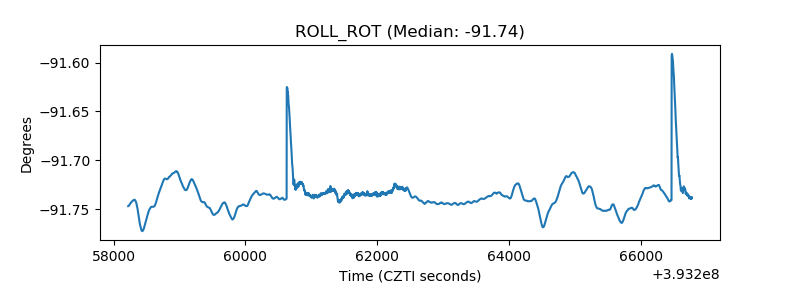 |
| _Roll_DEC | 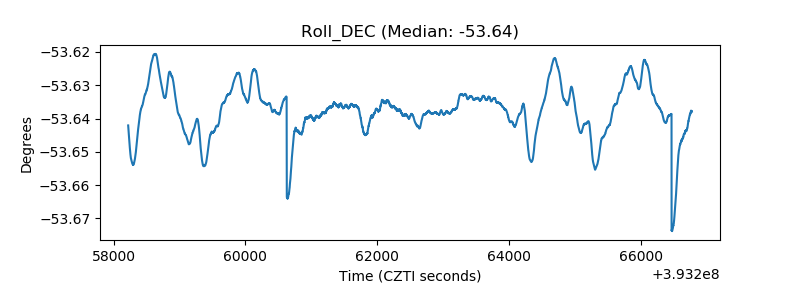 |
| _Roll_RA | 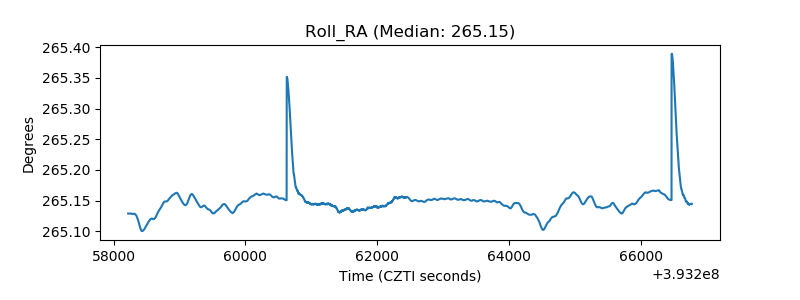 |
| Veto Counter | 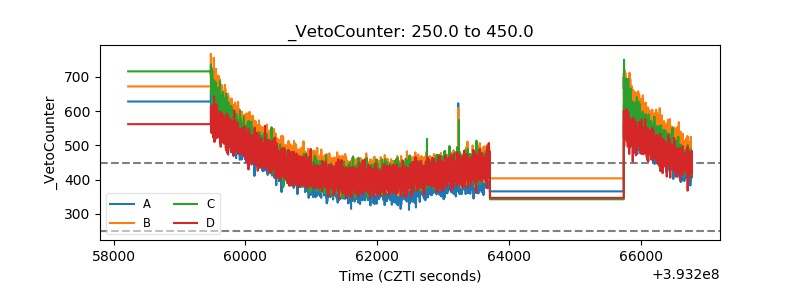 |