| Param | Original file | Final file |
|---|---|---|
| Filename | modeM0/AS1A10_103T02_9000005192_36346cztM0_level2.evt | modeM0/AS1A10_103T02_9000005192_36346cztM0_level2_quad_clean.evt |
| Size (bytes) | 596,931,840 | 100,647,360 |
| Size | 569.3 MB | 96.0 MB |
| Events in quadrant A | 2,847,799 | 723,701 |
| Events in quadrant B | 7,209,975 | 592,210 |
| Events in quadrant C | 3,332,989 | 699,667 |
| Events in quadrant D | 4,316,755 | 648,648 |
| Mode M9 | |||
|---|---|---|---|
| Quadrant | BADHDUFLAG | Total packets | Discarded packets |
| A | 0 | 29 | 0 |
| B | 0 | 29 | 0 |
| C | 0 | 29 | 0 |
| D | 0 | 30 | 0 |
| Mode SS | |||
|---|---|---|---|
| Quadrant | BADHDUFLAG | Total packets | Discarded packets |
| A | 0 | 112 | 0 |
| B | 0 | 112 | 0 |
| C | 0 | 112 | 0 |
| D | 0 | 112 | 0 |
| Mode M0 | |||
|---|---|---|---|
| Quadrant | BADHDUFLAG | Total packets | Discarded packets |
| A | 0 | 11961 | 3 |
| B | 0 | 25086 | 2 |
| C | 0 | 13219 | 2 |
| D | 0 | 16451 | 2 |
| Quadrant | Total seconds | Saturated seconds | Saturation percentage |
|---|---|---|---|
| A | 5471 | 24 | 0.438677% |
| B | 5471 | 1769 | 32.334125% |
| C | 5471 | 92 | 1.681594% |
| D | 5471 | 454 | 8.298300% |
Noise dominated data is calculated using 1-second bins in cleaned event files. If a bin has >2000 counts, and if more than 50% of those come from <1% of pixels, then it is considered to be noise-dominated and hence unusable.
| Quadrant | # 1 sec bins | Bins with >0 counts | Bins with >2000 counts | High rate bins dominated by noise | Noise dominated (total time) | Noise dominated (detector-on time) | Marked lightcurve |
|---|---|---|---|---|---|---|---|
| A | 7384 | 5472 | 8 | 8 | 0.11% | 0.15% | 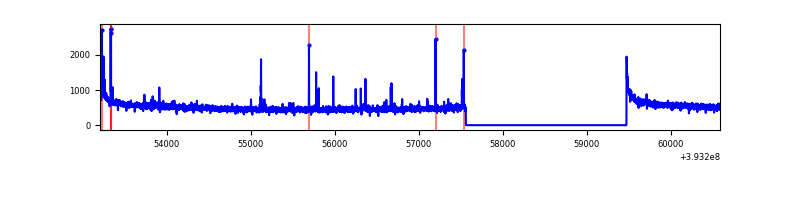 |
| B | 7384 | 5472 | 1589 | 1589 | 21.52% | 29.04% | 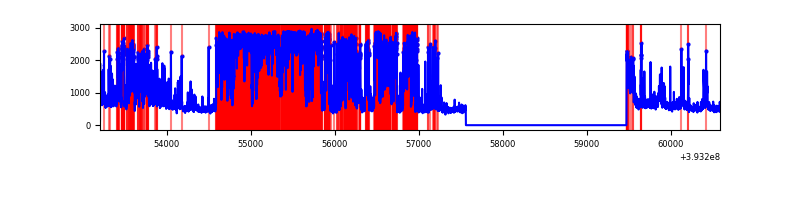 |
| C | 7384 | 5472 | 85 | 85 | 1.15% | 1.55% | 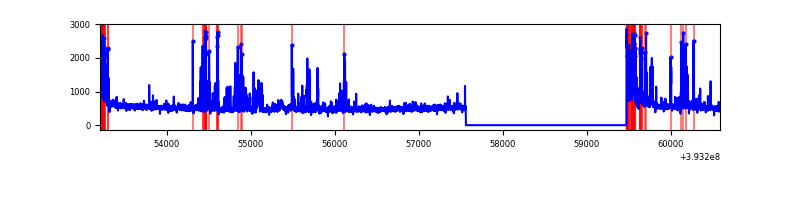 |
| D | 7384 | 5471 | 478 | 478 | 6.47% | 8.74% | 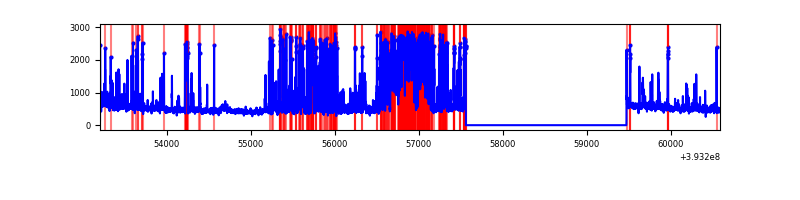 |
Top three noisy pixels from each quadrant. If the there are fewer than three noisy pixels in the level2.evt file, extra rows are filled as -1
| Pixel properties | Quadrant properties | ||||||
|---|---|---|---|---|---|---|---|
| Quadrant | DetID | PixID | Counts | Sigma | Mean | Median | Sigma |
| A | 10 | 83 | 194079 | 1463.37 | 662 | 652 | 132.2 |
| A | 9 | 143 | 38137 | 283.59 | 662 | 652 | 132.2 |
| A | 7 | 16 | 21369 | 156.73 | 662 | 652 | 132.2 |
| B | 4 | 171 | 3818418 | 36213.95 | 561 | 548 | 105.4 |
| B | 5 | 172 | 681863 | 6462.53 | 561 | 548 | 105.4 |
| B | 5 | 236 | 203395 | 1924.08 | 561 | 548 | 105.4 |
| C | 0 | 207 | 371227 | 2592.27 | 628 | 634 | 143.0 |
| C | 0 | 10 | 279336 | 1949.5 | 628 | 634 | 143.0 |
| C | 15 | 214 | 231903 | 1617.71 | 628 | 634 | 143.0 |
| D | 12 | 6 | 1328792 | 8971.54 | 614 | 598 | 148.0 |
| D | 13 | 249 | 118625 | 797.24 | 614 | 598 | 148.0 |
| D | 15 | 0 | 115326 | 774.95 | 614 | 598 | 148.0 |
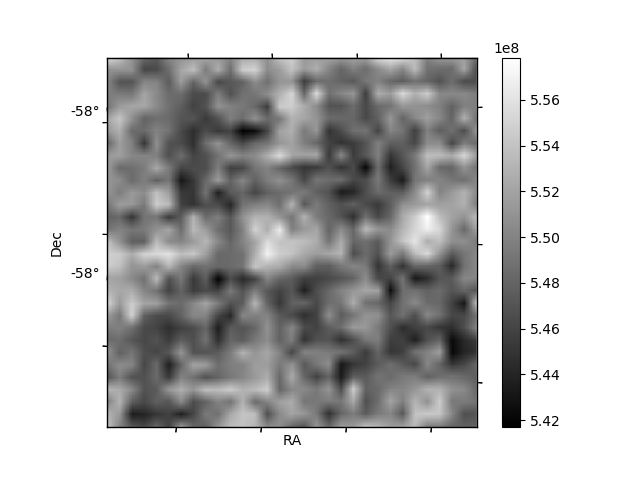
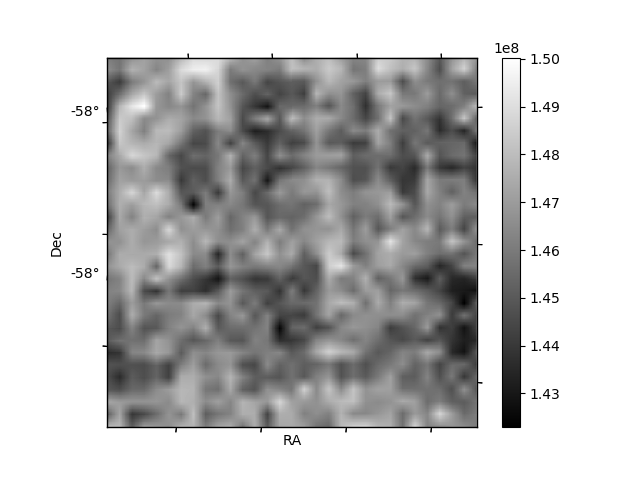
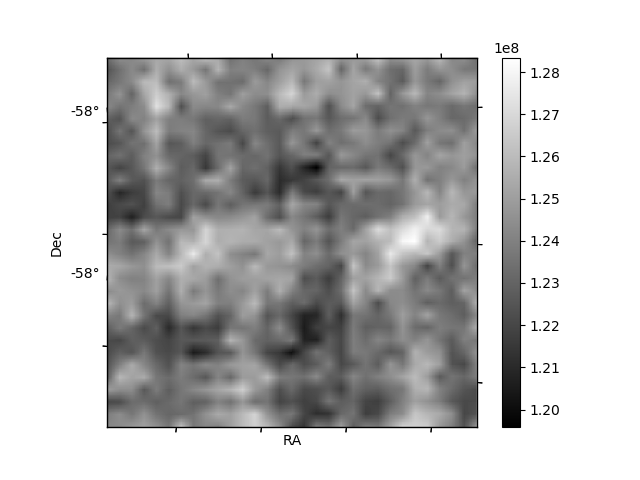
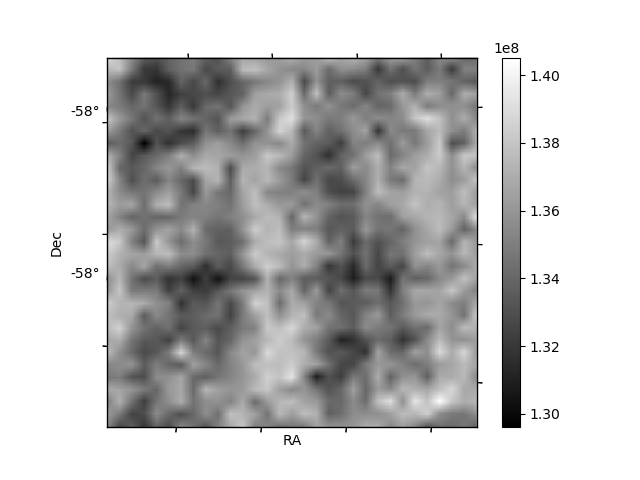
Histogram calculated using DETX and DETY for each event in the final _common_clean file
| Quadrant A | 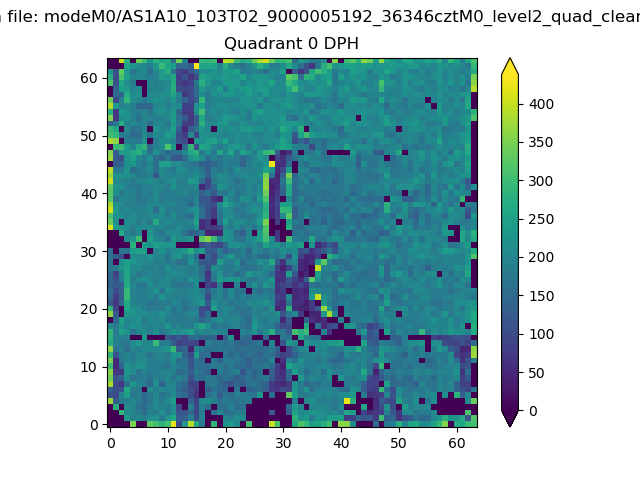 |
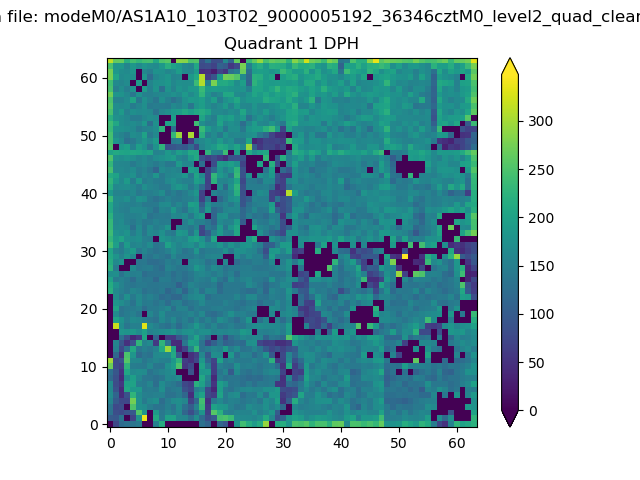 |
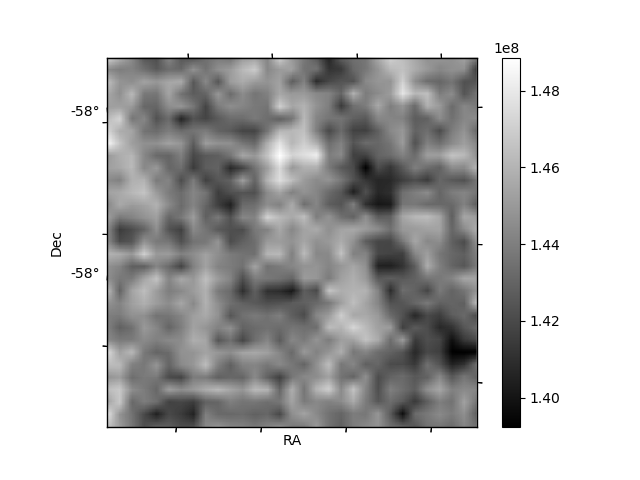
Quadrant B |
|---|---|---|---|
| Quadrant D | 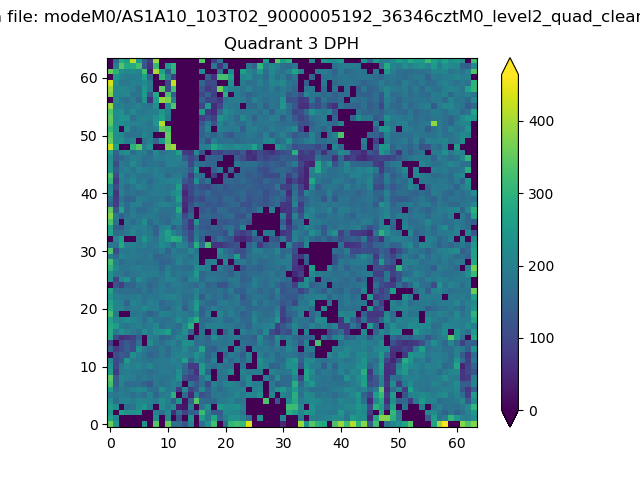 |
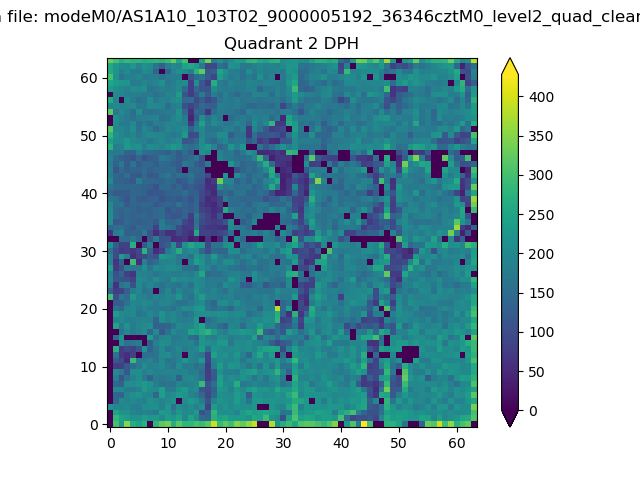 |
Quadrant C |
| Plot type | Count rate plots | Images |
|---|---|---|
| Comparison with Poisson distribution Blue bars denote a histogram of data divided into 1 sec bins. Red curve is a Poisson curve with rate = median count rate of data. |
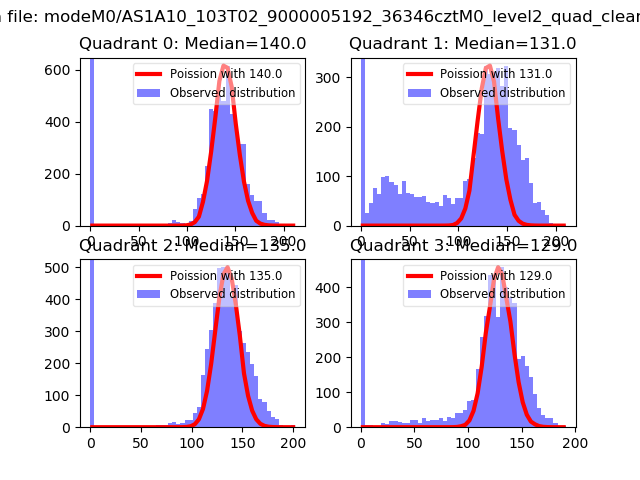 |
 |
| Quadrant-wise count rates Data is divided into 100 sec bins |
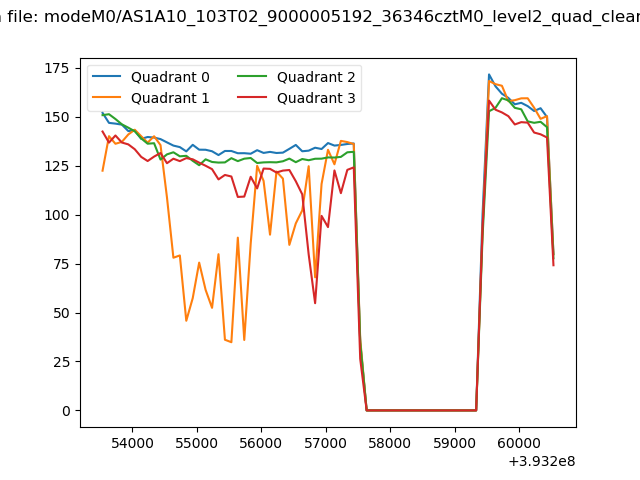 |
|
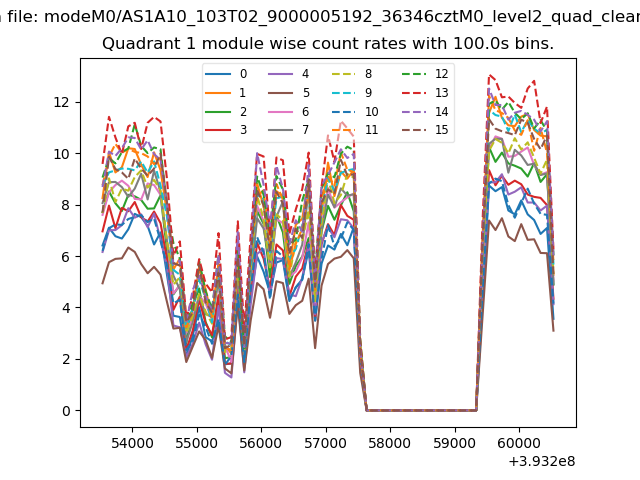
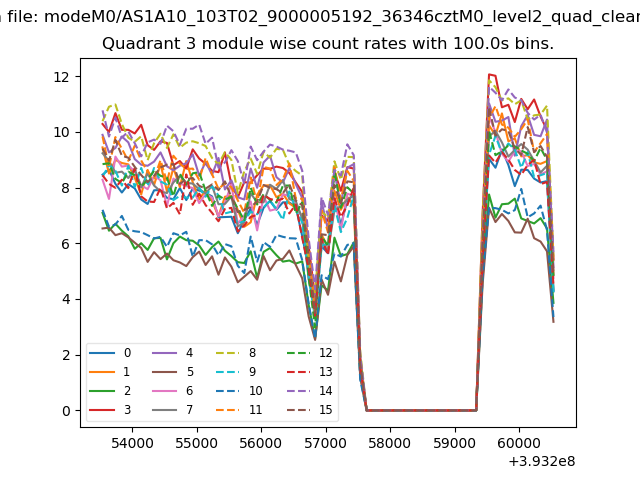
| Module-wise count rates for Quadrant A Data is divided into 100 sec bins |
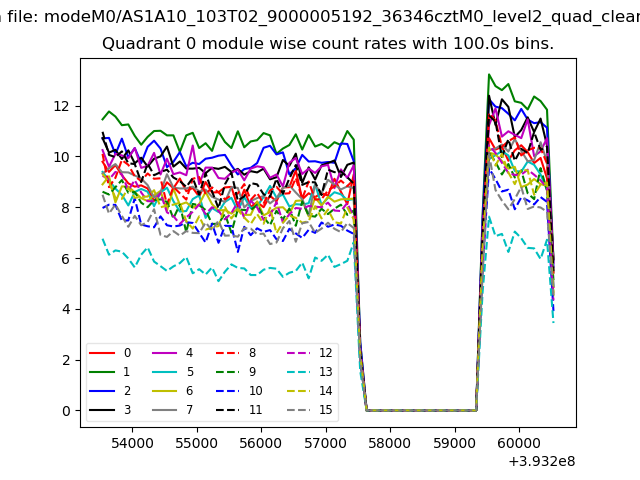 |
 |
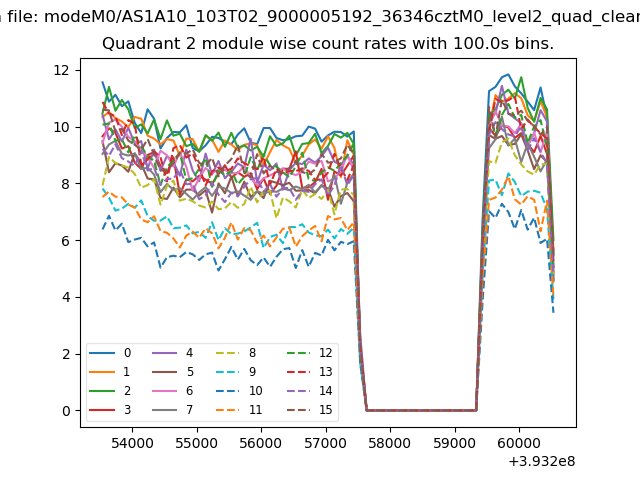
| Module-wise count rates for Quadrant B Data is divided into 100 sec bins |
 |
 |
| Module-wise count rates for Quadrant C Data is divided into 100 sec bins |
 |
 |
| Module-wise count rates for Quadrant D Data is divided into 100 sec bins |
 |
 |
| Parameter | Plot |
|---|---|
| CZT HV Monitor |  |
| D_VDD | 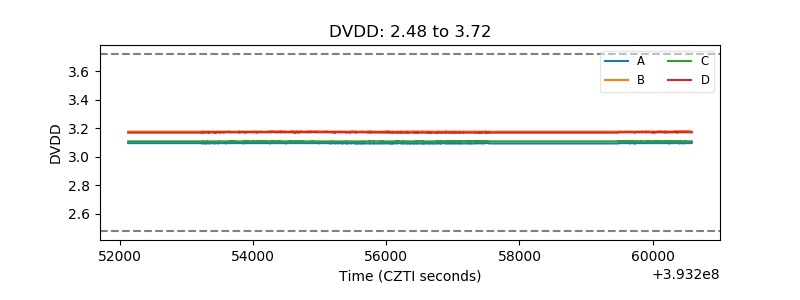 |
| Temperature 1 | 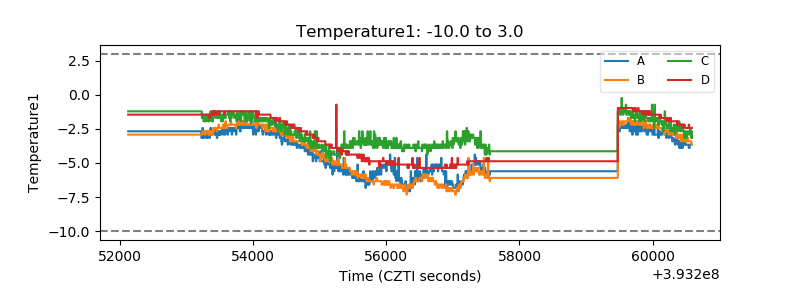 |
| Veto HV Monitor | 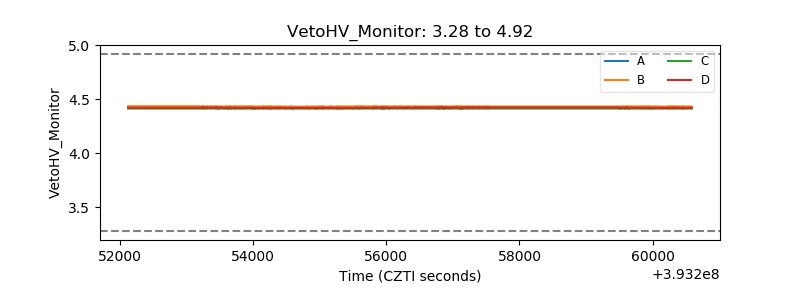 |
| Veto LLD | 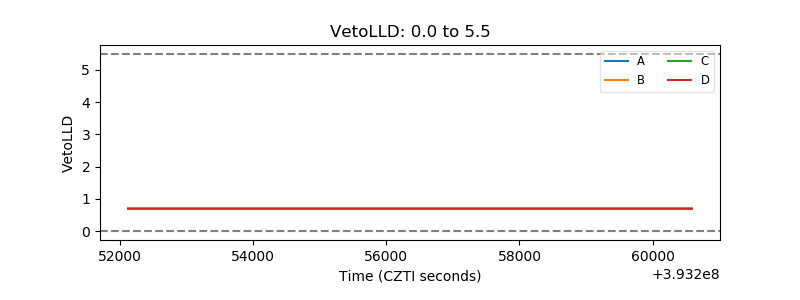 |
| Alpha Counter | 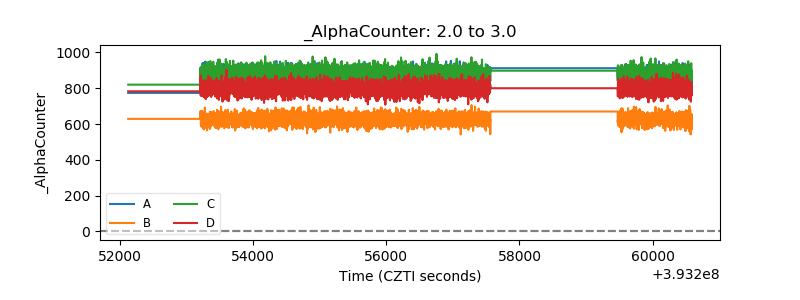 |
| _CPM_Rate | 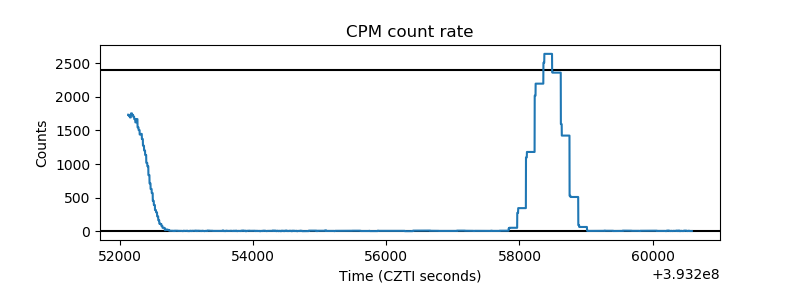 |
| CZT Counter | 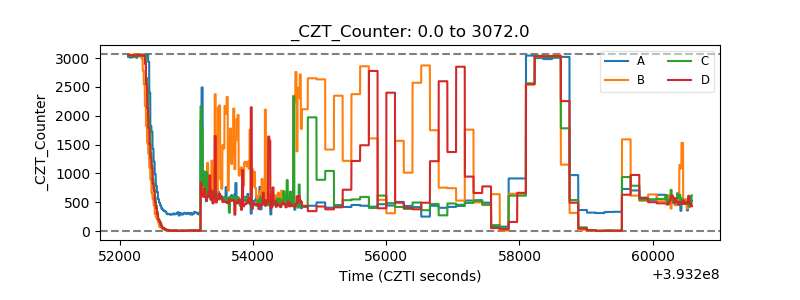 |
| +2.5 Volts monitor | 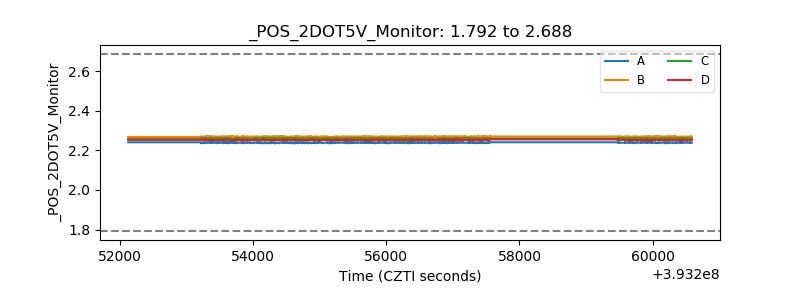 |
| +5 Volts monitor | 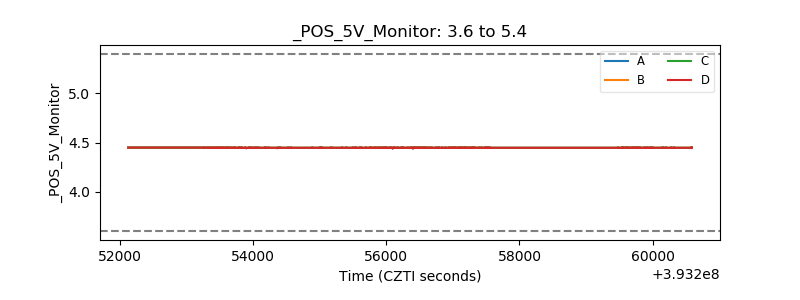 |
| _ROLL_ROT | 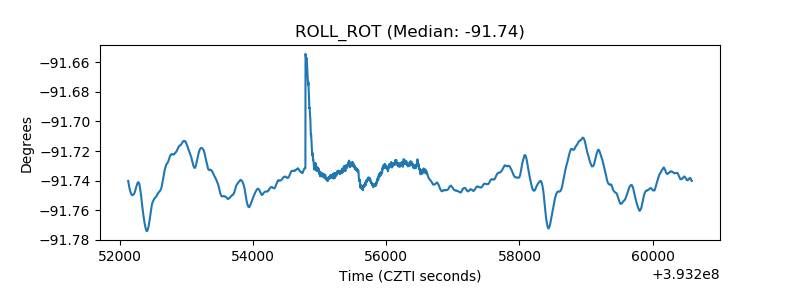 |
| _Roll_DEC | 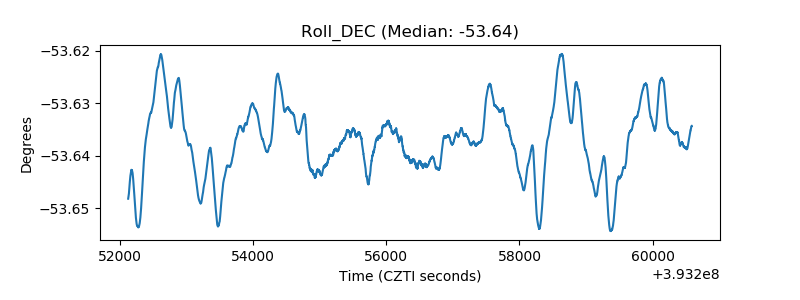 |
| _Roll_RA | 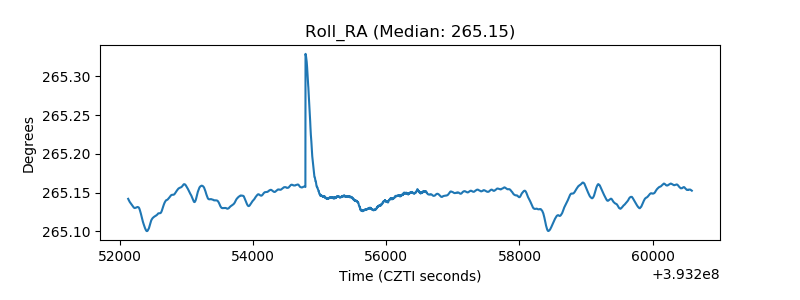 |
| Veto Counter | 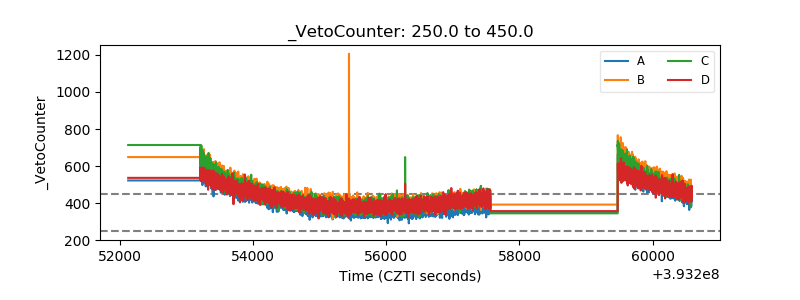 |