| Param | Original file | Final file |
|---|---|---|
| Filename | modeM0/AS1A10_103T02_9000005192_36345cztM0_level2.evt | modeM0/AS1A10_103T02_9000005192_36345cztM0_level2_quad_clean.evt |
| Size (bytes) | 456,779,520 | 89,835,840 |
| Size | 435.6 MB | 85.7 MB |
| Events in quadrant A | 2,887,999 | 593,622 |
| Events in quadrant B | 4,130,307 | 583,678 |
| Events in quadrant C | 2,967,128 | 587,912 |
| Events in quadrant D | 3,462,809 | 558,562 |
| Mode M9 | |||
|---|---|---|---|
| Quadrant | BADHDUFLAG | Total packets | Discarded packets |
| A | 0 | 29 | 0 |
| B | 0 | 29 | 0 |
| C | 0 | 29 | 0 |
| D | 0 | 30 | 0 |
| Mode SS | |||
|---|---|---|---|
| Quadrant | BADHDUFLAG | Total packets | Discarded packets |
| A | 0 | 114 | 0 |
| B | 0 | 114 | 0 |
| C | 0 | 114 | 0 |
| D | 0 | 114 | 0 |
| Mode M0 | |||
|---|---|---|---|
| Quadrant | BADHDUFLAG | Total packets | Discarded packets |
| A | 0 | 12267 | 3 |
| B | 0 | 16122 | 2 |
| C | 0 | 12360 | 2 |
| D | 0 | 14146 | 2 |
| Quadrant | Total seconds | Saturated seconds | Saturation percentage |
|---|---|---|---|
| A | 5677 | 36 | 0.634138% |
| B | 5677 | 330 | 5.812929% |
| C | 5677 | 59 | 1.039281% |
| D | 5677 | 177 | 3.117844% |
Noise dominated data is calculated using 1-second bins in cleaned event files. If a bin has >2000 counts, and if more than 50% of those come from <1% of pixels, then it is considered to be noise-dominated and hence unusable.
| Quadrant | # 1 sec bins | Bins with >0 counts | Bins with >2000 counts | High rate bins dominated by noise | Noise dominated (total time) | Noise dominated (detector-on time) | Marked lightcurve |
|---|---|---|---|---|---|---|---|
| A | 7470 | 5678 | 12 | 12 | 0.16% | 0.21% | 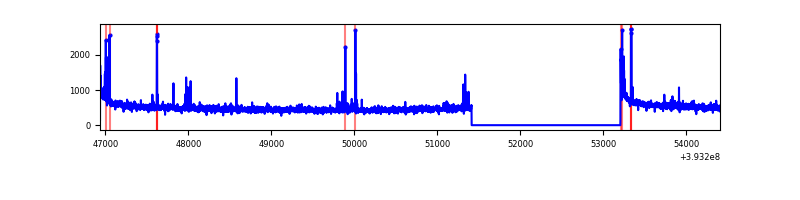 |
| B | 7470 | 5678 | 151 | 151 | 2.02% | 2.66% | 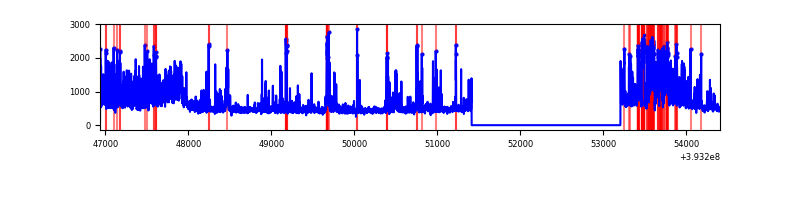 |
| C | 7470 | 5678 | 43 | 43 | 0.58% | 0.76% | 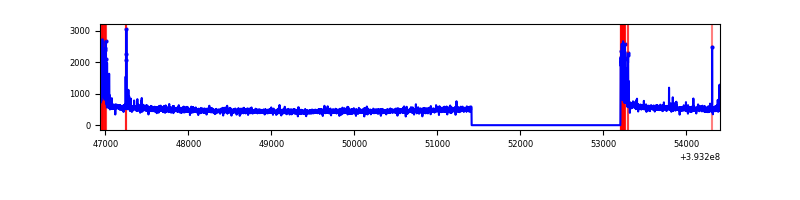 |
| D | 7470 | 5678 | 177 | 177 | 2.37% | 3.12% | 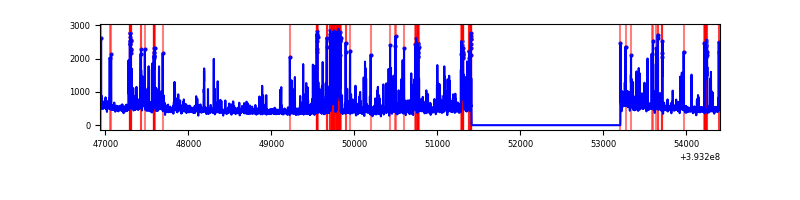 |
Top three noisy pixels from each quadrant. If the there are fewer than three noisy pixels in the level2.evt file, extra rows are filled as -1
| Pixel properties | Quadrant properties | ||||||
|---|---|---|---|---|---|---|---|
| Quadrant | DetID | PixID | Counts | Sigma | Mean | Median | Sigma |
| A | 10 | 83 | 195986 | 1470.35 | 664 | 652 | 132.8 |
| A | 9 | 143 | 83123 | 620.79 | 664 | 652 | 132.8 |
| A | 12 | 189 | 16930 | 122.53 | 664 | 652 | 132.8 |
| B | 4 | 171 | 630384 | 5193.27 | 646 | 630 | 121.3 |
| B | 5 | 172 | 335249 | 2759.44 | 646 | 630 | 121.3 |
| B | 0 | 190 | 260286 | 2141.25 | 646 | 630 | 121.3 |
| C | 15 | 214 | 242038 | 1654.83 | 636 | 641 | 145.9 |
| C | 0 | 10 | 198774 | 1358.24 | 636 | 641 | 145.9 |
| C | 15 | 159 | 23204 | 154.67 | 636 | 641 | 145.9 |
| D | 12 | 6 | 391110 | 2517.2 | 634 | 617 | 155.1 |
| D | 13 | 171 | 118222 | 758.11 | 634 | 617 | 155.1 |
| D | 13 | 249 | 117986 | 756.59 | 634 | 617 | 155.1 |
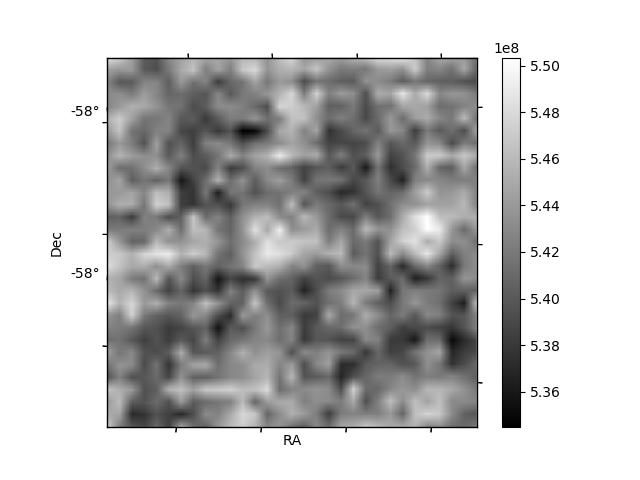
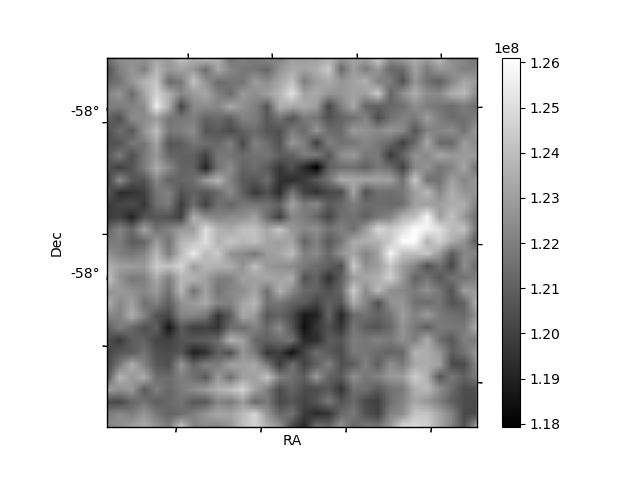
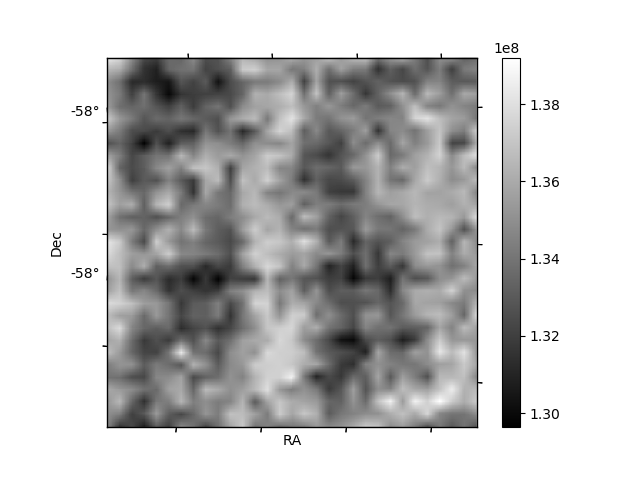
Histogram calculated using DETX and DETY for each event in the final _common_clean file
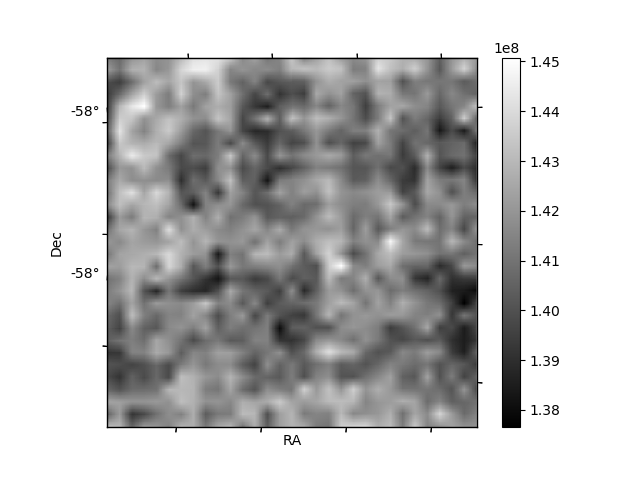
| Quadrant A | 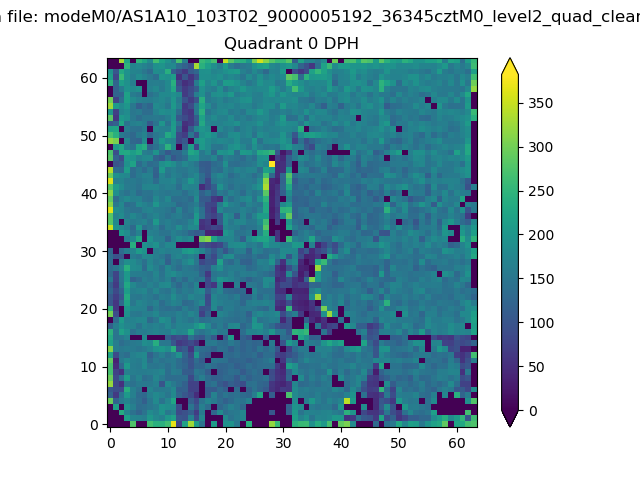 |
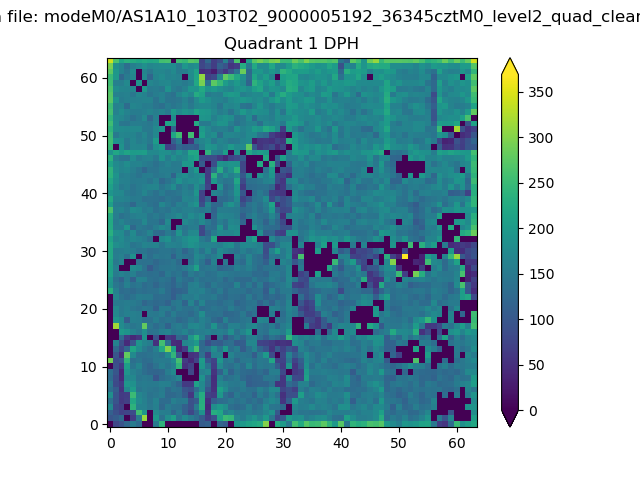 |
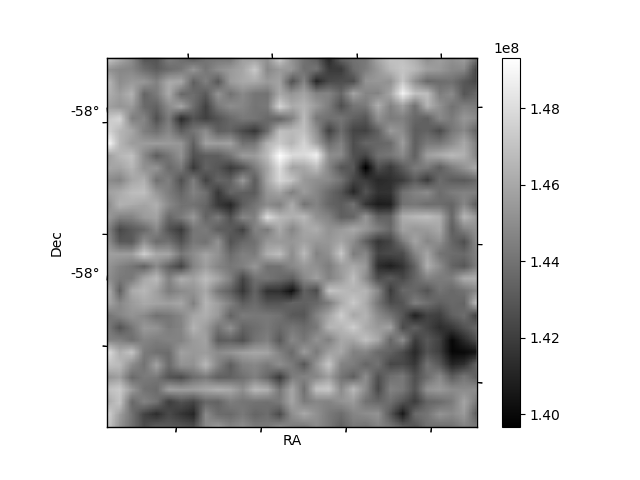
Quadrant B |
|---|---|---|---|
| Quadrant D | 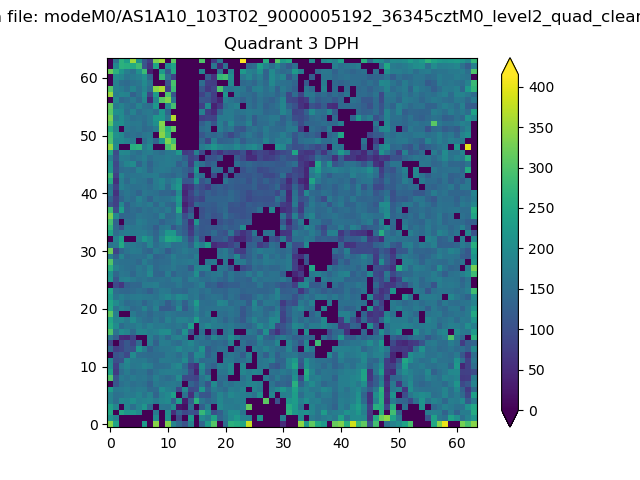 |
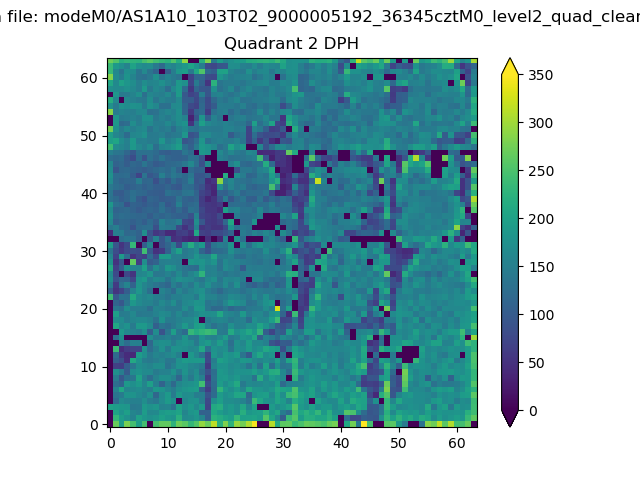 |
Quadrant C |
| Plot type | Count rate plots | Images |
|---|---|---|
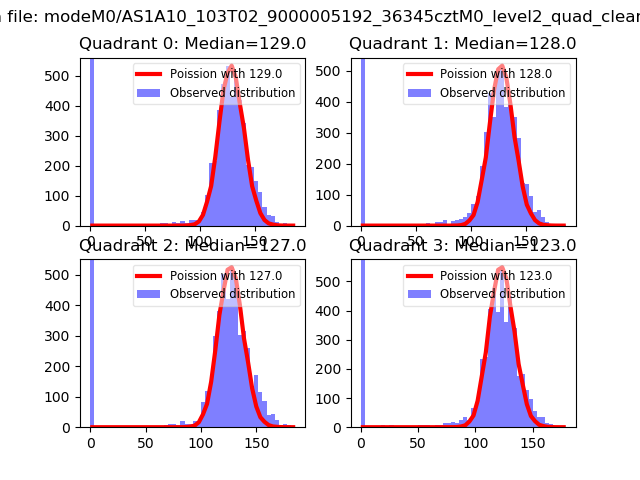
| Comparison with Poisson distribution Blue bars denote a histogram of data divided into 1 sec bins. Red curve is a Poisson curve with rate = median count rate of data. |
 |
 |
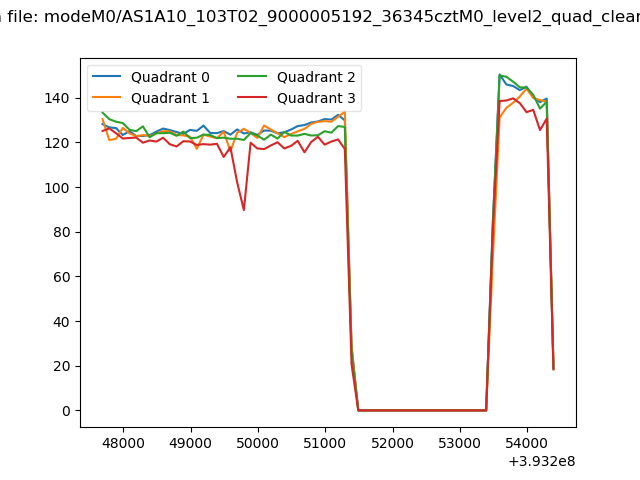
| Quadrant-wise count rates Data is divided into 100 sec bins |
 |
|
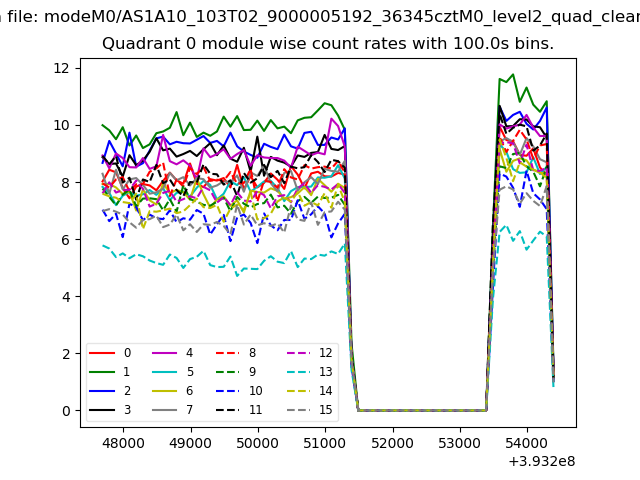
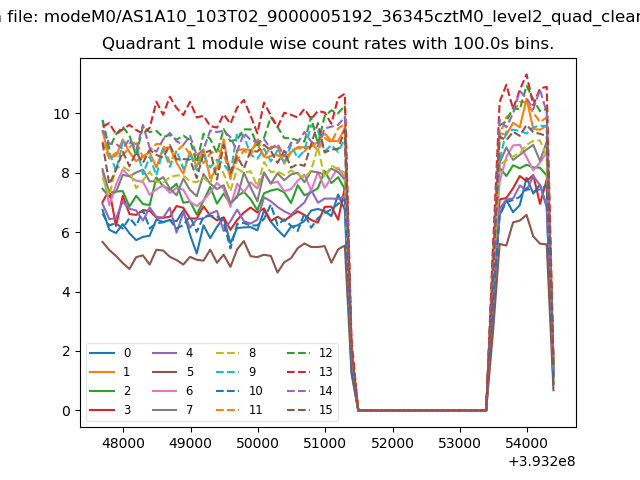
| Module-wise count rates for Quadrant A Data is divided into 100 sec bins |
 |
 |
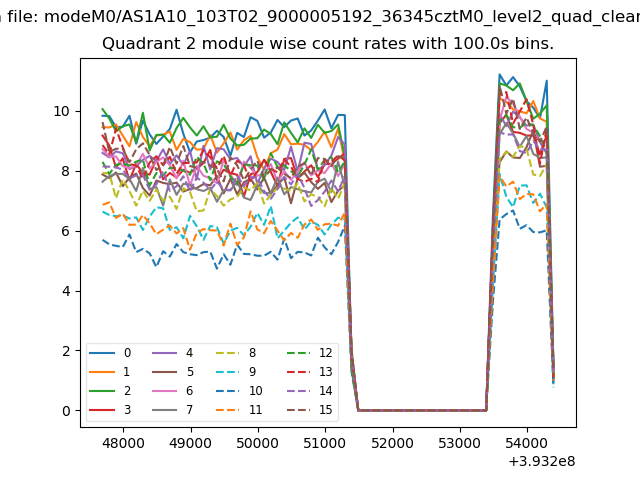
| Module-wise count rates for Quadrant B Data is divided into 100 sec bins |
 |
 |
| Module-wise count rates for Quadrant C Data is divided into 100 sec bins |
 |
 |
| Module-wise count rates for Quadrant D Data is divided into 100 sec bins |
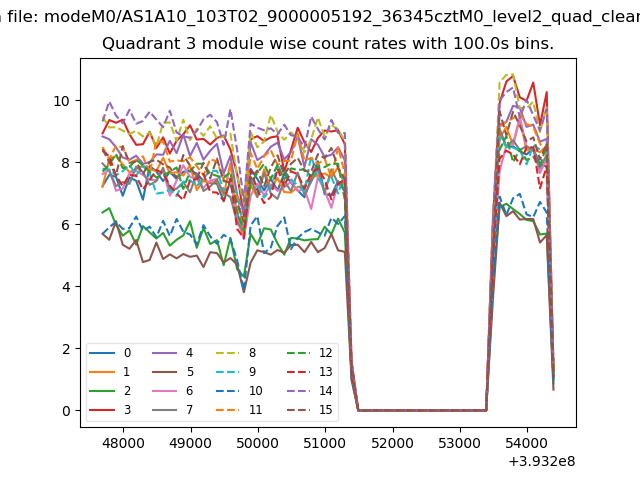 |
 |
| Parameter | Plot |
|---|---|
| CZT HV Monitor | 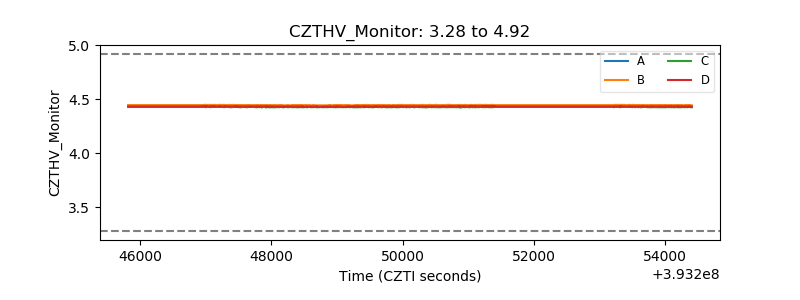 |
| D_VDD | 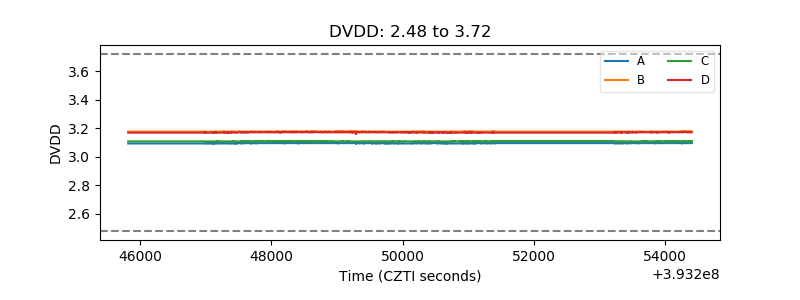 |
| Temperature 1 | 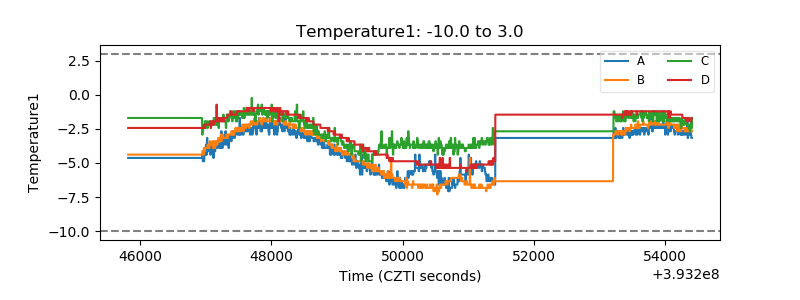 |
| Veto HV Monitor | 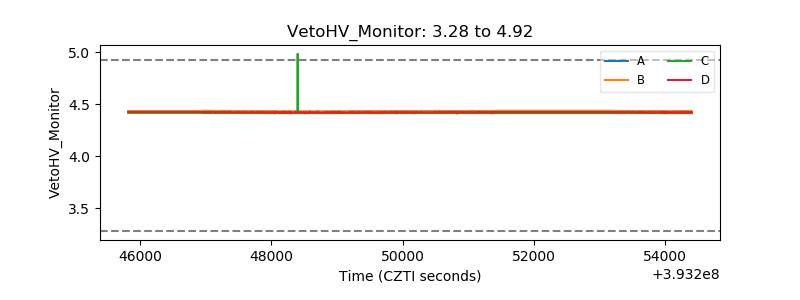 |
| Veto LLD | 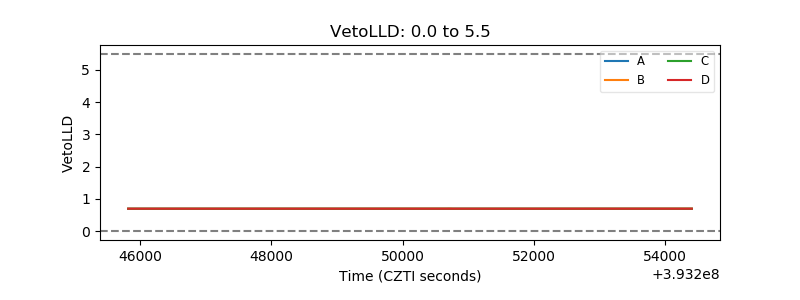 |
| Alpha Counter | 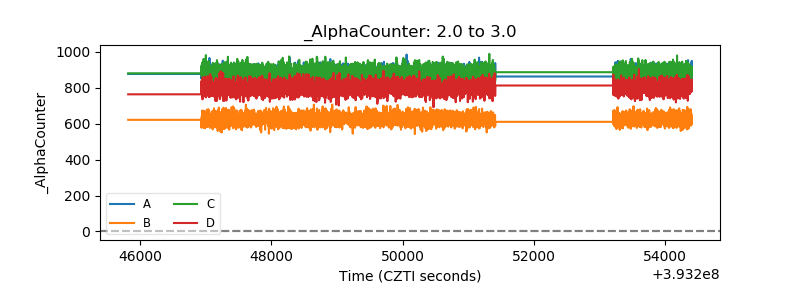 |
| _CPM_Rate | 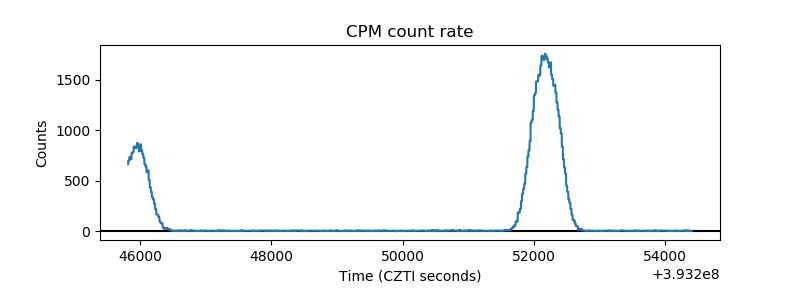 |
| CZT Counter | 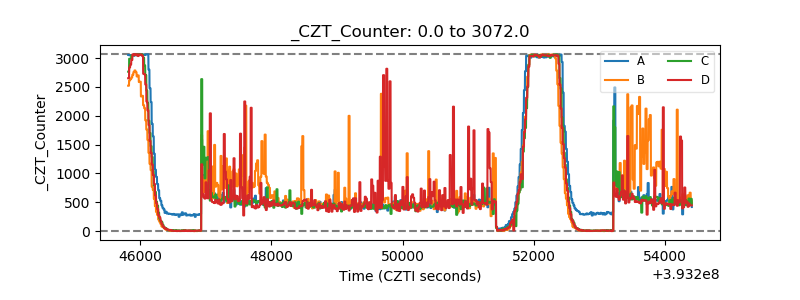 |
| +2.5 Volts monitor |  |
| +5 Volts monitor | 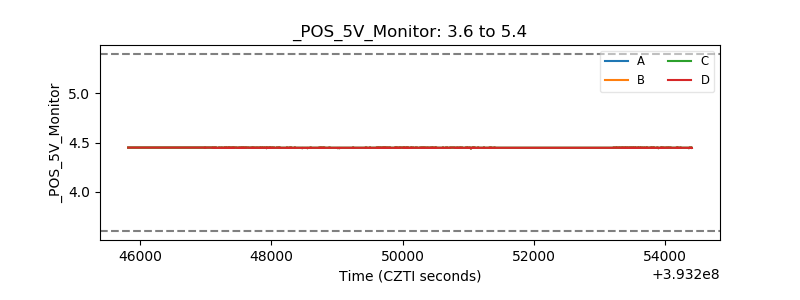 |
| _ROLL_ROT | 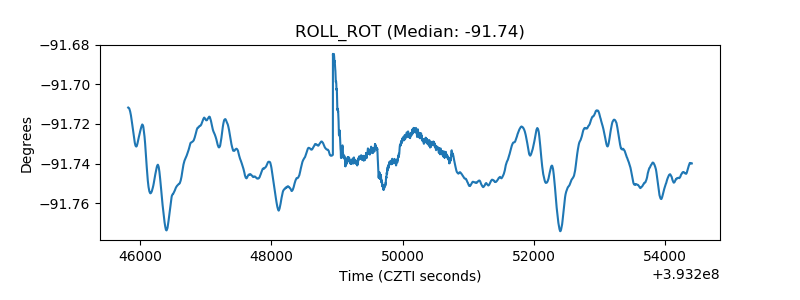 |
| _Roll_DEC | 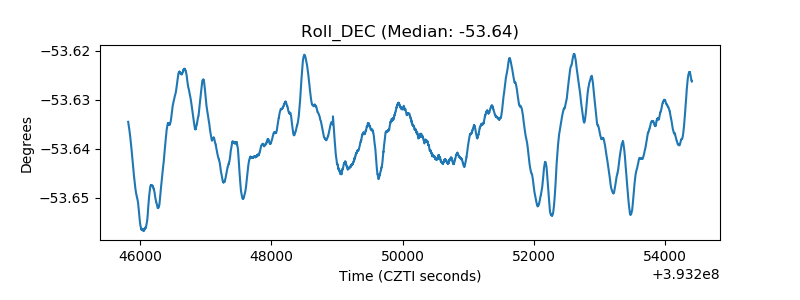 |
| _Roll_RA | 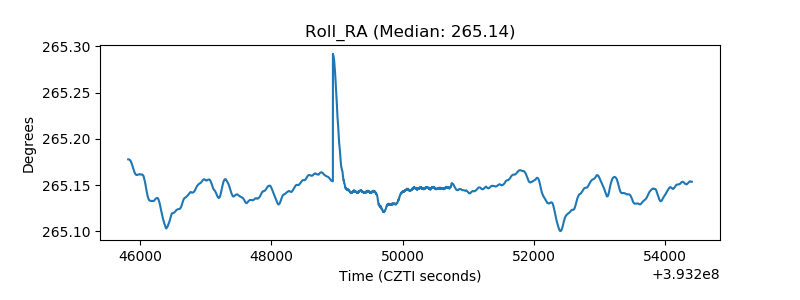 |
| Veto Counter | 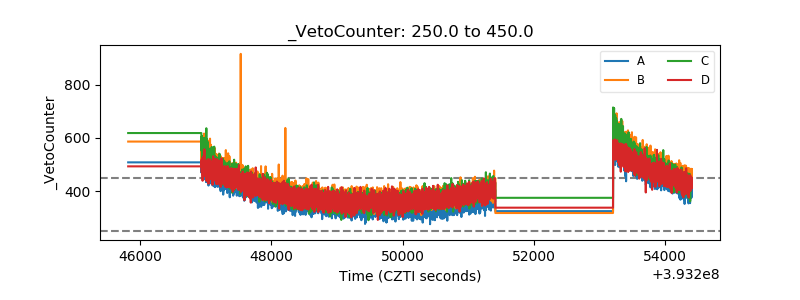 |