| Param | Original file | Final file |
|---|---|---|
| Filename | modeM0/AS1A10_103T02_9000005192cztM0_level2_bc.evt | modeM0/AS1A10_103T02_9000005192cztM0_level2_quad_clean.evt |
| Size (bytes) | 1,444,887,360 | 514,987,200 |
| Size | 1.3 GB | 491.1 MB |
| Events in quadrant A | 7,804,397 | 3,516,066 |
| Events in quadrant B | 12,574,003 | 3,348,175 |
| Events in quadrant C | 8,855,191 | 3,401,041 |
| Events in quadrant D | 12,406,017 | 3,197,689 |
| Mode M9 | |||
|---|---|---|---|
| Quadrant | BADHDUFLAG | Total packets | Discarded packets |
| A | 0 | 145 | 0 |
| B | 0 | 145 | 0 |
| C | 0 | 145 | 0 |
| D | 0 | 145 | 0 |
| Mode SS | |||
|---|---|---|---|
| Quadrant | BADHDUFLAG | Total packets | Discarded packets |
| A | 0 | 636 | 0 |
| B | 0 | 636 | 0 |
| C | 0 | 636 | 0 |
| D | 0 | 636 | 0 |
| Mode M0 | |||
|---|---|---|---|
| Quadrant | BADHDUFLAG | Total packets | Discarded packets |
| A | 0 | 65836 | 0 |
| B | 0 | 90008 | 0 |
| C | 0 | 68256 | 0 |
| D | 0 | 85617 | 0 |
| Quadrant | Total seconds | Saturated seconds | Saturation percentage |
|---|---|---|---|
| A | 31074 | 112 | 0.360430% |
| B | 31074 | 2655 | 8.544120% |
| C | 31074 | 337 | 1.084508% |
| D | 31074 | 1568 | 5.046019% |
Noise dominated data is calculated using 1-second bins in cleaned event files. If a bin has >2000 counts, and if more than 50% of those come from <1% of pixels, then it is considered to be noise-dominated and hence unusable.
| Quadrant | # 1 sec bins | Bins with >0 counts | Bins with >2000 counts | High rate bins dominated by noise | Noise dominated (total time) | Noise dominated (detector-on time) | Marked lightcurve |
|---|---|---|---|---|---|---|---|
| A | 44734 | 31081 | 6 | 6 | 0.01% | 0.02% | 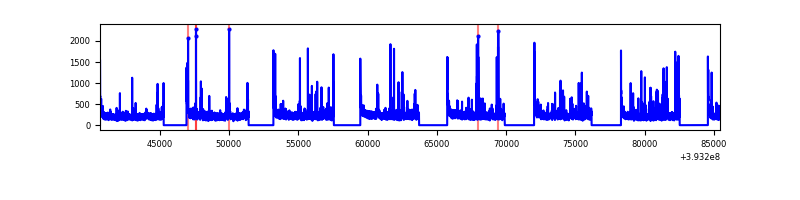 |
| B | 44733 | 31059 | 80 | 80 | 0.18% | 0.26% | 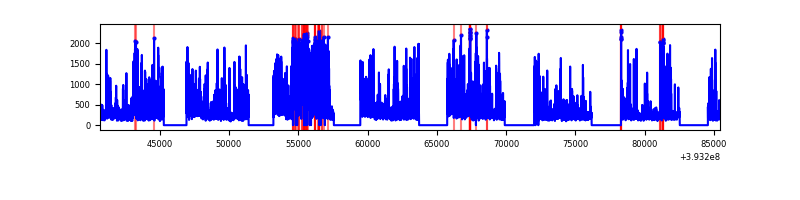 |
| C | 44733 | 31073 | 20 | 20 | 0.04% | 0.06% | 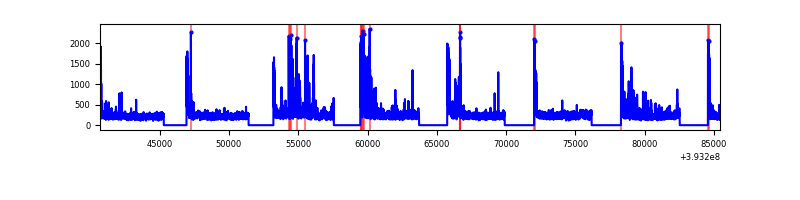 |
| D | 44734 | 31069 | 142 | 142 | 0.32% | 0.46% | 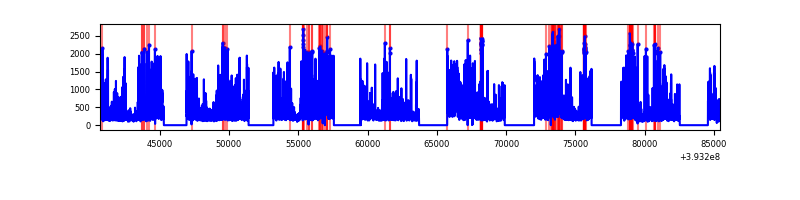 |
Top three noisy pixels from each quadrant. If the there are fewer than three noisy pixels in the level2.evt file, extra rows are filled as -1
| Pixel properties | Quadrant properties | ||||||
|---|---|---|---|---|---|---|---|
| Quadrant | DetID | PixID | Counts | Sigma | Mean | Median | Sigma |
| A | 10 | 83 | 890738 | 2420.29 | 1655 | 1637 | 367.4 |
| A | 9 | 143 | 322397 | 873.17 | 1655 | 1637 | 367.4 |
| A | 7 | 3 | 66276 | 175.96 | 1655 | 1637 | 367.4 |
| B | 4 | 171 | 2652631 | 8361.79 | 1591 | 1563 | 317.0 |
| B | 5 | 172 | 1577941 | 4972.09 | 1591 | 1563 | 317.0 |
| B | 5 | 236 | 872289 | 2746.37 | 1591 | 1563 | 317.0 |
| C | 15 | 214 | 1249607 | 3421.42 | 1589 | 1583 | 364.8 |
| C | 0 | 10 | 780393 | 2135.09 | 1589 | 1583 | 364.8 |
| C | 0 | 207 | 545862 | 1492.13 | 1589 | 1583 | 364.8 |
| D | 12 | 6 | 2558946 | 6845.81 | 1577 | 1535 | 373.6 |
| D | 12 | 227 | 700300 | 1870.49 | 1577 | 1535 | 373.6 |
| D | 2 | 249 | 486539 | 1298.28 | 1577 | 1535 | 373.6 |
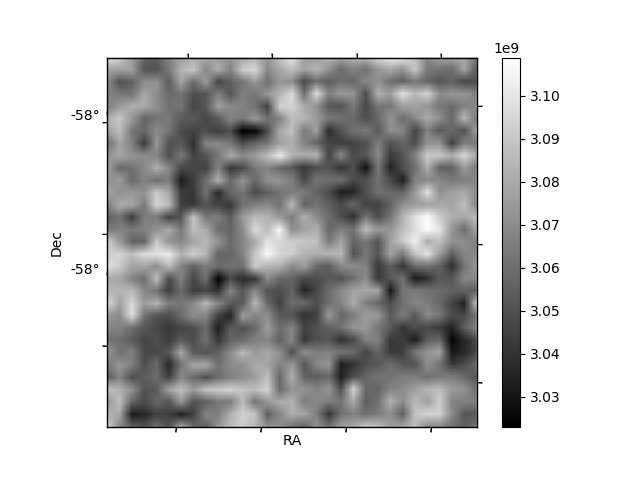
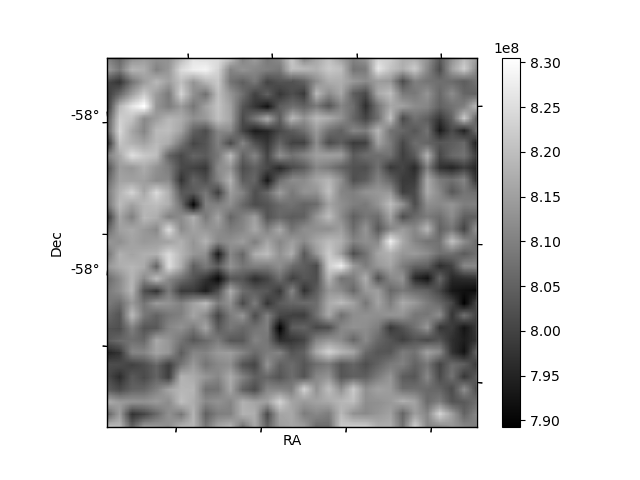
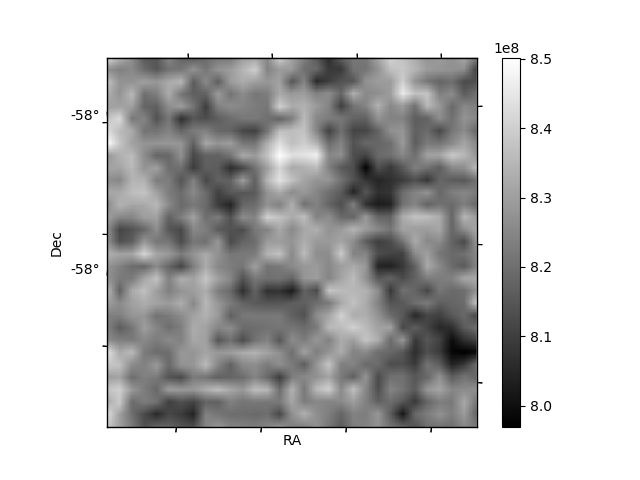
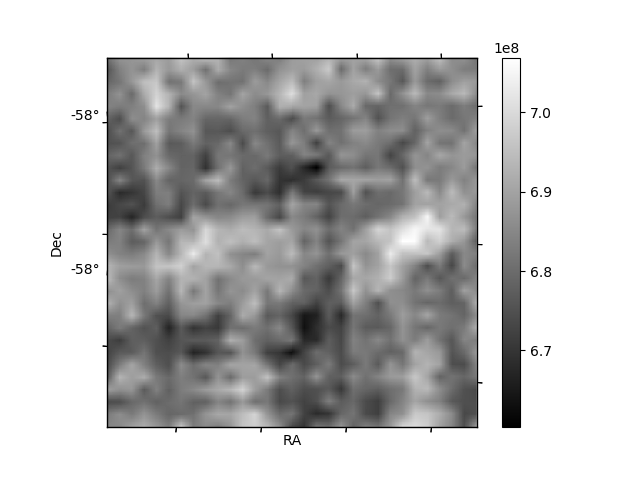
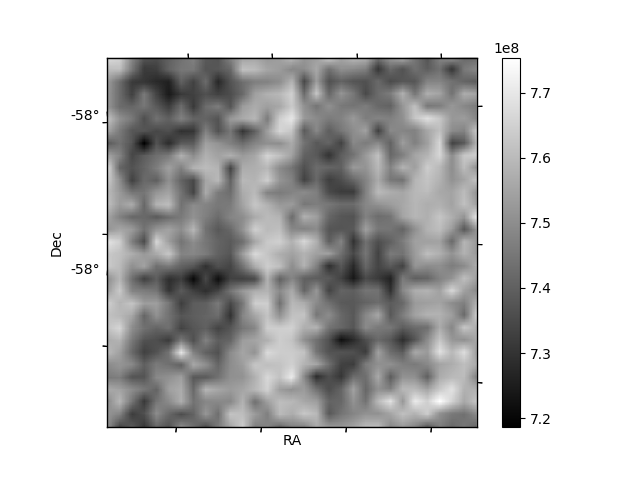
Histogram calculated using DETX and DETY for each event in the final _common_clean file
| Quadrant A | 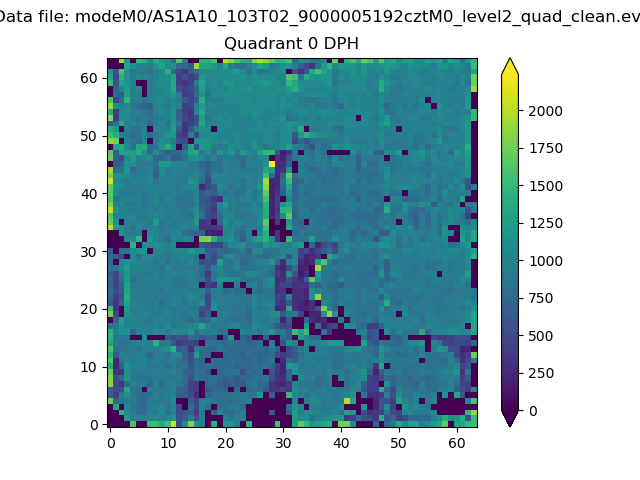 |
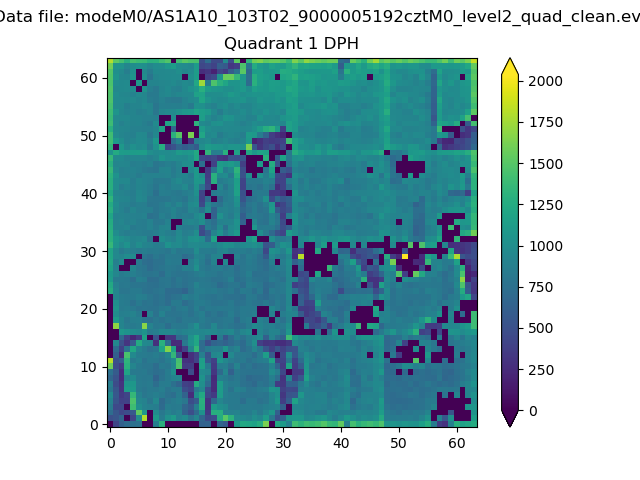 |
Quadrant B |
|---|---|---|---|
| Quadrant D | 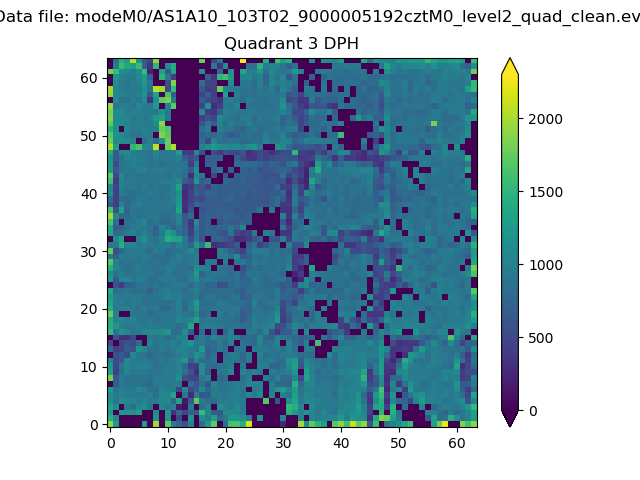 |
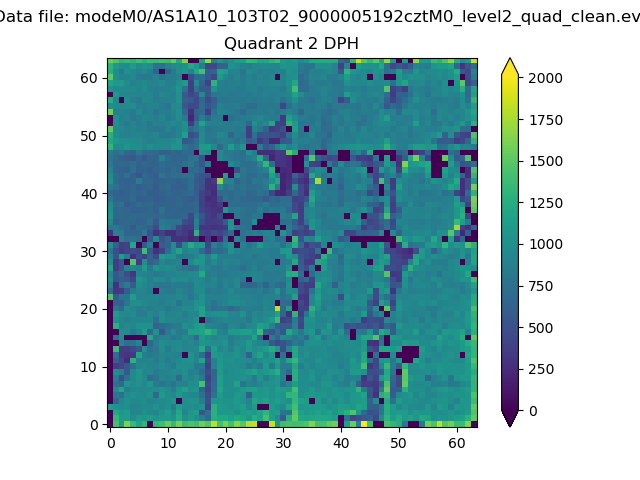 |
Quadrant C |
| Plot type | Count rate plots | Images |
|---|---|---|
| Comparison with Poisson distribution Blue bars denote a histogram of data divided into 1 sec bins. Red curve is a Poisson curve with rate = median count rate of data. |
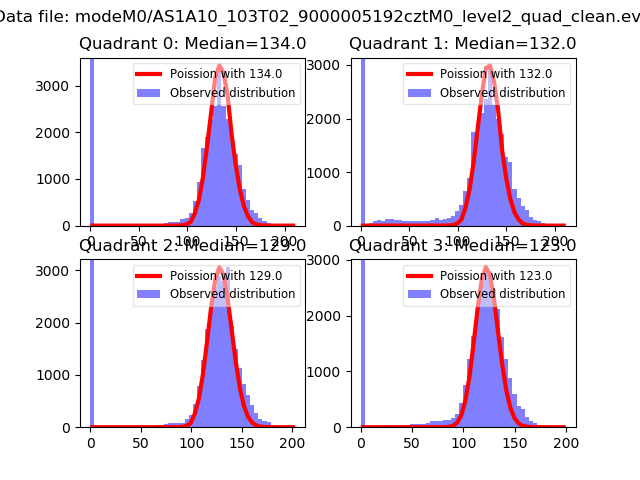 |
 |
| Quadrant-wise count rates Data is divided into 100 sec bins |
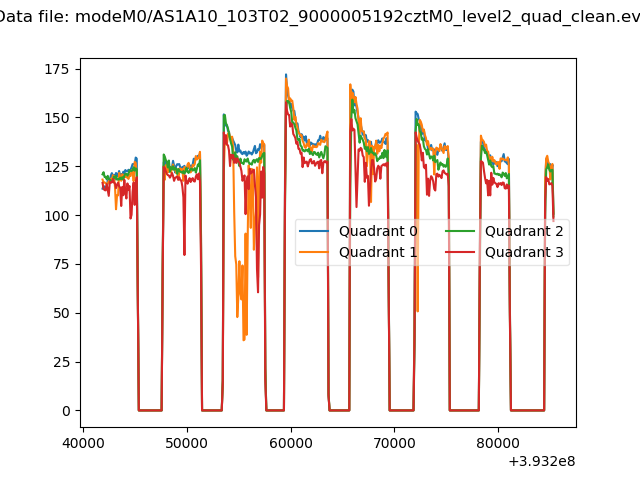 |
|
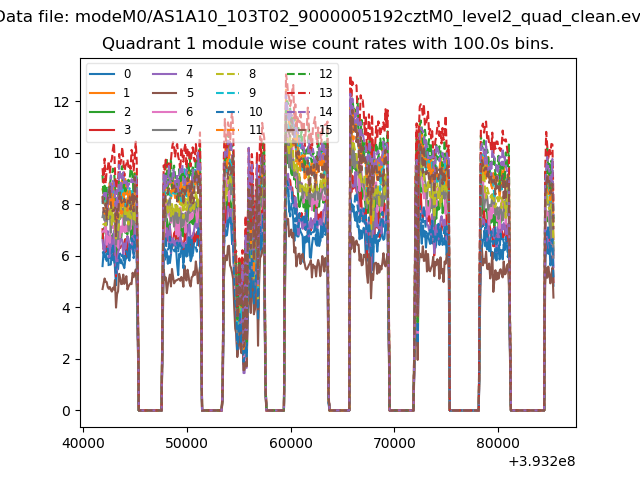
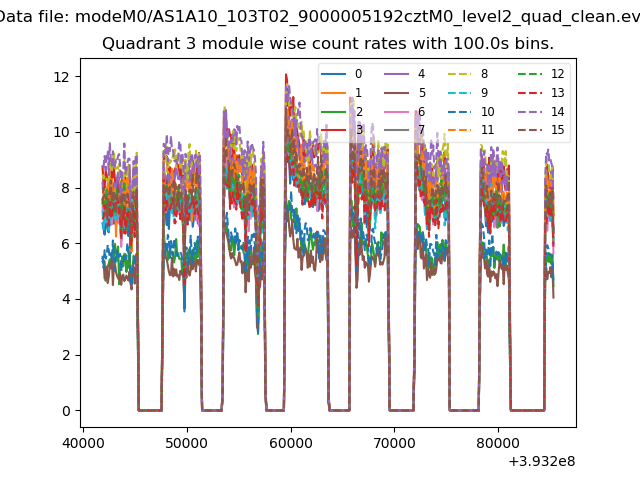
| Module-wise count rates for Quadrant A Data is divided into 100 sec bins |
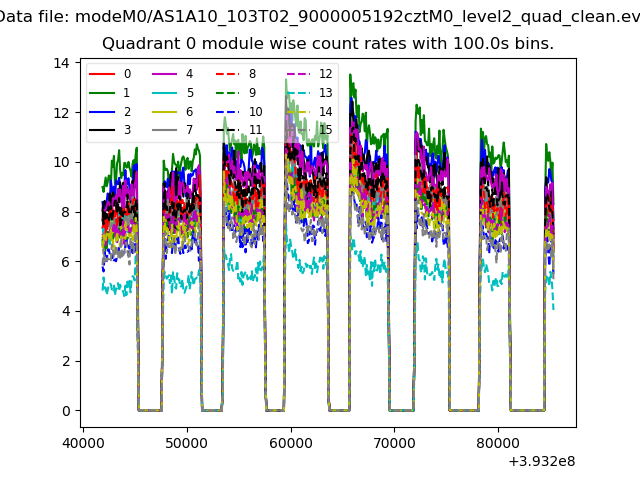 |
 |
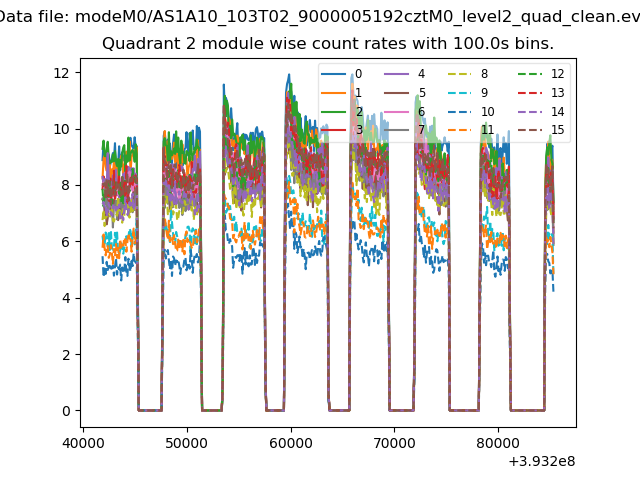
| Module-wise count rates for Quadrant B Data is divided into 100 sec bins |
 |
 |
| Module-wise count rates for Quadrant C Data is divided into 100 sec bins |
 |
 |
| Module-wise count rates for Quadrant D Data is divided into 100 sec bins |
 |
 |
| Parameter | Plot |
|---|---|
| CZT HV Monitor | 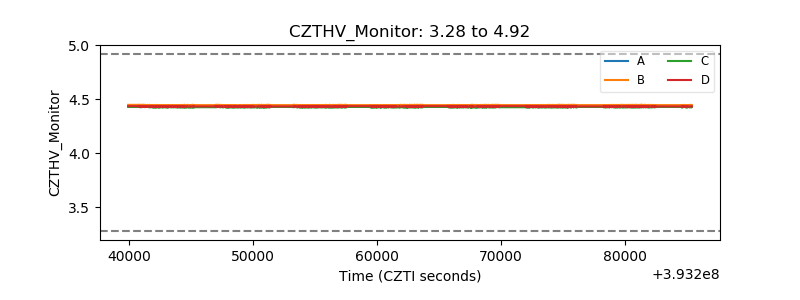 |
| D_VDD | 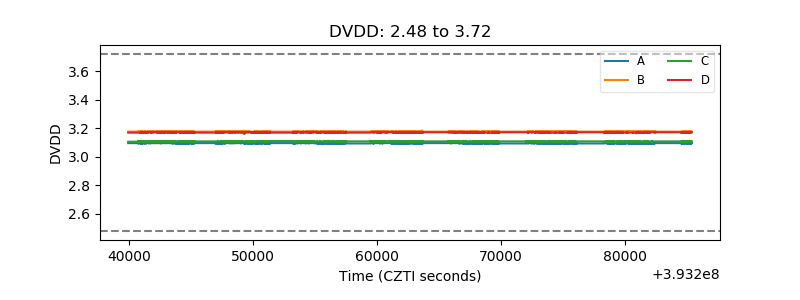 |
| Temperature 1 | 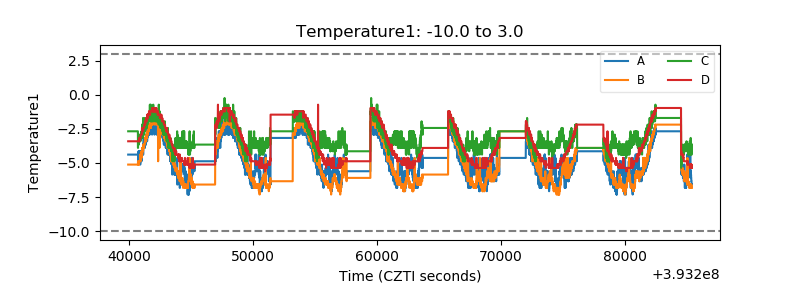 |
| Veto HV Monitor | 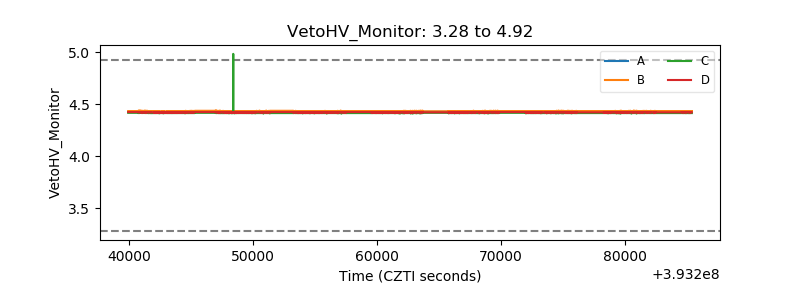 |
| Veto LLD | 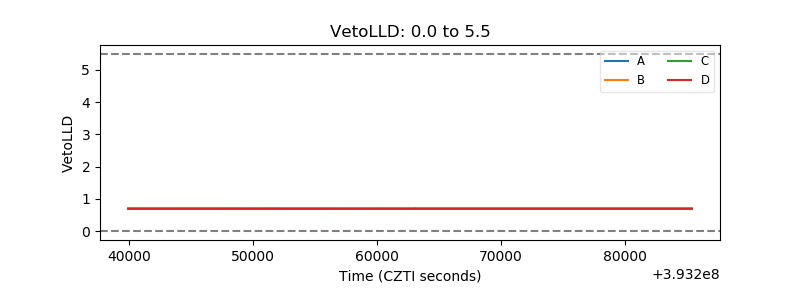 |
| Alpha Counter | 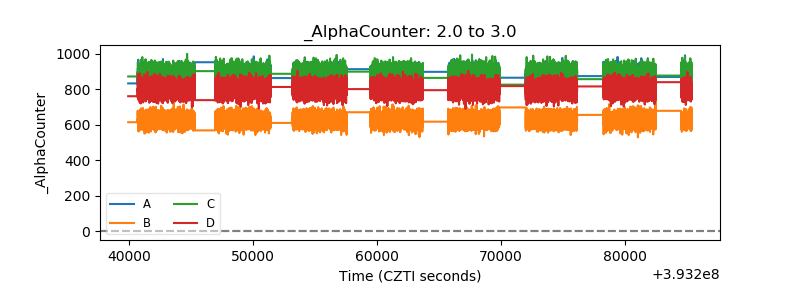 |
| _CPM_Rate | 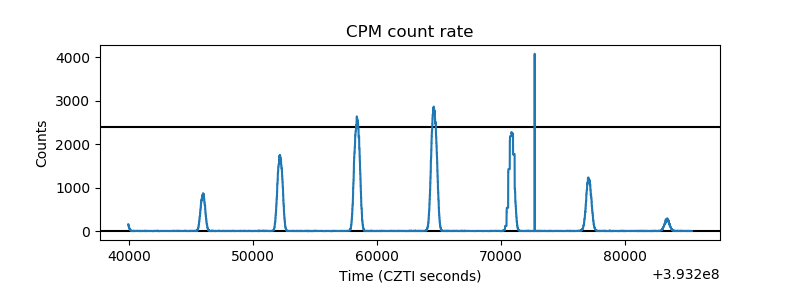 |
| CZT Counter | 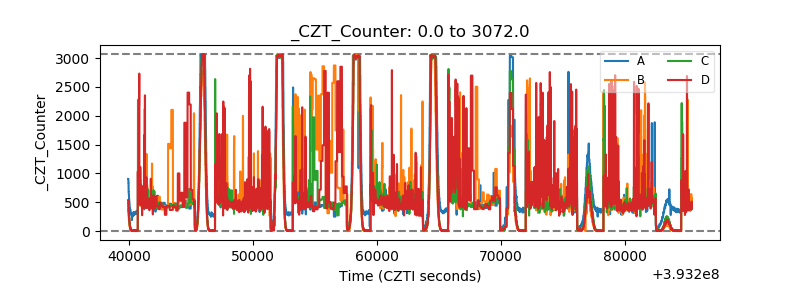 |
| +2.5 Volts monitor | 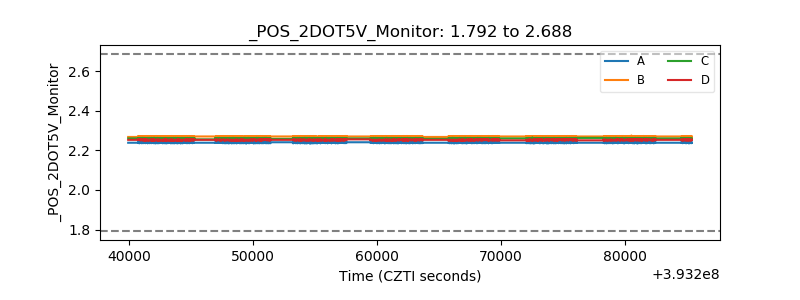 |
| +5 Volts monitor | 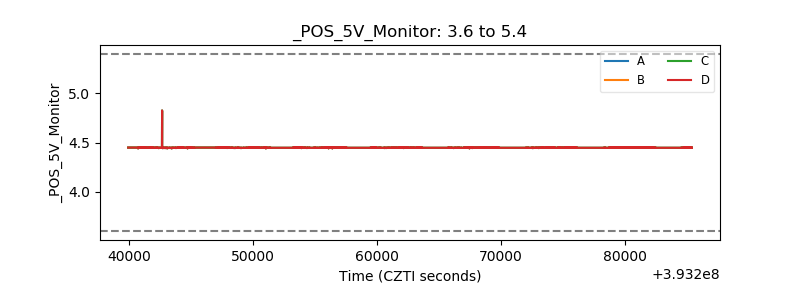 |
| _ROLL_ROT | 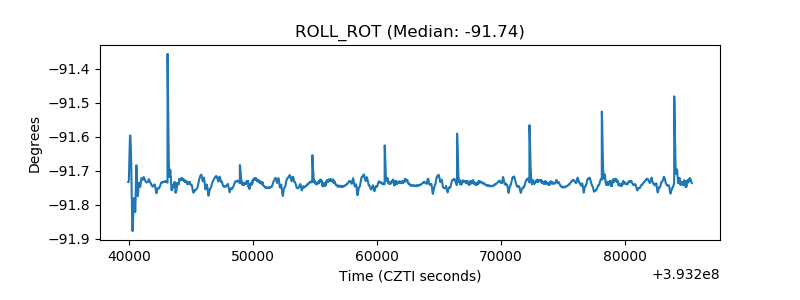 |
| _Roll_DEC | 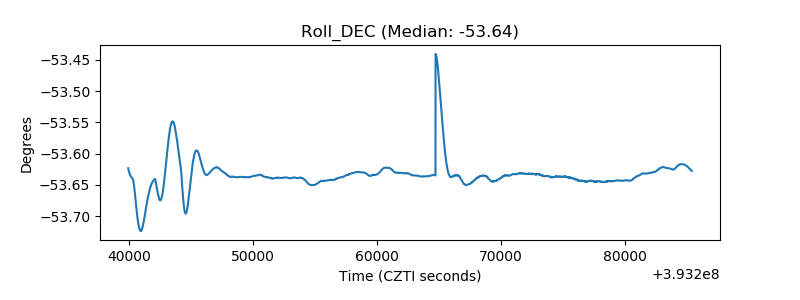 |
| _Roll_RA | 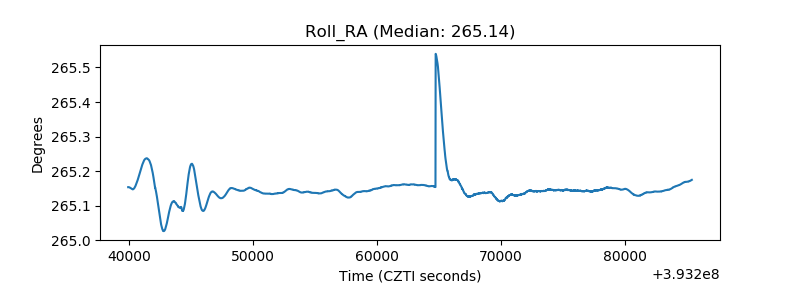 |
| Veto Counter | 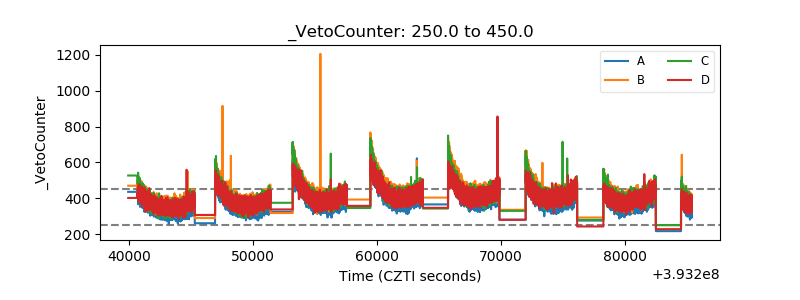 |