| Param | Original file | Final file |
|---|---|---|
| Filename | modeM0/AS1A11_089T02_9000005188_36323cztM0_level2.evt | modeM0/AS1A11_089T02_9000005188_36323cztM0_level2_quad_clean.evt |
| Size (bytes) | 439,038,720 | 47,934,720 |
| Size | 418.7 MB | 45.7 MB |
| Events in quadrant A | 2,153,334 | 302,519 |
| Events in quadrant B | 5,648,562 | 257,761 |
| Events in quadrant C | 2,312,538 | 292,841 |
| Events in quadrant D | 2,873,598 | 278,724 |
| Mode M9 | |||
|---|---|---|---|
| Quadrant | BADHDUFLAG | Total packets | Discarded packets |
| A | 0 | 21 | 0 |
| B | 0 | 21 | 0 |
| C | 0 | 21 | 0 |
| D | 0 | 21 | 0 |
| Mode M0 | |||
|---|---|---|---|
| Quadrant | BADHDUFLAG | Total packets | Discarded packets |
| A | 0 | 9312 | 1 |
| B | 0 | 19912 | 1 |
| C | 0 | 9681 | 1 |
| D | 0 | 11674 | 1 |
| Mode SS | |||
|---|---|---|---|
| Quadrant | BADHDUFLAG | Total packets | Discarded packets |
| A | 0 | 92 | 0 |
| B | 0 | 92 | 0 |
| C | 0 | 92 | 0 |
| D | 0 | 92 | 0 |
| Quadrant | Total seconds | Saturated seconds | Saturation percentage |
|---|---|---|---|
| A | 4537 | 6 | 0.132246% |
| B | 4537 | 1238 | 27.286753% |
| C | 4537 | 46 | 1.013886% |
| D | 4537 | 100 | 2.204100% |
Noise dominated data is calculated using 1-second bins in cleaned event files. If a bin has >2000 counts, and if more than 50% of those come from <1% of pixels, then it is considered to be noise-dominated and hence unusable.
| Quadrant | # 1 sec bins | Bins with >0 counts | Bins with >2000 counts | High rate bins dominated by noise | Noise dominated (total time) | Noise dominated (detector-on time) | Marked lightcurve |
|---|---|---|---|---|---|---|---|
| A | 6600 | 4538 | 0 | 0 | 0.00% | 0.00% | 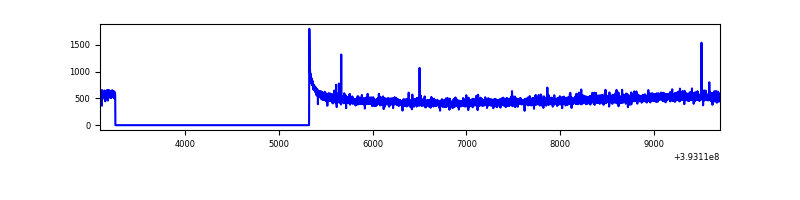 |
| B | 6600 | 4538 | 1058 | 1058 | 16.03% | 23.31% | 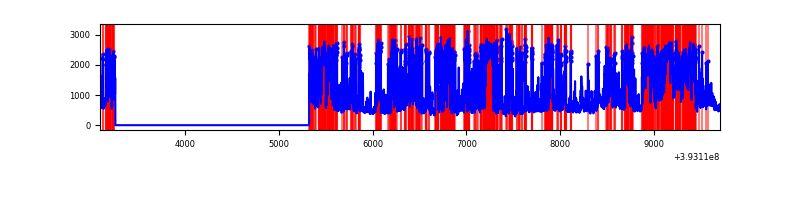 |
| C | 6600 | 4538 | 46 | 46 | 0.70% | 1.01% | 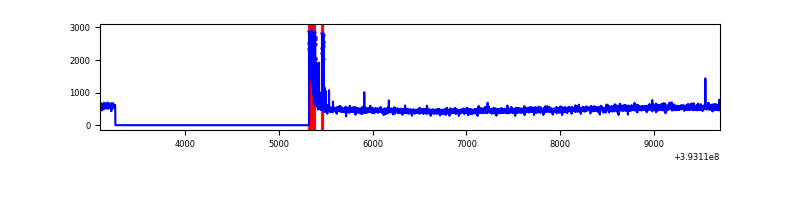 |
| D | 6600 | 4538 | 102 | 102 | 1.55% | 2.25% | 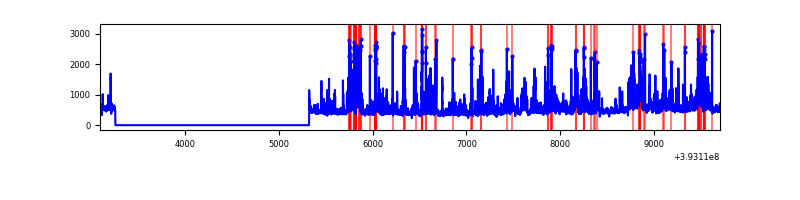 |
Top three noisy pixels from each quadrant. If the there are fewer than three noisy pixels in the level2.evt file, extra rows are filled as -1
| Pixel properties | Quadrant properties | ||||||
|---|---|---|---|---|---|---|---|
| Quadrant | DetID | PixID | Counts | Sigma | Mean | Median | Sigma |
| A | 10 | 83 | 119628 | 1124.51 | 523 | 513 | 105.9 |
| A | 13 | 254 | 6189 | 53.58 | 523 | 513 | 105.9 |
| A | 12 | 189 | 5998 | 51.78 | 523 | 513 | 105.9 |
| B | 5 | 172 | 1969786 | 22001.59 | 458 | 447 | 89.5 |
| B | 4 | 171 | 1408556 | 15731.49 | 458 | 447 | 89.5 |
| B | 5 | 236 | 310586 | 3464.89 | 458 | 447 | 89.5 |
| C | 15 | 214 | 187179 | 1579.52 | 502 | 507 | 118.2 |
| C | 0 | 10 | 163654 | 1380.46 | 502 | 507 | 118.2 |
| C | 13 | 61 | 3394 | 24.43 | 502 | 507 | 118.2 |
| D | 12 | 6 | 409868 | 3339.03 | 499 | 486 | 122.6 |
| D | 12 | 227 | 149084 | 1212.01 | 499 | 486 | 122.6 |
| D | 13 | 171 | 144454 | 1174.24 | 499 | 486 | 122.6 |
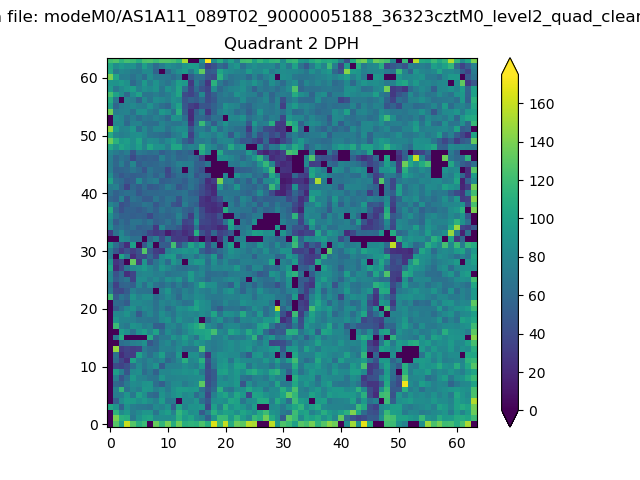
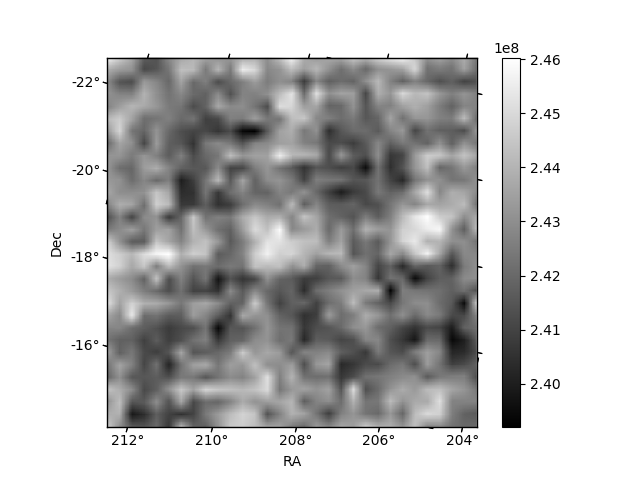
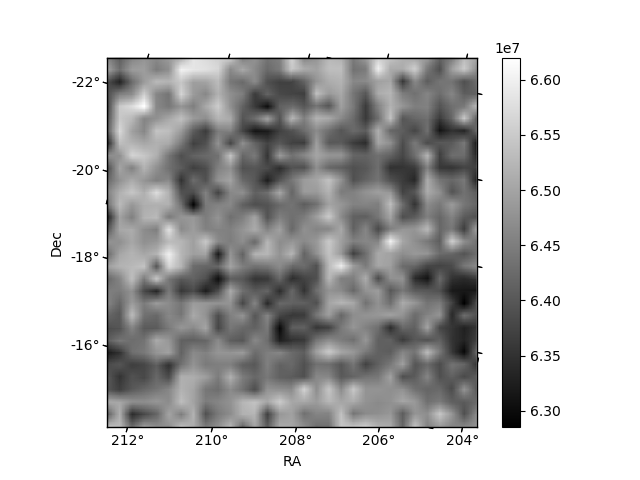
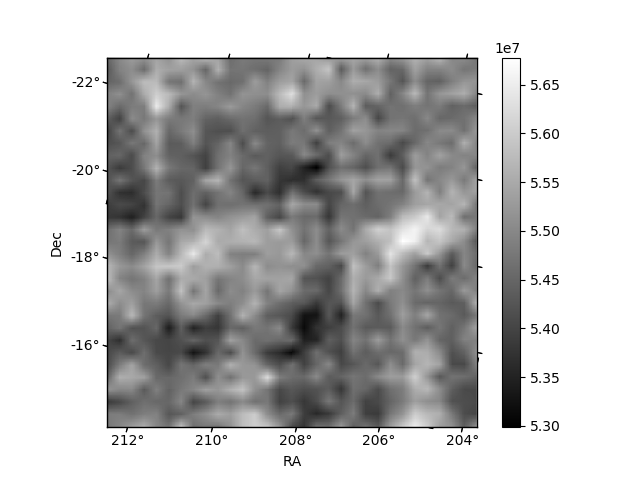
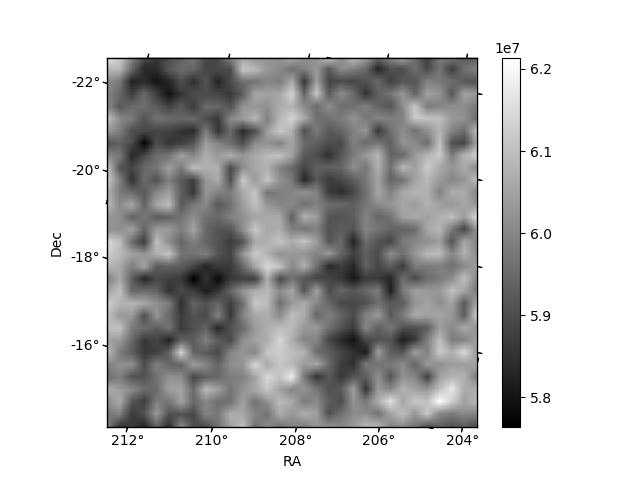
Histogram calculated using DETX and DETY for each event in the final _common_clean file
| Quadrant A | 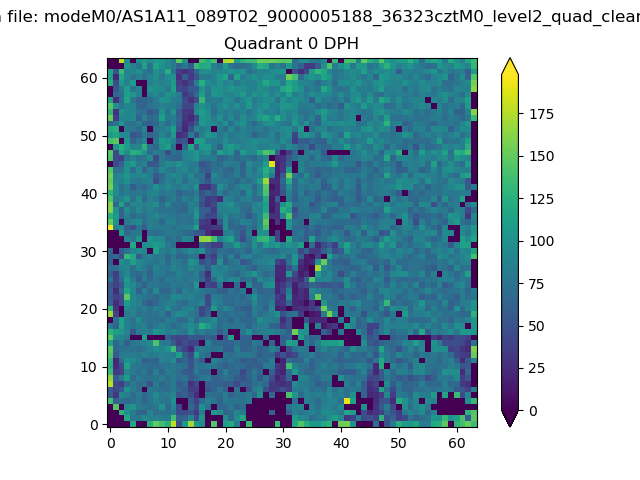 |
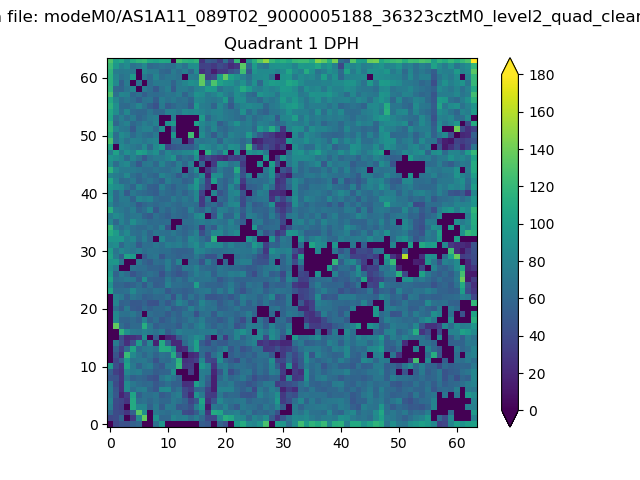 |
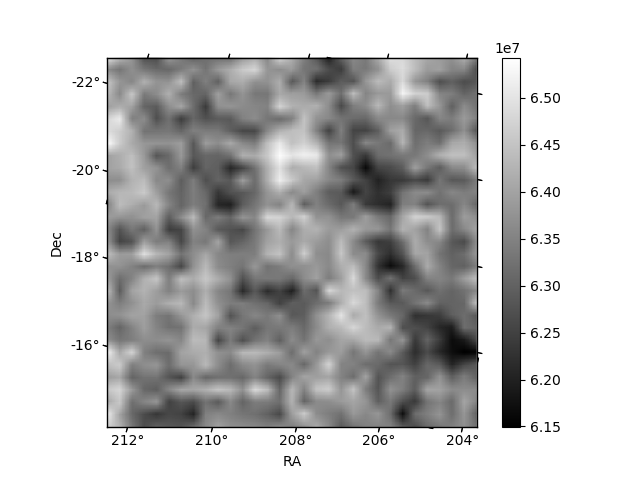
Quadrant B |
|---|---|---|---|
| Quadrant D | 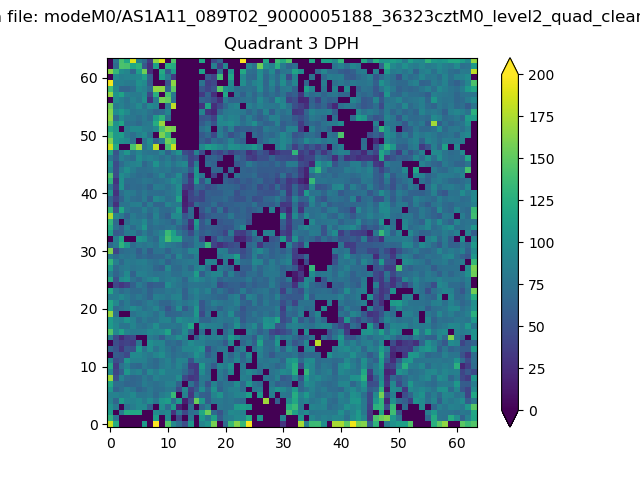 |
 |
Quadrant C |
| Plot type | Count rate plots | Images |
|---|---|---|
| Comparison with Poisson distribution Blue bars denote a histogram of data divided into 1 sec bins. Red curve is a Poisson curve with rate = median count rate of data. |
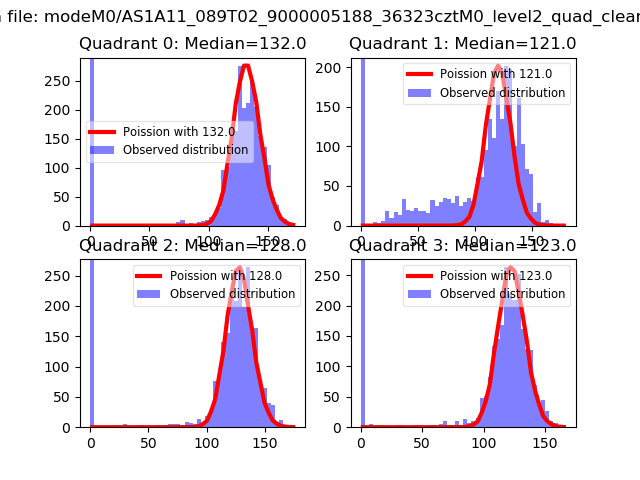 |
 |
| Quadrant-wise count rates Data is divided into 100 sec bins |
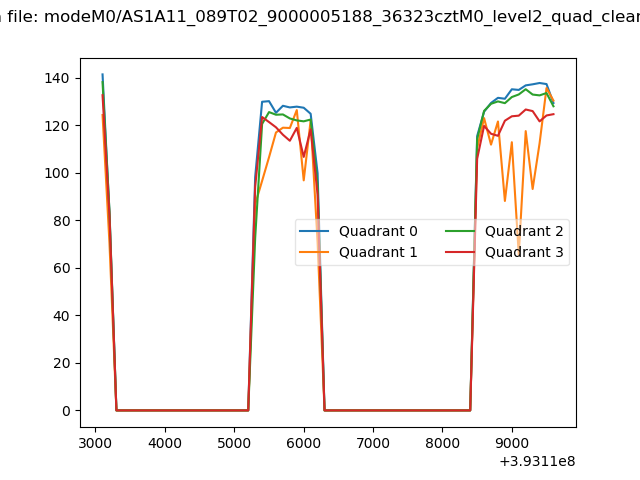 |
|
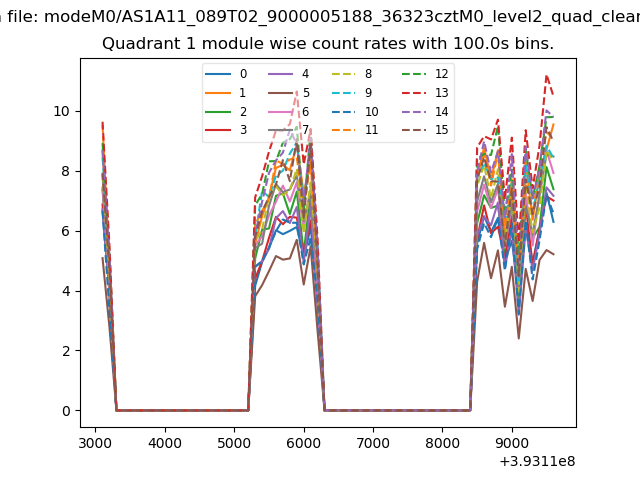
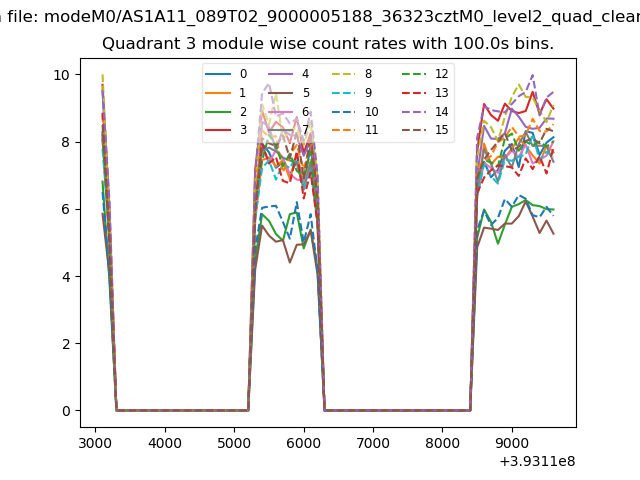
| Module-wise count rates for Quadrant A Data is divided into 100 sec bins |
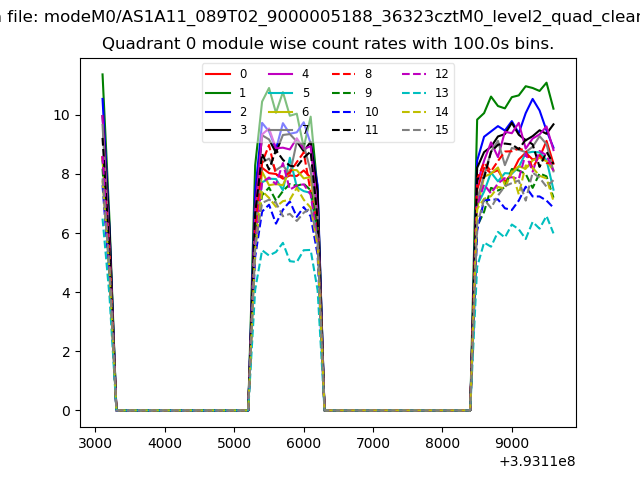 |
 |
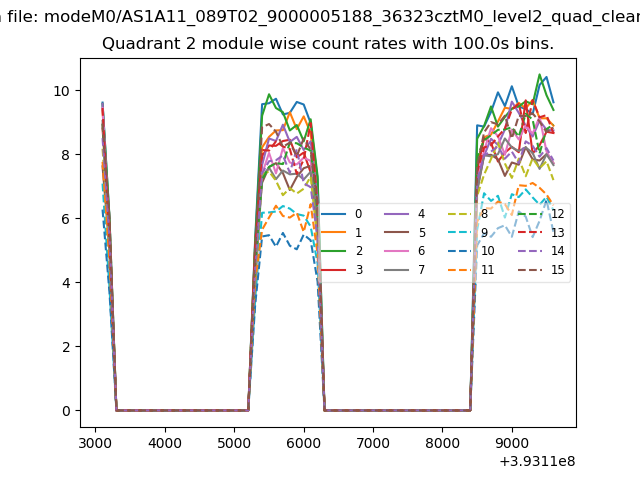
| Module-wise count rates for Quadrant B Data is divided into 100 sec bins |
 |
 |
| Module-wise count rates for Quadrant C Data is divided into 100 sec bins |
 |
 |
| Module-wise count rates for Quadrant D Data is divided into 100 sec bins |
 |
 |
| Parameter | Plot |
|---|---|
| CZT HV Monitor | 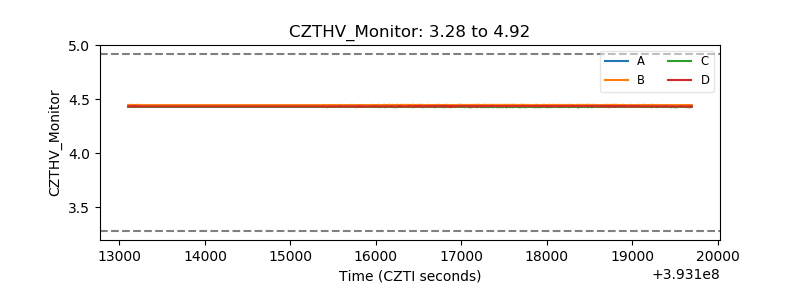 |
| D_VDD | 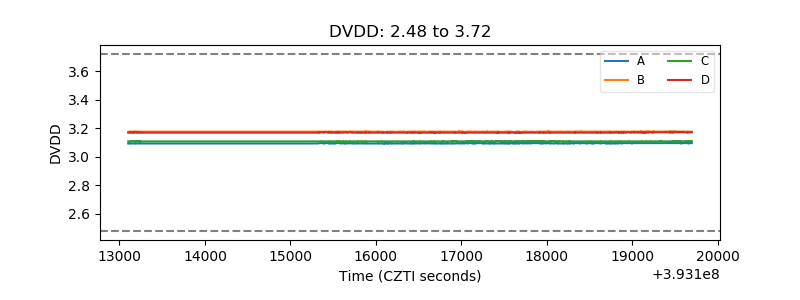 |
| Temperature 1 | 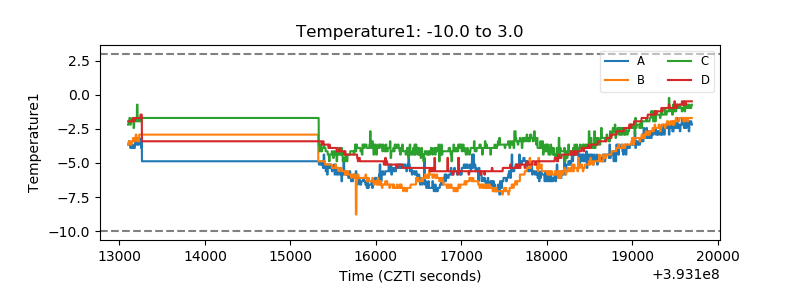 |
| Veto HV Monitor | 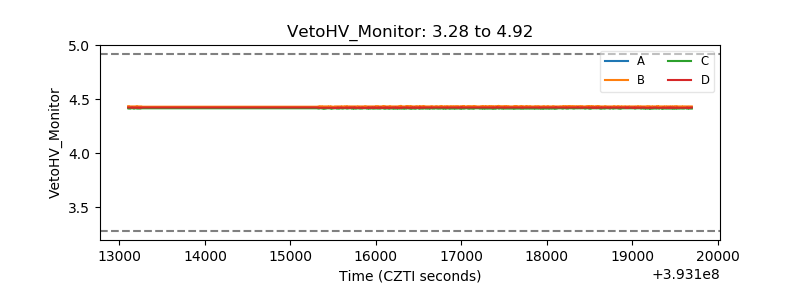 |
| Veto LLD | 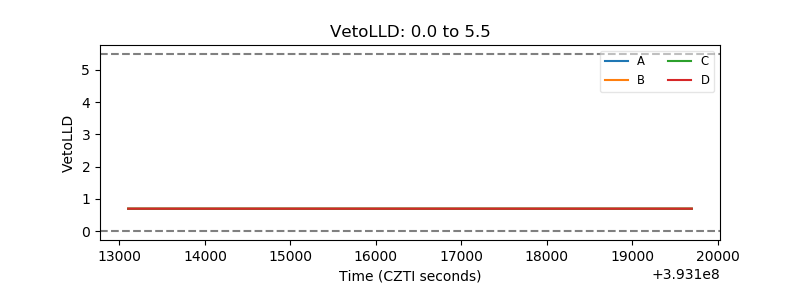 |
| Alpha Counter | 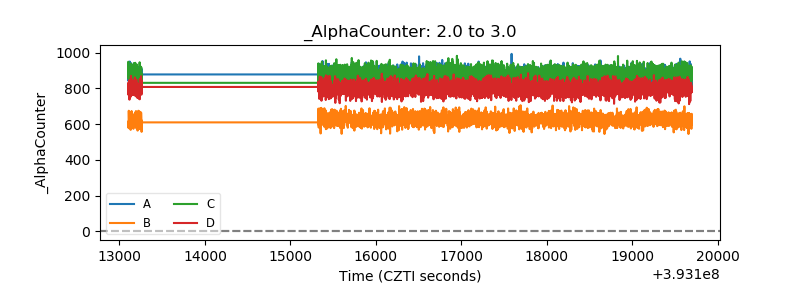 |
| _CPM_Rate | 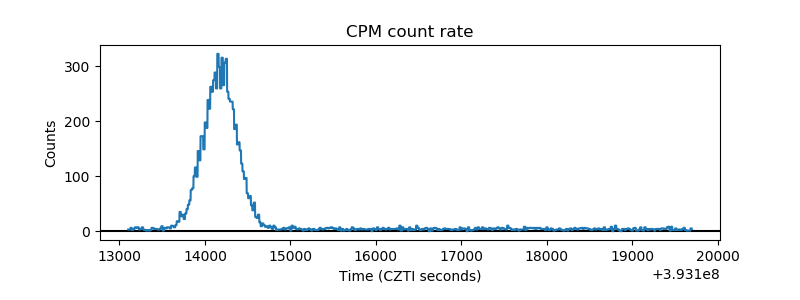 |
| CZT Counter | 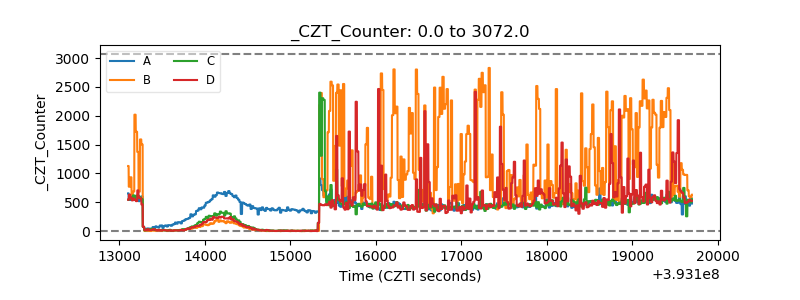 |
| +2.5 Volts monitor | 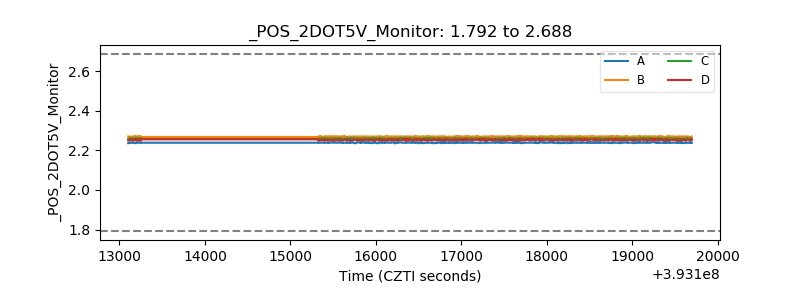 |
| +5 Volts monitor | 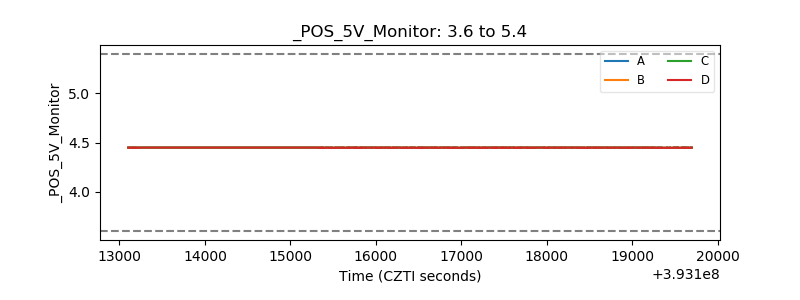 |
| _ROLL_ROT | 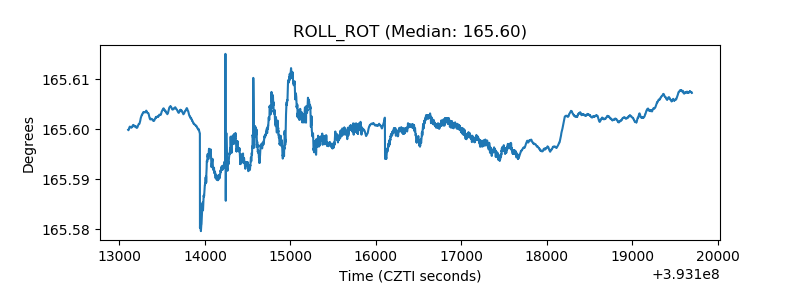 |
| _Roll_DEC | 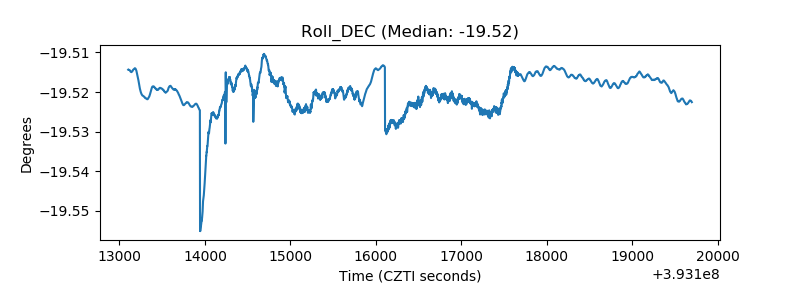 |
| _Roll_RA | 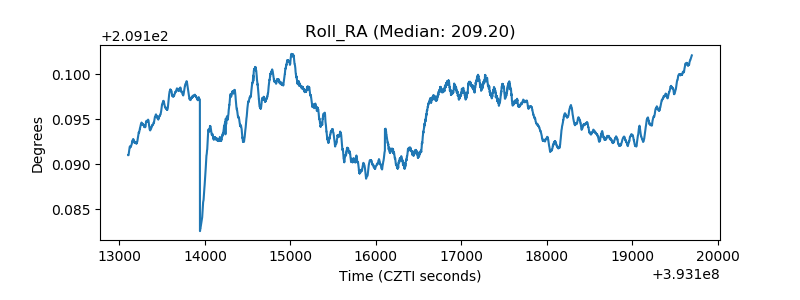 |
| Veto Counter | 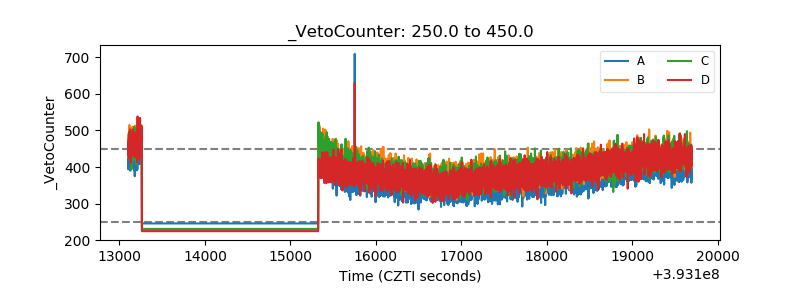 |