| Param | Original file | Final file |
|---|---|---|
| Filename | modeM0/AS1A11_089T02_9000005188_36321cztM0_level2.evt | modeM0/AS1A11_089T02_9000005188_36321cztM0_level2_quad_clean.evt |
| Size (bytes) | 533,013,120 | 54,927,360 |
| Size | 508.3 MB | 52.4 MB |
| Events in quadrant A | 2,430,944 | 360,748 |
| Events in quadrant B | 6,715,984 | 310,877 |
| Events in quadrant C | 2,736,892 | 341,576 |
| Events in quadrant D | 3,923,336 | 302,449 |
| Mode M9 | |||
|---|---|---|---|
| Quadrant | BADHDUFLAG | Total packets | Discarded packets |
| A | 0 | 40 | 0 |
| B | 0 | 40 | 0 |
| C | 0 | 40 | 0 |
| D | 0 | 41 | 0 |
| Mode M0 | |||
|---|---|---|---|
| Quadrant | BADHDUFLAG | Total packets | Discarded packets |
| A | 0 | 10422 | 3 |
| B | 0 | 23368 | 2 |
| C | 0 | 11201 | 2 |
| D | 0 | 15012 | 2 |
| Mode SS | |||
|---|---|---|---|
| Quadrant | BADHDUFLAG | Total packets | Discarded packets |
| A | 0 | 100 | 0 |
| B | 0 | 100 | 0 |
| C | 0 | 100 | 0 |
| D | 0 | 100 | 0 |
| Quadrant | Total seconds | Saturated seconds | Saturation percentage |
|---|---|---|---|
| A | 4946 | 6 | 0.121310% |
| B | 4946 | 1556 | 31.459765% |
| C | 4946 | 120 | 2.426203% |
| D | 4946 | 560 | 11.322281% |
Noise dominated data is calculated using 1-second bins in cleaned event files. If a bin has >2000 counts, and if more than 50% of those come from <1% of pixels, then it is considered to be noise-dominated and hence unusable.
| Quadrant | # 1 sec bins | Bins with >0 counts | Bins with >2000 counts | High rate bins dominated by noise | Noise dominated (total time) | Noise dominated (detector-on time) | Marked lightcurve |
|---|---|---|---|---|---|---|---|
| A | 7009 | 4947 | 0 | 0 | 0.00% | 0.00% | 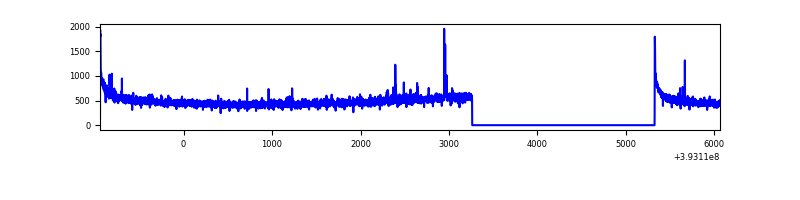 |
| B | 7008 | 4946 | 1325 | 1325 | 18.91% | 26.79% | 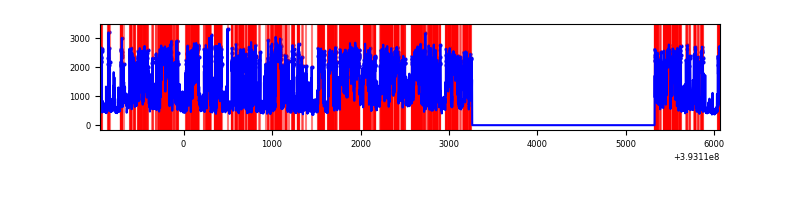 |
| C | 7009 | 4947 | 108 | 108 | 1.54% | 2.18% | 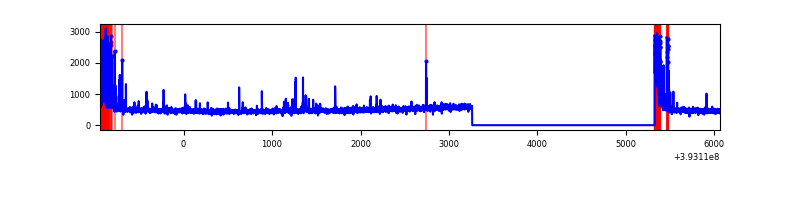 |
| D | 7009 | 4947 | 536 | 536 | 7.65% | 10.83% | 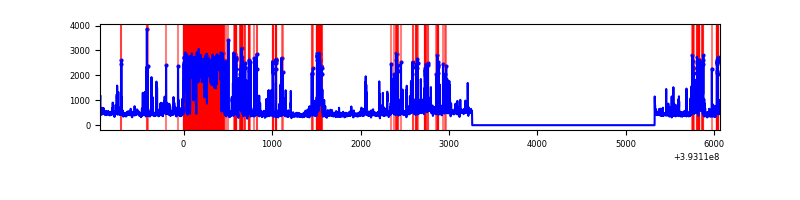 |
Top three noisy pixels from each quadrant. If the there are fewer than three noisy pixels in the level2.evt file, extra rows are filled as -1
| Pixel properties | Quadrant properties | ||||||
|---|---|---|---|---|---|---|---|
| Quadrant | DetID | PixID | Counts | Sigma | Mean | Median | Sigma |
| A | 10 | 83 | 177104 | 1528.75 | 569 | 560 | 115.5 |
| A | 9 | 143 | 25119 | 212.66 | 569 | 560 | 115.5 |
| A | 13 | 6 | 11316 | 93.14 | 569 | 560 | 115.5 |
| B | 5 | 172 | 2179206 | 23084.58 | 495 | 484 | 94.4 |
| B | 5 | 236 | 1351746 | 14317.25 | 495 | 484 | 94.4 |
| B | 4 | 171 | 1051956 | 11140.84 | 495 | 484 | 94.4 |
| C | 0 | 10 | 380023 | 3004.16 | 540 | 547 | 126.3 |
| C | 15 | 214 | 208715 | 1647.99 | 540 | 547 | 126.3 |
| C | 15 | 159 | 26041 | 201.83 | 540 | 547 | 126.3 |
| D | 12 | 6 | 1477897 | 11597.88 | 512 | 495 | 127.4 |
| D | 13 | 171 | 159262 | 1246.35 | 512 | 495 | 127.4 |
| D | 2 | 250 | 101246 | 790.91 | 512 | 495 | 127.4 |
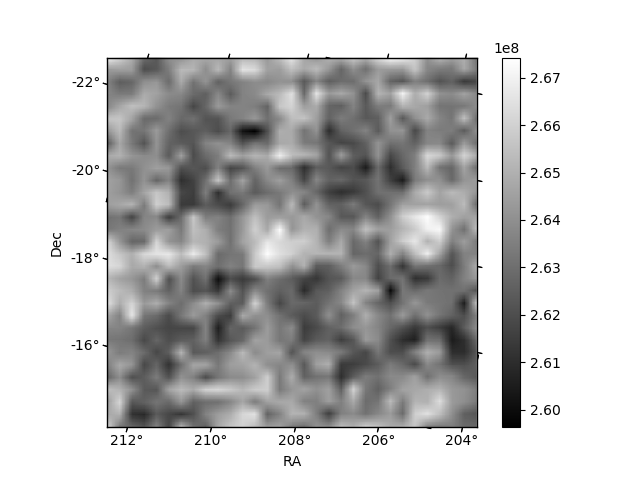
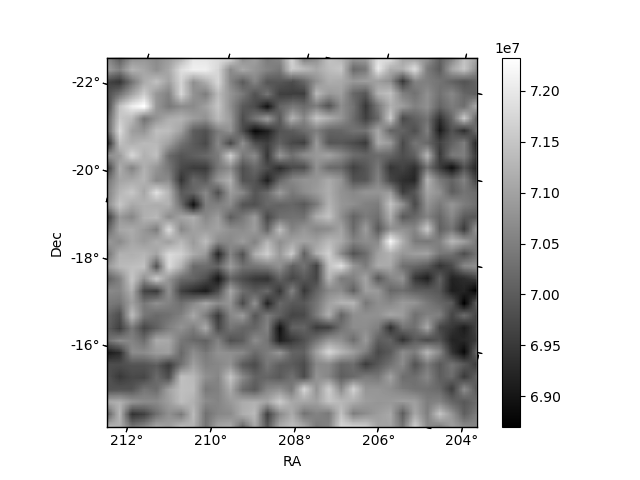
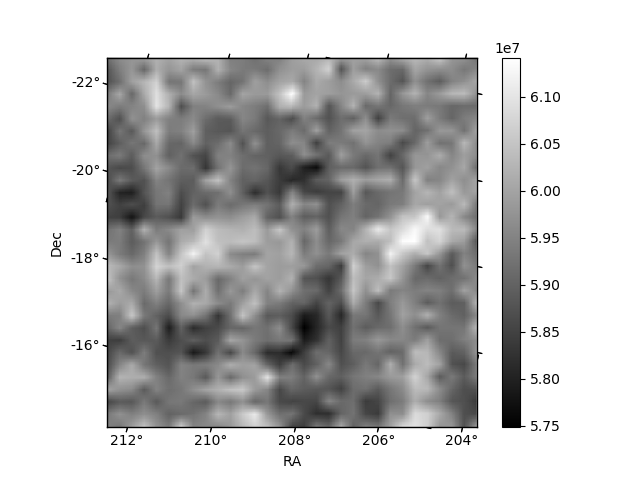
Histogram calculated using DETX and DETY for each event in the final _common_clean file
| Quadrant A | 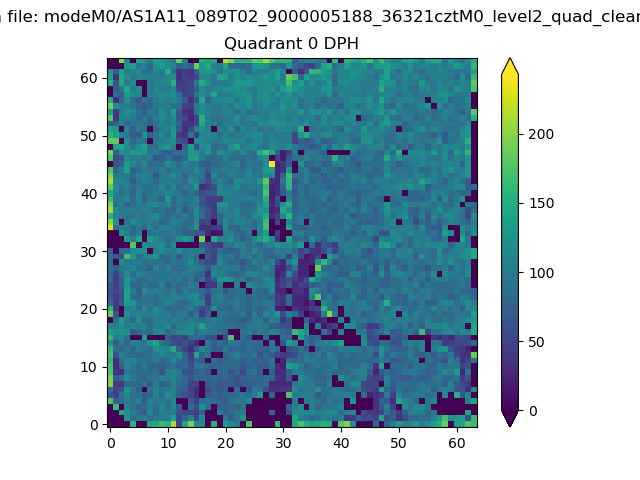 |
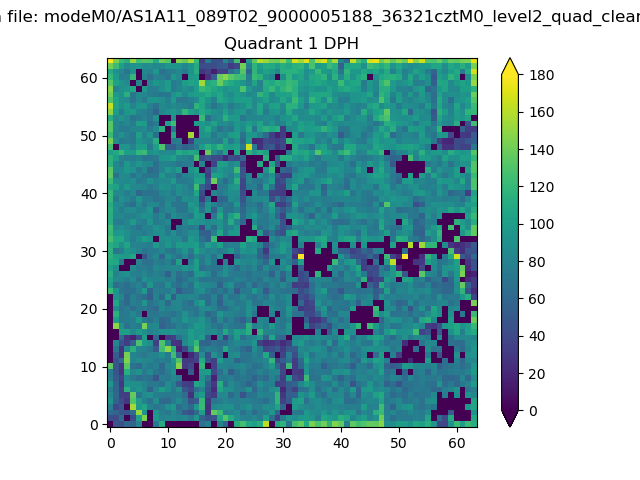 |
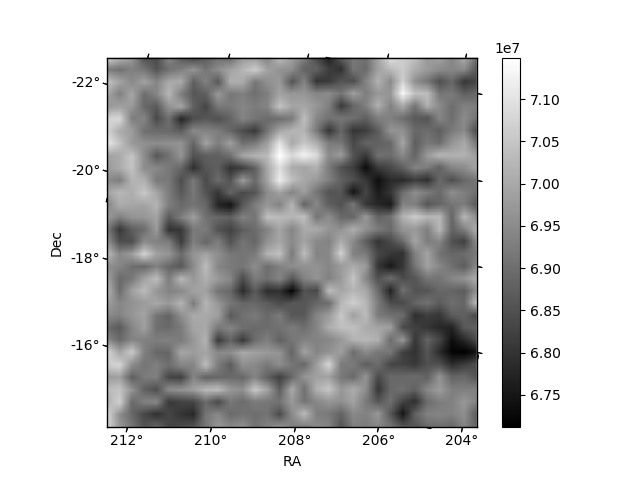
Quadrant B |
|---|---|---|---|
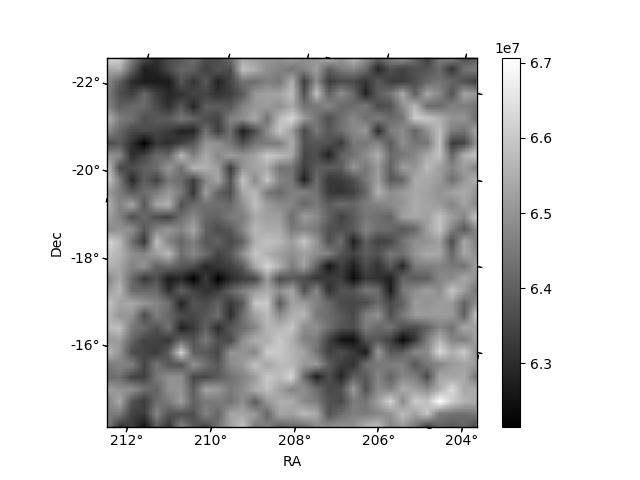
| Quadrant D | 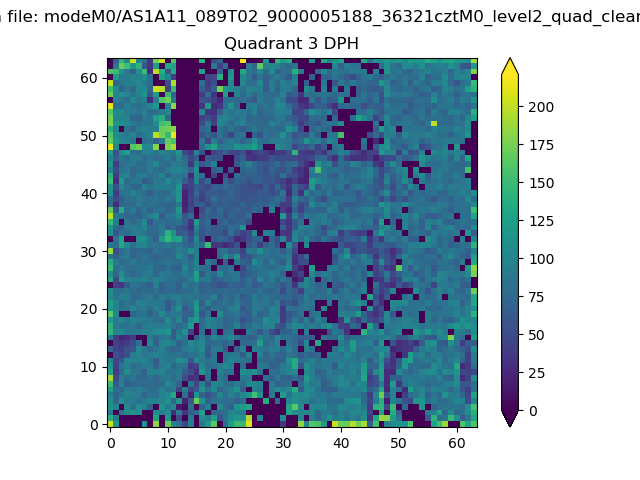 |
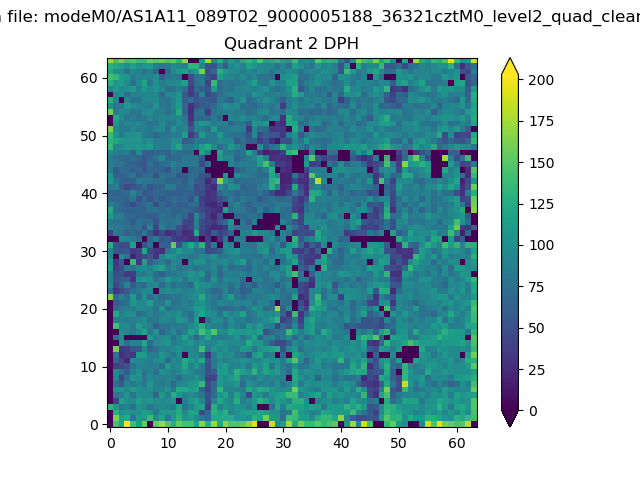 |
Quadrant C |
| Plot type | Count rate plots | Images |
|---|---|---|
| Comparison with Poisson distribution Blue bars denote a histogram of data divided into 1 sec bins. Red curve is a Poisson curve with rate = median count rate of data. |
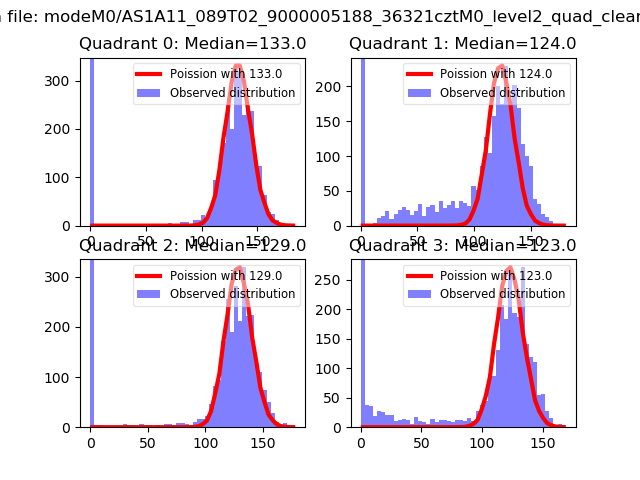 |
 |
| Quadrant-wise count rates Data is divided into 100 sec bins |
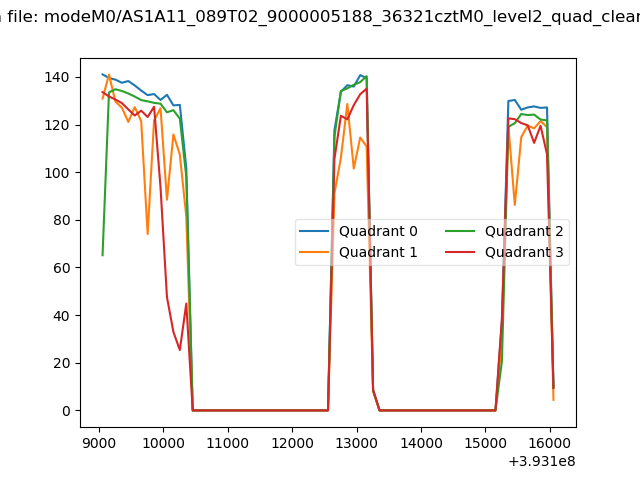 |
|
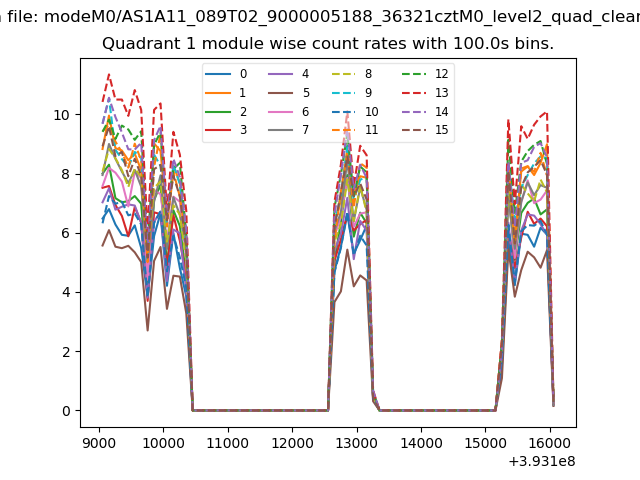
| Module-wise count rates for Quadrant A Data is divided into 100 sec bins |
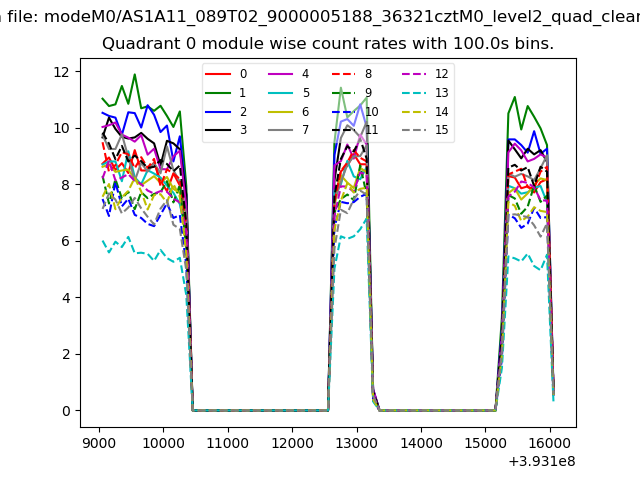 |
 |
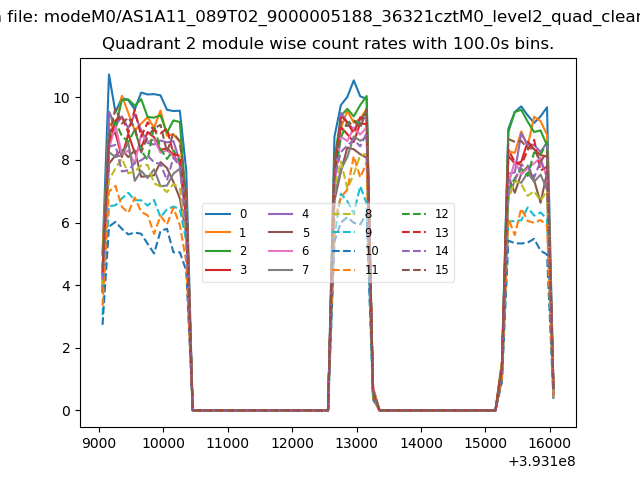
| Module-wise count rates for Quadrant B Data is divided into 100 sec bins |
 |
 |
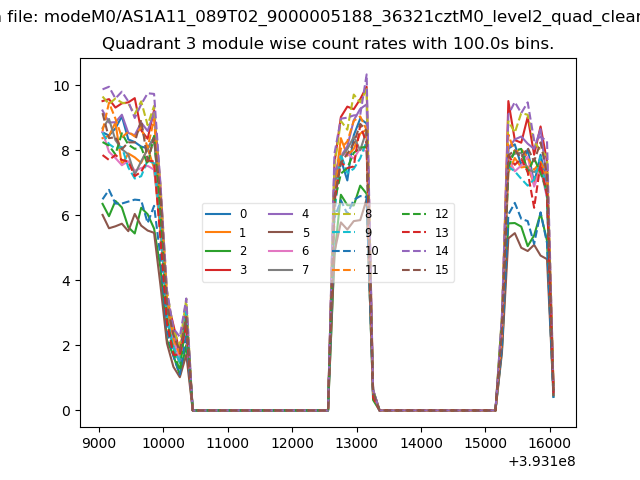
| Module-wise count rates for Quadrant C Data is divided into 100 sec bins |
 |
 |
| Module-wise count rates for Quadrant D Data is divided into 100 sec bins |
 |
 |
| Parameter | Plot |
|---|---|
| CZT HV Monitor | 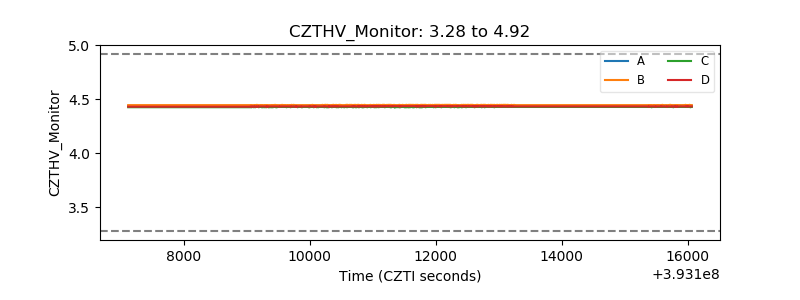 |
| D_VDD | 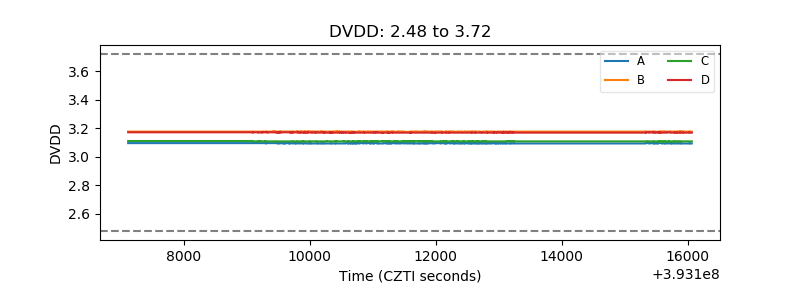 |
| Temperature 1 | 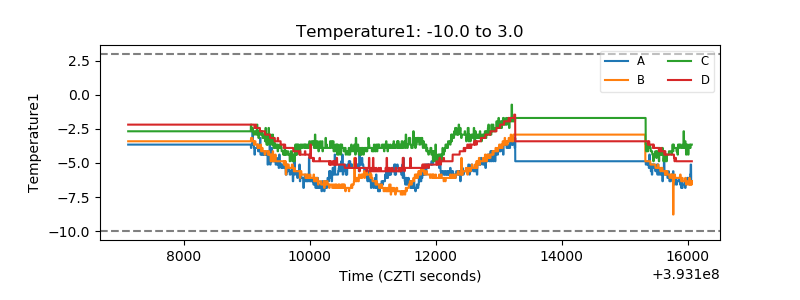 |
| Veto HV Monitor |  |
| Veto LLD | 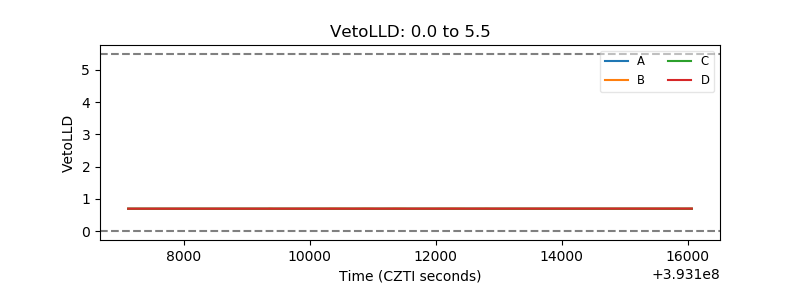 |
| Alpha Counter | 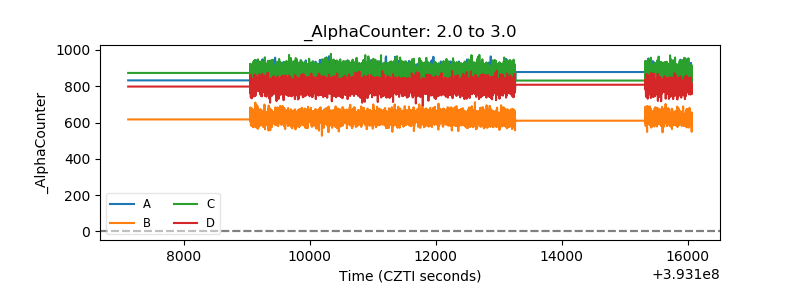 |
| _CPM_Rate | 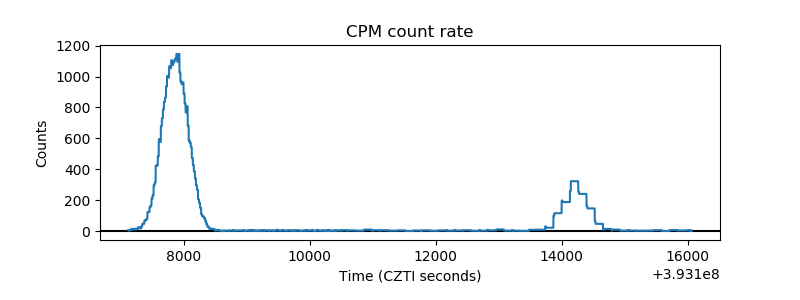 |
| CZT Counter | 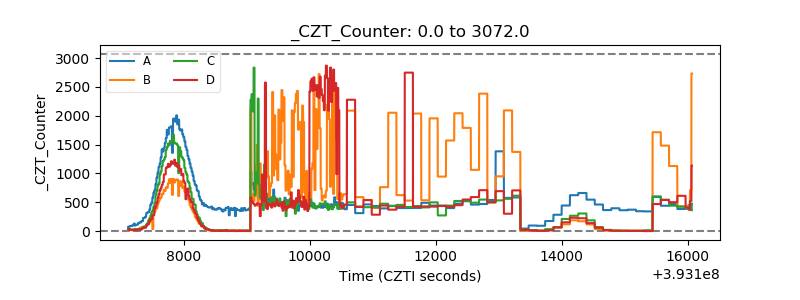 |
| +2.5 Volts monitor | 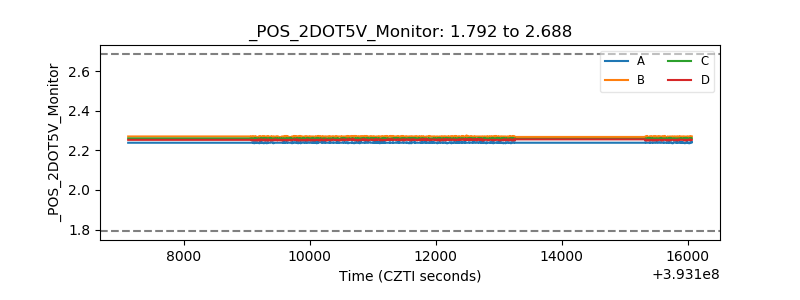 |
| +5 Volts monitor | 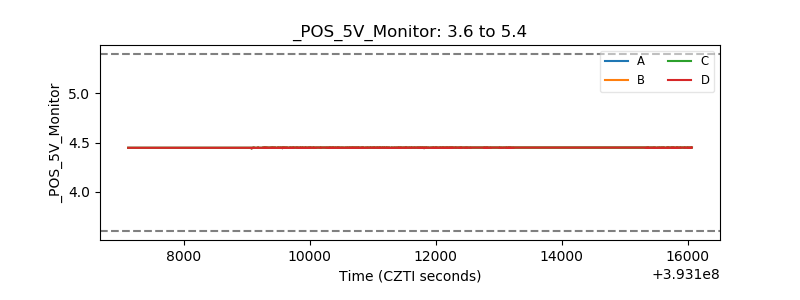 |
| _ROLL_ROT | 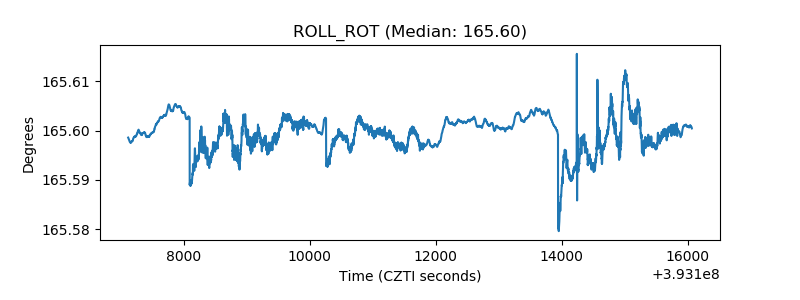 |
| _Roll_DEC | 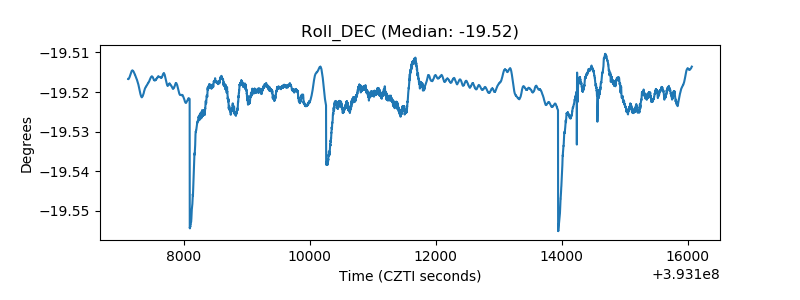 |
| _Roll_RA | 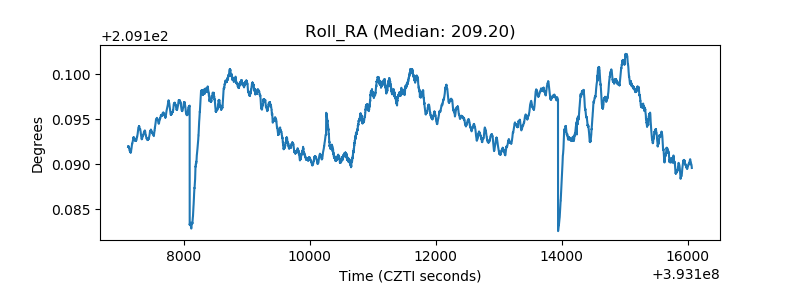 |
| Veto Counter | 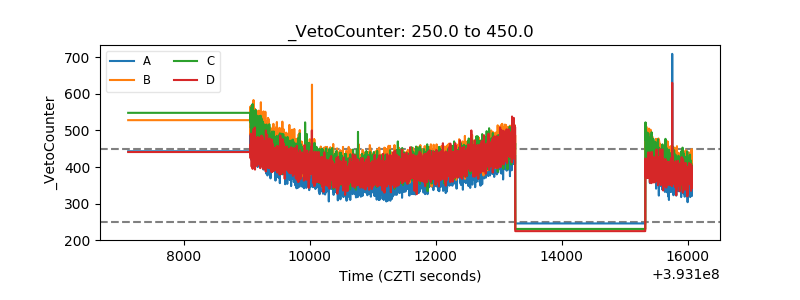 |