| Param | Original file | Final file |
|---|---|---|
| Filename | modeM0/AS1A11_089T02_9000005188_36320cztM0_level2.evt | modeM0/AS1A11_089T02_9000005188_36320cztM0_level2_quad_clean.evt |
| Size (bytes) | 452,839,680 | 58,291,200 |
| Size | 431.9 MB | 55.6 MB |
| Events in quadrant A | 2,517,015 | 377,169 |
| Events in quadrant B | 4,907,500 | 347,560 |
| Events in quadrant C | 2,716,474 | 350,395 |
| Events in quadrant D | 3,240,540 | 345,868 |
| Mode M9 | |||
|---|---|---|---|
| Quadrant | BADHDUFLAG | Total packets | Discarded packets |
| A | 0 | 31 | 0 |
| B | 0 | 31 | 0 |
| C | 0 | 31 | 0 |
| D | 0 | 32 | 0 |
| Mode M0 | |||
|---|---|---|---|
| Quadrant | BADHDUFLAG | Total packets | Discarded packets |
| A | 0 | 10532 | 3 |
| B | 0 | 17873 | 7 |
| C | 0 | 11040 | 2 |
| D | 0 | 12849 | 2 |
| Mode SS | |||
|---|---|---|---|
| Quadrant | BADHDUFLAG | Total packets | Discarded packets |
| A | 0 | 100 | 0 |
| B | 0 | 100 | 0 |
| C | 0 | 100 | 0 |
| D | 0 | 100 | 0 |
| Quadrant | Total seconds | Saturated seconds | Saturation percentage |
|---|---|---|---|
| A | 4898 | 7 | 0.142915% |
| B | 4896 | 836 | 17.075163% |
| C | 4898 | 139 | 2.837893% |
| D | 4898 | 199 | 4.062883% |
Noise dominated data is calculated using 1-second bins in cleaned event files. If a bin has >2000 counts, and if more than 50% of those come from <1% of pixels, then it is considered to be noise-dominated and hence unusable.
| Quadrant | # 1 sec bins | Bins with >0 counts | Bins with >2000 counts | High rate bins dominated by noise | Noise dominated (total time) | Noise dominated (detector-on time) | Marked lightcurve |
|---|---|---|---|---|---|---|---|
| A | 7051 | 4899 | 2 | 2 | 0.03% | 0.04% | 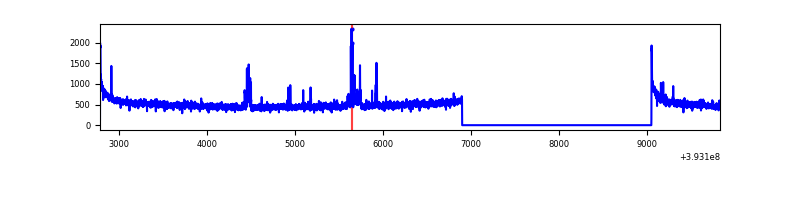 |
| B | 7051 | 4897 | 742 | 742 | 10.52% | 15.15% | 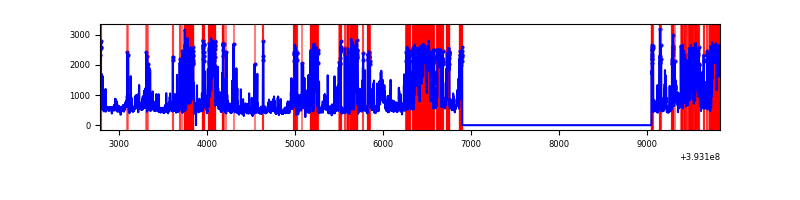 |
| C | 7051 | 4899 | 120 | 120 | 1.70% | 2.45% | 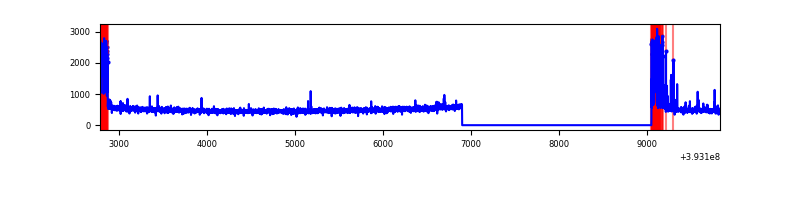 |
| D | 7051 | 4899 | 189 | 189 | 2.68% | 3.86% | 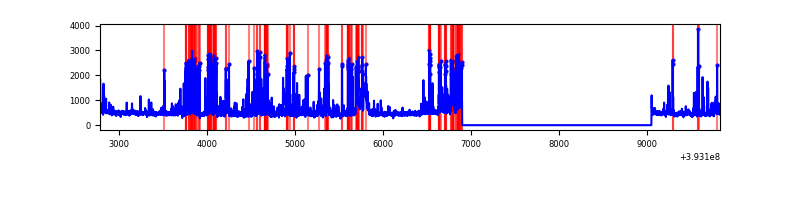 |
Top three noisy pixels from each quadrant. If the there are fewer than three noisy pixels in the level2.evt file, extra rows are filled as -1
| Pixel properties | Quadrant properties | ||||||
|---|---|---|---|---|---|---|---|
| Quadrant | DetID | PixID | Counts | Sigma | Mean | Median | Sigma |
| A | 10 | 83 | 184365 | 1588.77 | 579 | 569 | 115.7 |
| A | 12 | 189 | 66142 | 566.83 | 579 | 569 | 115.7 |
| A | 13 | 6 | 9066 | 73.45 | 579 | 569 | 115.7 |
| B | 5 | 172 | 1517818 | 15146.72 | 530 | 518 | 100.2 |
| B | 4 | 171 | 752791 | 7509.7 | 530 | 518 | 100.2 |
| B | 5 | 236 | 365466 | 3643.16 | 530 | 518 | 100.2 |
| C | 0 | 10 | 381808 | 3004.35 | 544 | 547 | 126.9 |
| C | 15 | 214 | 203881 | 1602.28 | 544 | 547 | 126.9 |
| C | 0 | 207 | 5481 | 38.88 | 544 | 547 | 126.9 |
| D | 12 | 6 | 551050 | 4107.56 | 544 | 528 | 134.0 |
| D | 2 | 250 | 196114 | 1459.31 | 544 | 528 | 134.0 |
| D | 13 | 171 | 175355 | 1304.42 | 544 | 528 | 134.0 |
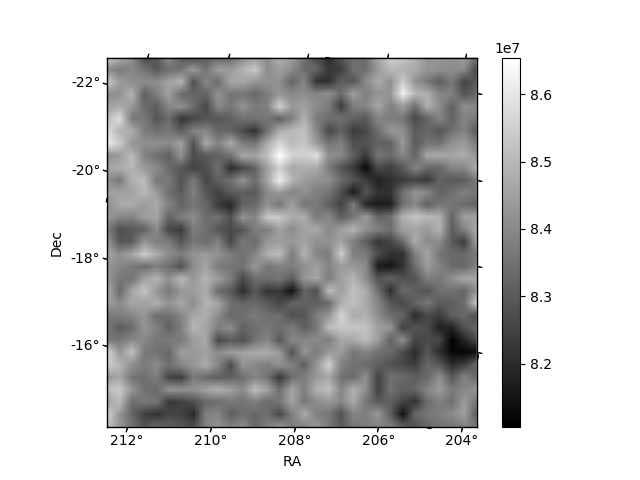
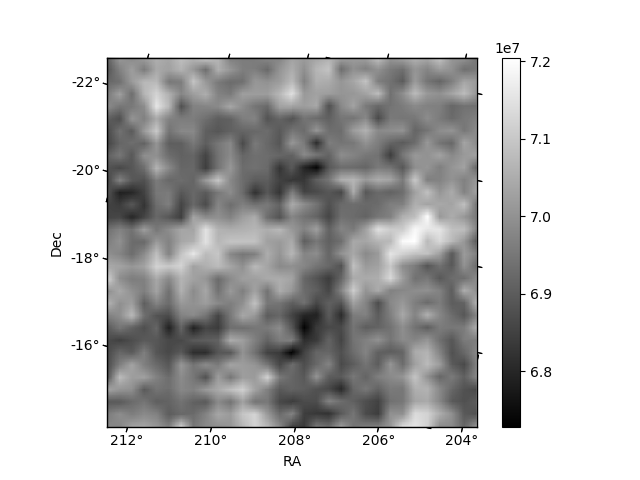
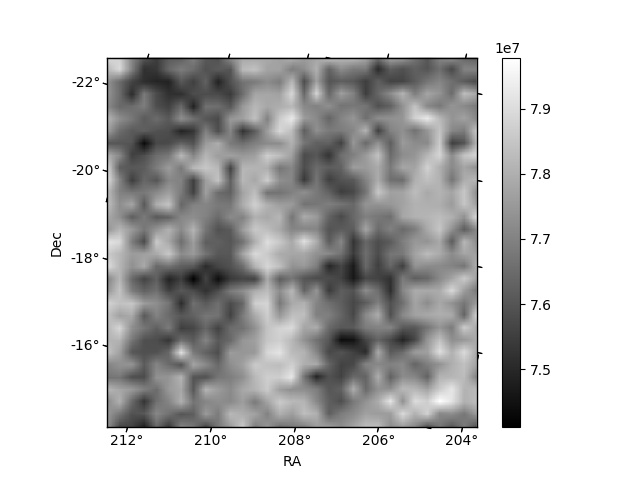
Histogram calculated using DETX and DETY for each event in the final _common_clean file
| Quadrant A | 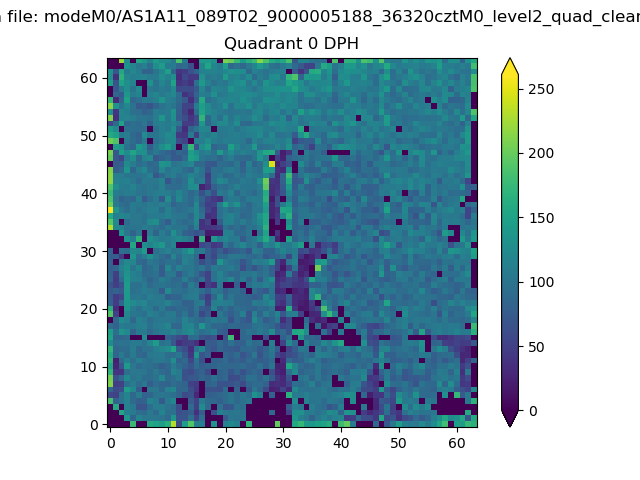 |
 |
Quadrant B |
|---|---|---|---|
| Quadrant D | 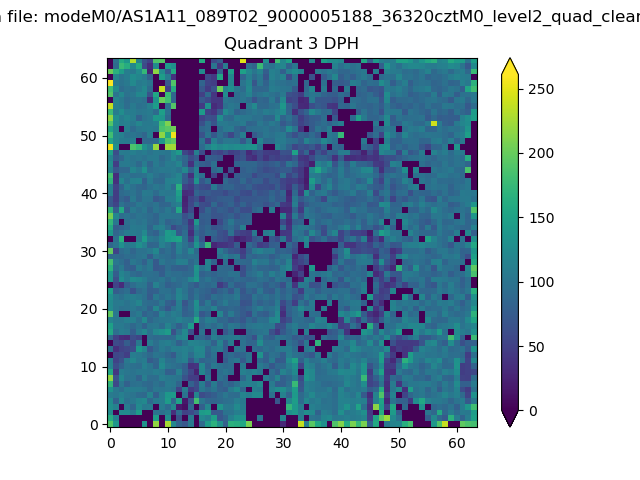 |
 |
Quadrant C |
| Plot type | Count rate plots | Images |
|---|---|---|
| Comparison with Poisson distribution Blue bars denote a histogram of data divided into 1 sec bins. Red curve is a Poisson curve with rate = median count rate of data. |
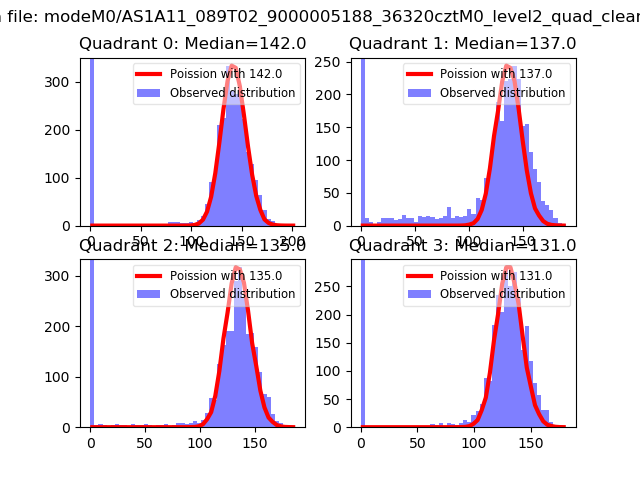 |
 |
| Quadrant-wise count rates Data is divided into 100 sec bins |
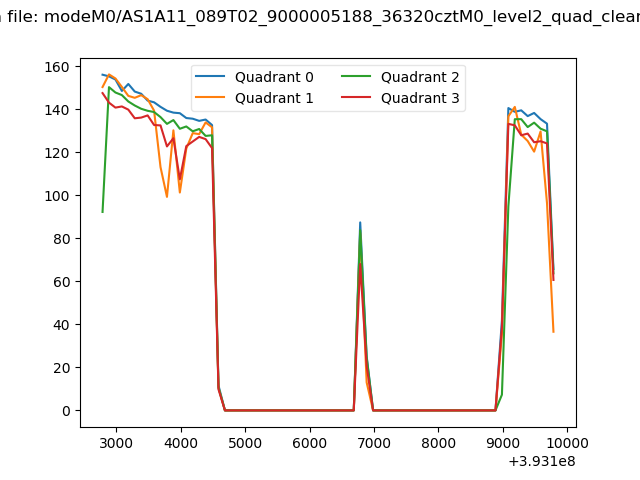 |
|
| Module-wise count rates for Quadrant A Data is divided into 100 sec bins |
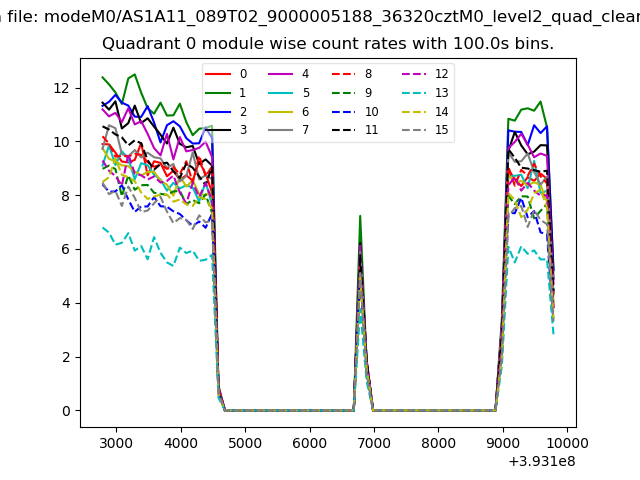 |
 |
| Module-wise count rates for Quadrant B Data is divided into 100 sec bins |
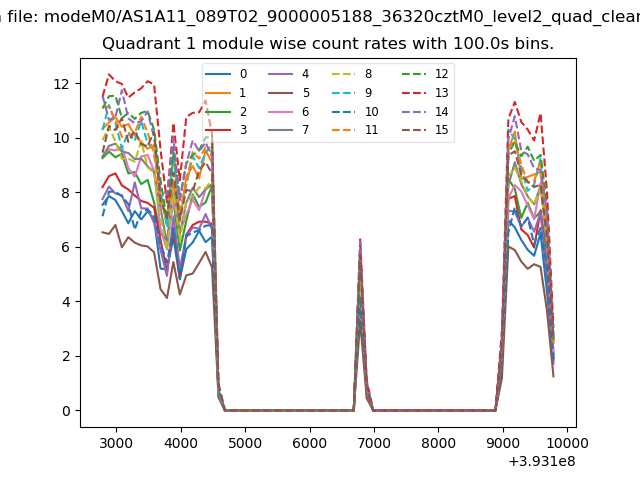 |
 |
| Module-wise count rates for Quadrant C Data is divided into 100 sec bins |
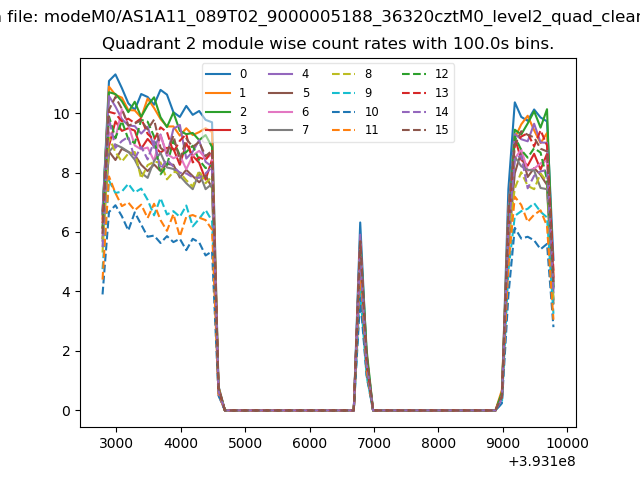 |
 |
| Module-wise count rates for Quadrant D Data is divided into 100 sec bins |
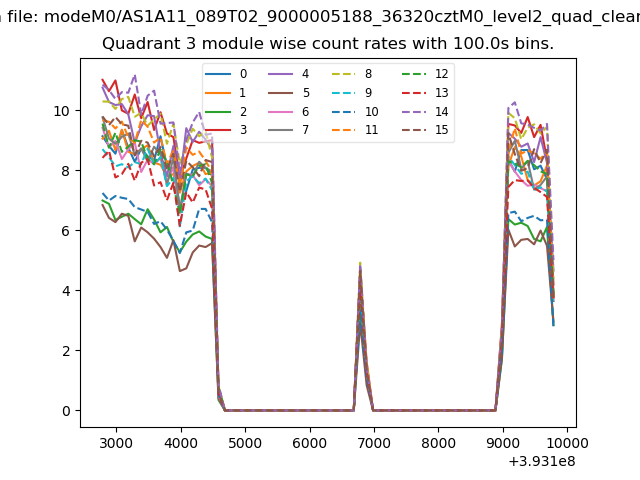 |
 |
| Parameter | Plot |
|---|---|
| CZT HV Monitor | 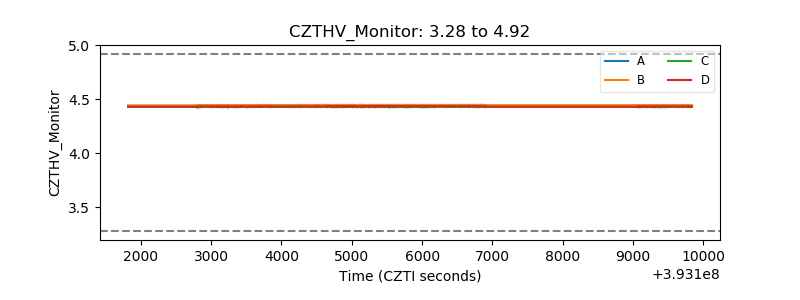 |
| D_VDD | 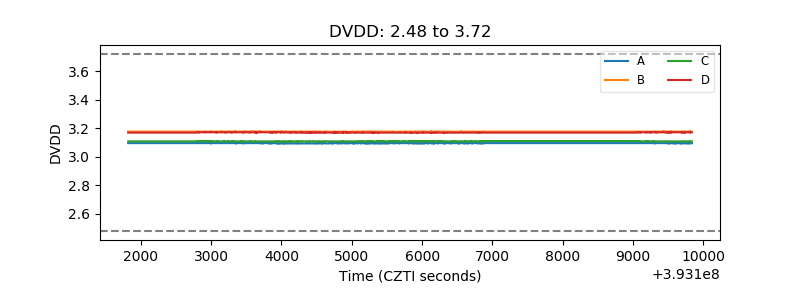 |
| Temperature 1 | 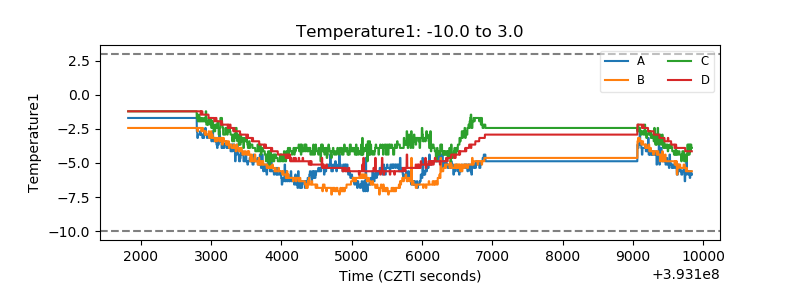 |
| Veto HV Monitor | 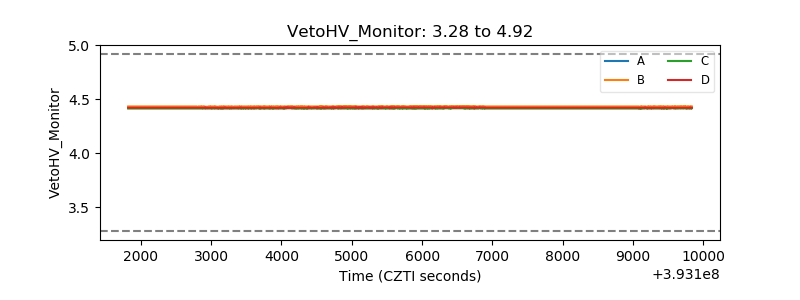 |
| Veto LLD | 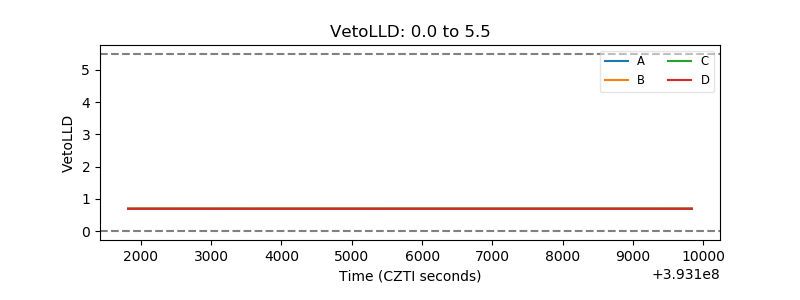 |
| Alpha Counter | 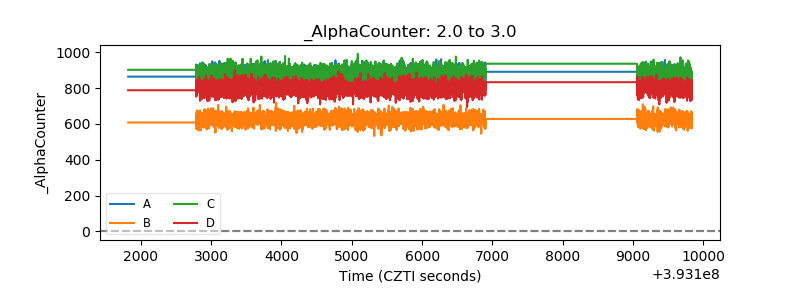 |
| _CPM_Rate | 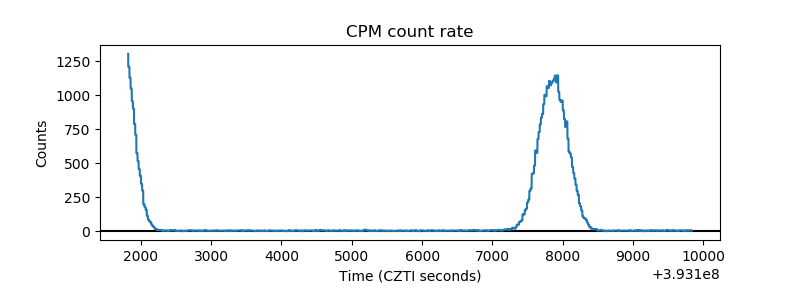 |
| CZT Counter | 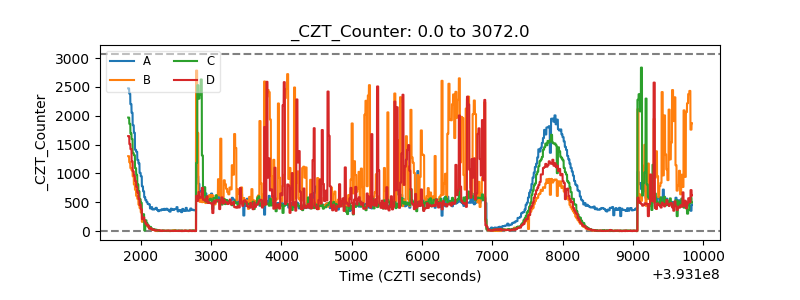 |
| +2.5 Volts monitor |  |
| +5 Volts monitor | 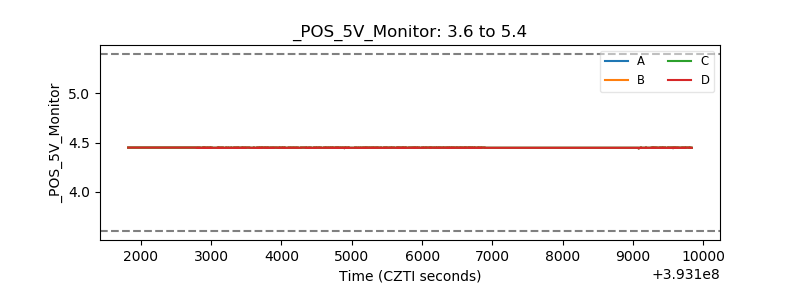 |
| _ROLL_ROT | 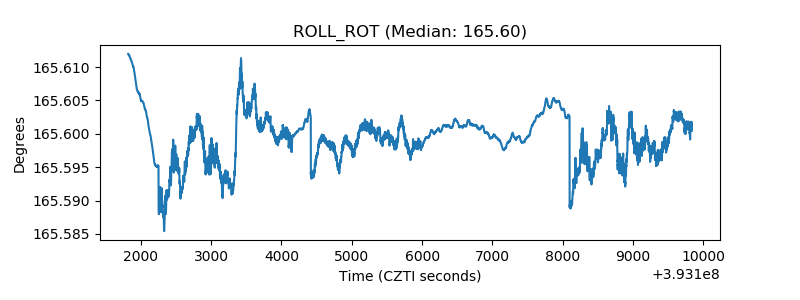 |
| _Roll_DEC | 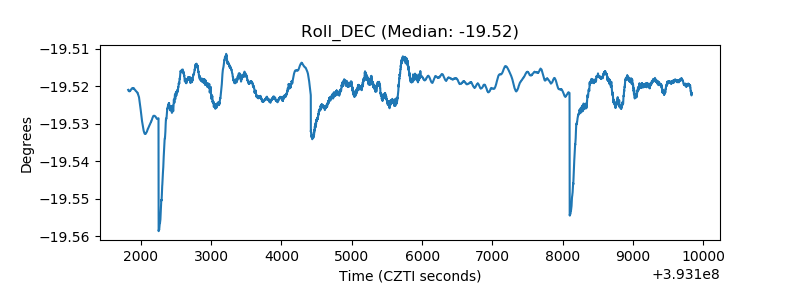 |
| _Roll_RA | 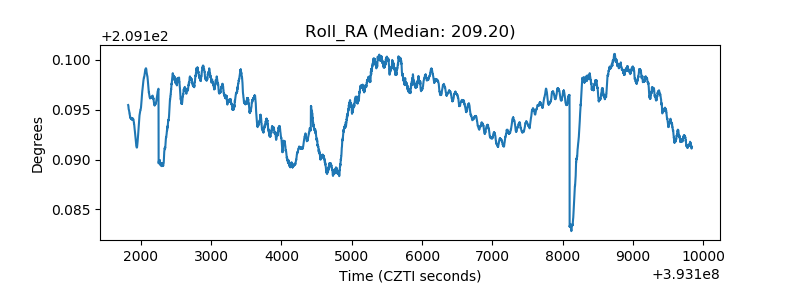 |
| Veto Counter | 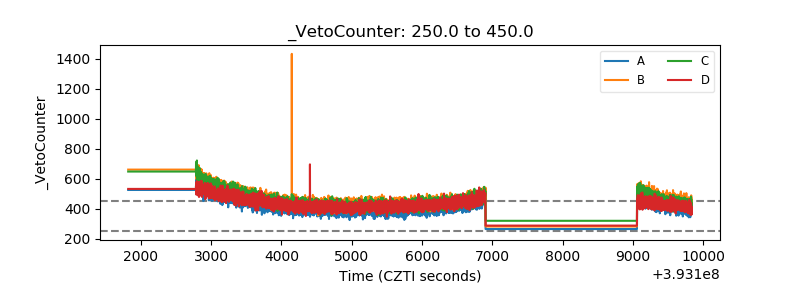 |