| Param | Original file | Final file |
|---|---|---|
| Filename | modeM0/AS1A11_089T02_9000005188_36319cztM0_level2.evt | modeM0/AS1A11_089T02_9000005188_36319cztM0_level2_quad_clean.evt |
| Size (bytes) | 467,303,040 | 68,906,880 |
| Size | 445.7 MB | 65.7 MB |
| Events in quadrant A | 2,592,406 | 462,701 |
| Events in quadrant B | 4,792,413 | 418,257 |
| Events in quadrant C | 2,898,544 | 431,435 |
| Events in quadrant D | 3,528,375 | 422,049 |
| Mode M9 | |||
|---|---|---|---|
| Quadrant | BADHDUFLAG | Total packets | Discarded packets |
| A | 0 | 29 | 0 |
| B | 0 | 29 | 0 |
| C | 0 | 29 | 0 |
| D | 0 | 30 | 0 |
| Mode M0 | |||
|---|---|---|---|
| Quadrant | BADHDUFLAG | Total packets | Discarded packets |
| A | 0 | 10758 | 3 |
| B | 0 | 17586 | 2 |
| C | 0 | 11562 | 2 |
| D | 0 | 13704 | 2 |
| Mode SS | |||
|---|---|---|---|
| Quadrant | BADHDUFLAG | Total packets | Discarded packets |
| A | 0 | 104 | 0 |
| B | 0 | 104 | 0 |
| C | 0 | 104 | 0 |
| D | 0 | 104 | 0 |
| Quadrant | Total seconds | Saturated seconds | Saturation percentage |
|---|---|---|---|
| A | 5012 | 12 | 0.239425% |
| B | 5012 | 632 | 12.609737% |
| C | 5012 | 140 | 2.793296% |
| D | 5012 | 165 | 3.292099% |
Noise dominated data is calculated using 1-second bins in cleaned event files. If a bin has >2000 counts, and if more than 50% of those come from <1% of pixels, then it is considered to be noise-dominated and hence unusable.
| Quadrant | # 1 sec bins | Bins with >0 counts | Bins with >2000 counts | High rate bins dominated by noise | Noise dominated (total time) | Noise dominated (detector-on time) | Marked lightcurve |
|---|---|---|---|---|---|---|---|
| A | 7134 | 5013 | 1 | 1 | 0.01% | 0.02% | 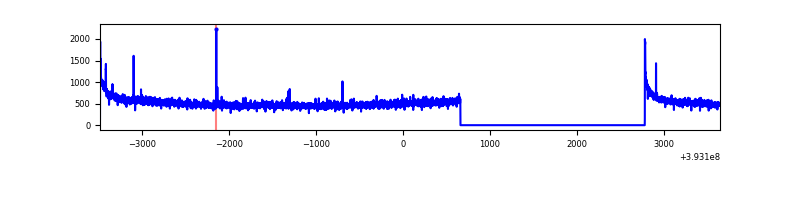 |
| B | 7134 | 5013 | 538 | 538 | 7.54% | 10.73% | 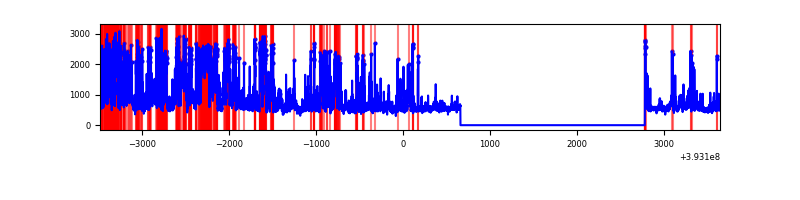 |
| C | 7134 | 5013 | 123 | 123 | 1.72% | 2.45% | 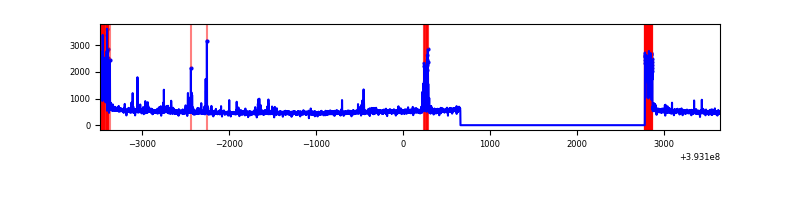 |
| D | 7134 | 5013 | 198 | 198 | 2.78% | 3.95% | 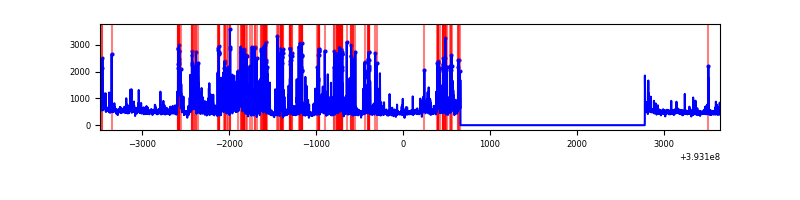 |
Top three noisy pixels from each quadrant. If the there are fewer than three noisy pixels in the level2.evt file, extra rows are filled as -1
| Pixel properties | Quadrant properties | ||||||
|---|---|---|---|---|---|---|---|
| Quadrant | DetID | PixID | Counts | Sigma | Mean | Median | Sigma |
| A | 10 | 83 | 188352 | 1536.9 | 614 | 606 | 122.2 |
| A | 9 | 143 | 9894 | 76.03 | 614 | 606 | 122.2 |
| A | 13 | 6 | 9362 | 71.68 | 614 | 606 | 122.2 |
| B | 4 | 171 | 832673 | 7657.84 | 575 | 563 | 108.7 |
| B | 5 | 172 | 784739 | 7216.7 | 575 | 563 | 108.7 |
| B | 5 | 236 | 551687 | 5071.95 | 575 | 563 | 108.7 |
| C | 0 | 10 | 323730 | 2415.32 | 575 | 581 | 133.8 |
| C | 15 | 214 | 210922 | 1572.16 | 575 | 581 | 133.8 |
| C | 0 | 207 | 118297 | 879.85 | 575 | 581 | 133.8 |
| D | 12 | 6 | 763535 | 5359.24 | 579 | 564 | 142.4 |
| D | 12 | 233 | 191777 | 1343.11 | 579 | 564 | 142.4 |
| D | 2 | 250 | 89193 | 622.54 | 579 | 564 | 142.4 |
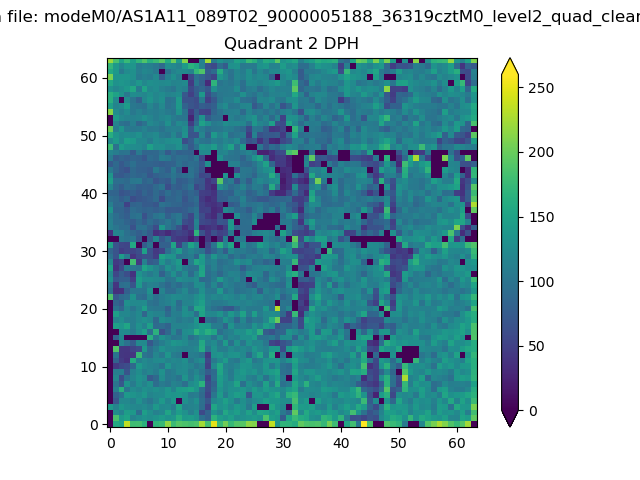
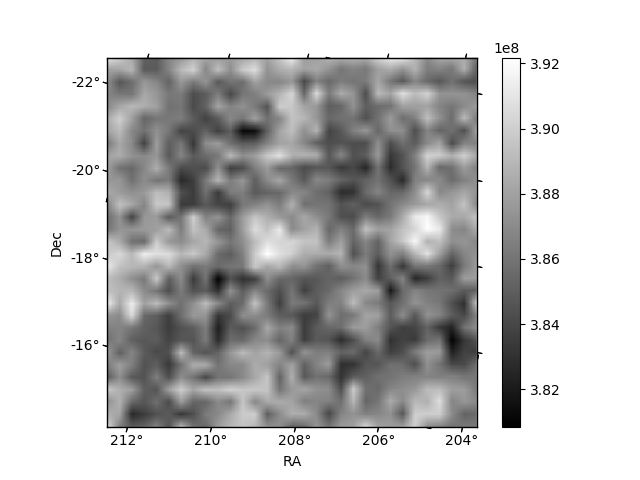
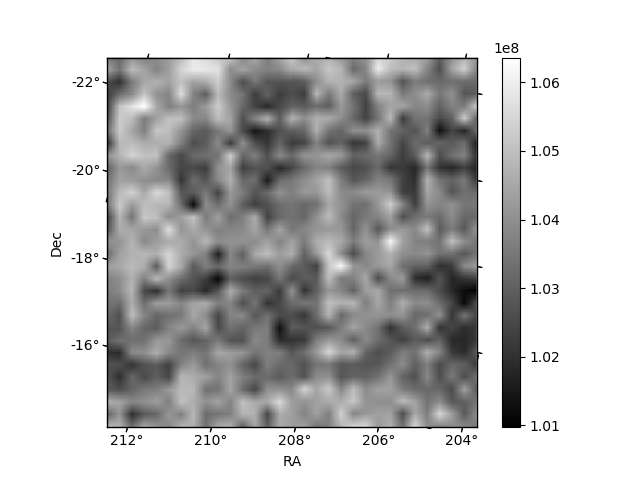
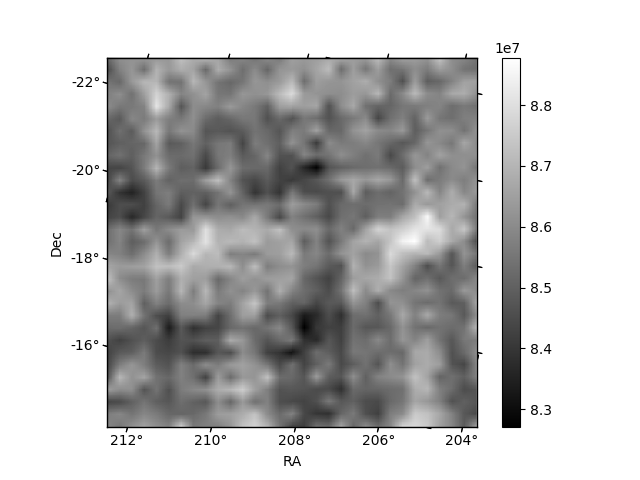
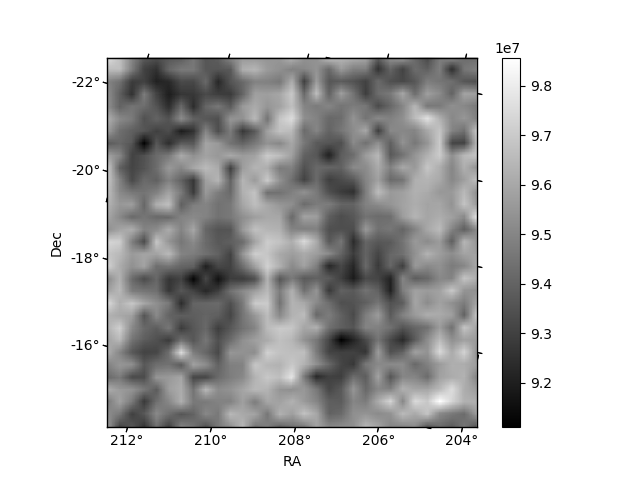
Histogram calculated using DETX and DETY for each event in the final _common_clean file
| Quadrant A | 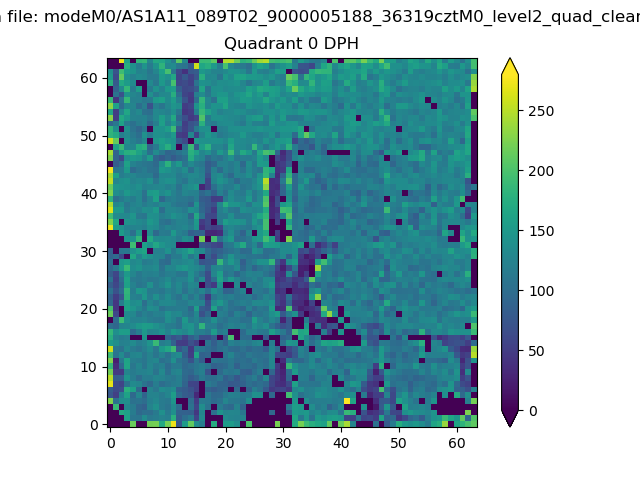 |
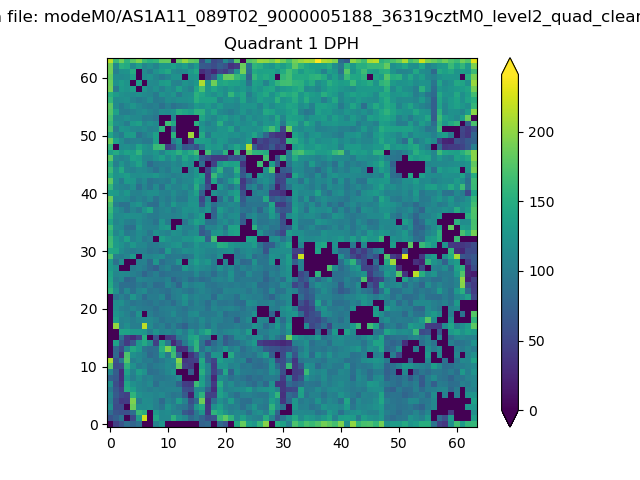 |
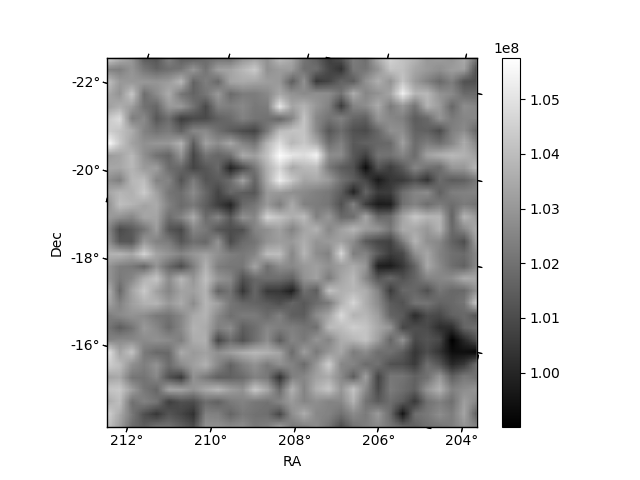
Quadrant B |
|---|---|---|---|
| Quadrant D | 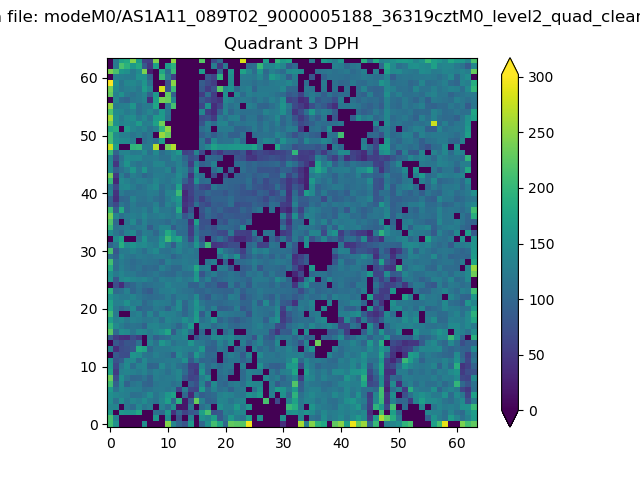 |
 |
Quadrant C |
| Plot type | Count rate plots | Images |
|---|---|---|
| Comparison with Poisson distribution Blue bars denote a histogram of data divided into 1 sec bins. Red curve is a Poisson curve with rate = median count rate of data. |
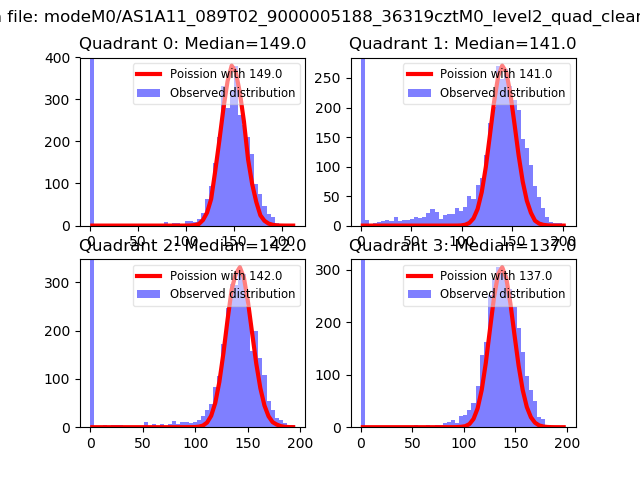 |
 |
| Quadrant-wise count rates Data is divided into 100 sec bins |
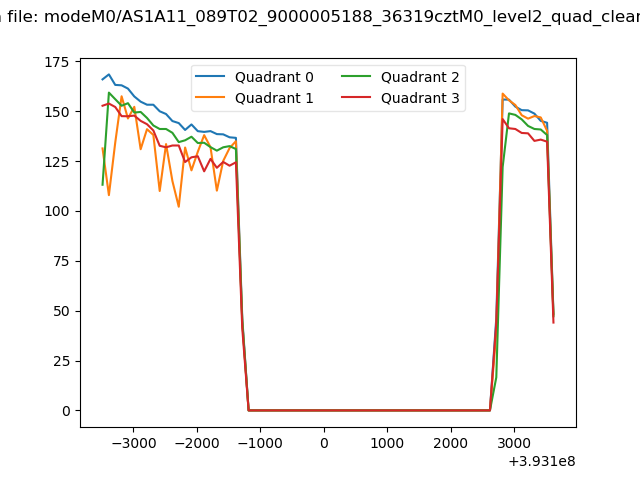 |
|
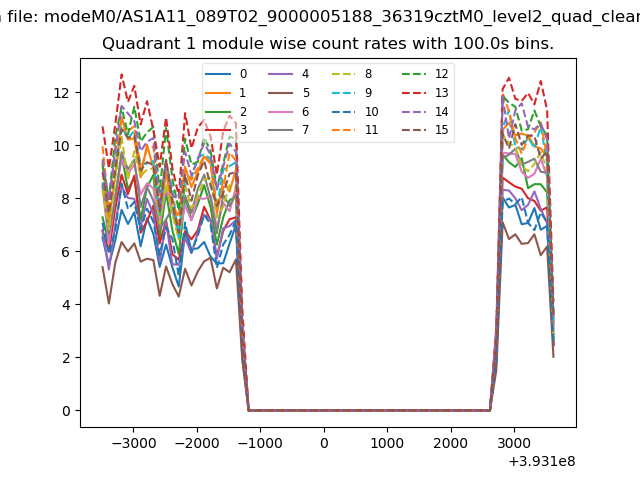
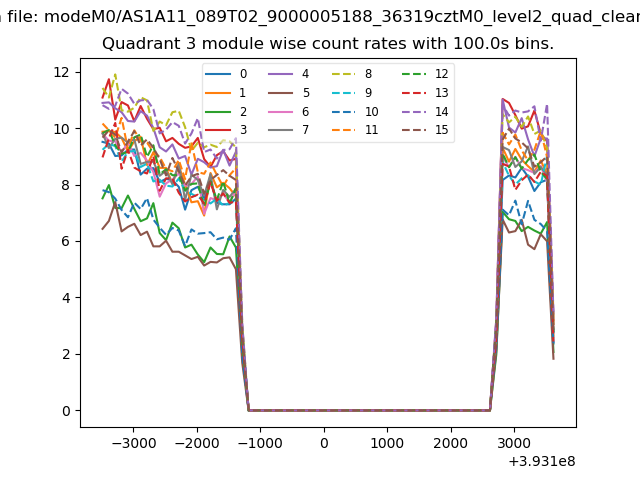
| Module-wise count rates for Quadrant A Data is divided into 100 sec bins |
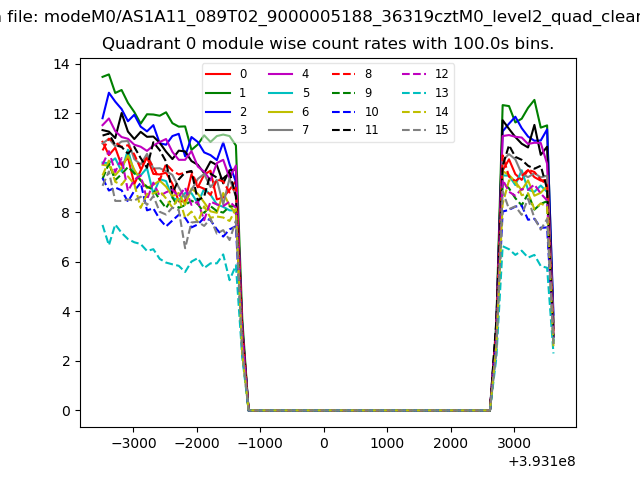 |
 |
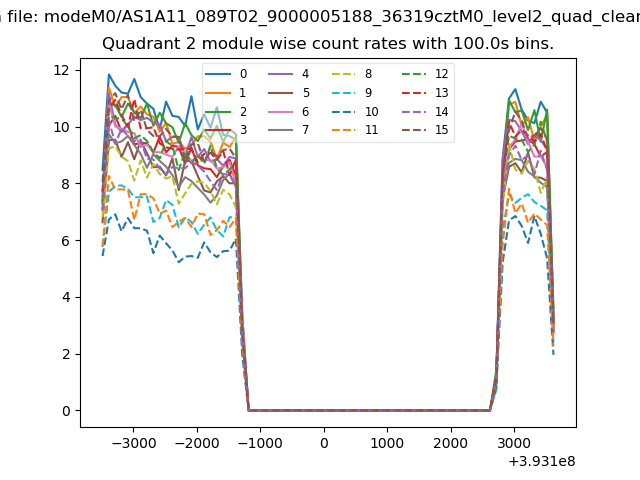
| Module-wise count rates for Quadrant B Data is divided into 100 sec bins |
 |
 |
| Module-wise count rates for Quadrant C Data is divided into 100 sec bins |
 |
 |
| Module-wise count rates for Quadrant D Data is divided into 100 sec bins |
 |
 |
| Parameter | Plot |
|---|---|
| CZT HV Monitor | 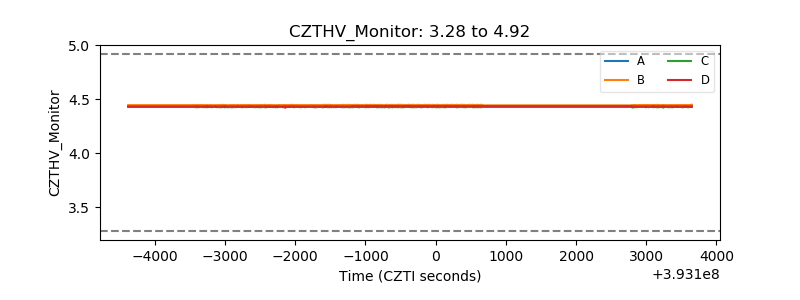 |
| D_VDD | 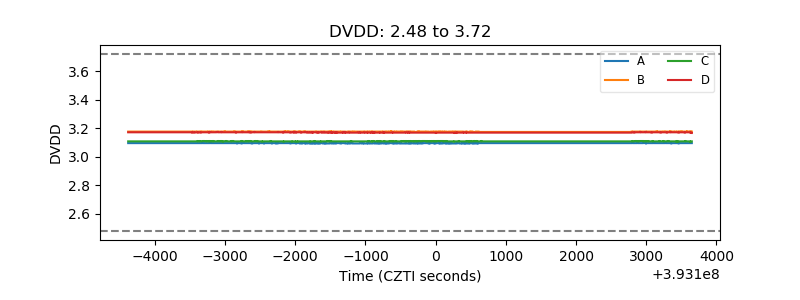 |
| Temperature 1 | 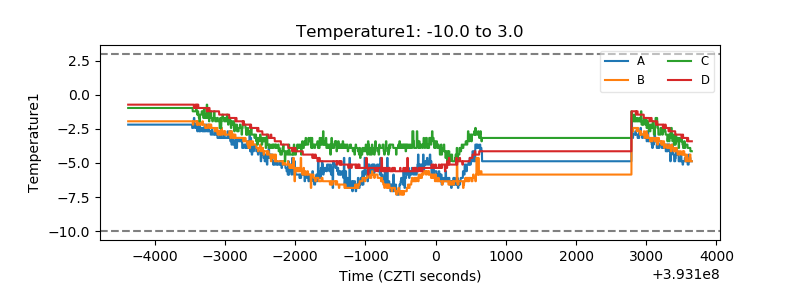 |
| Veto HV Monitor | 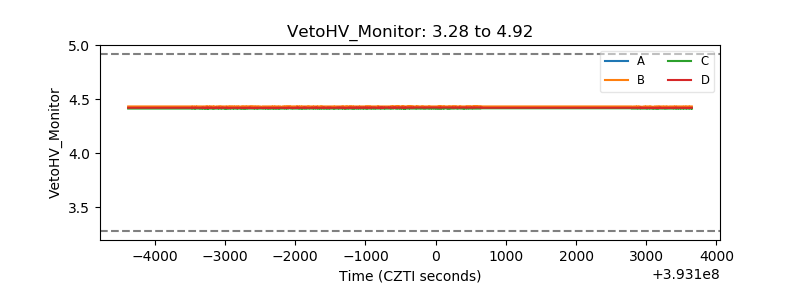 |
| Veto LLD | 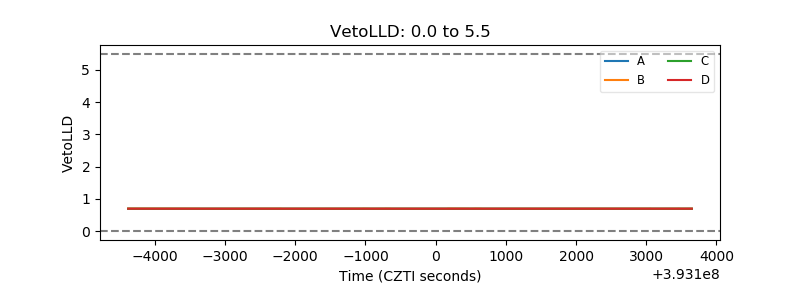 |
| Alpha Counter | 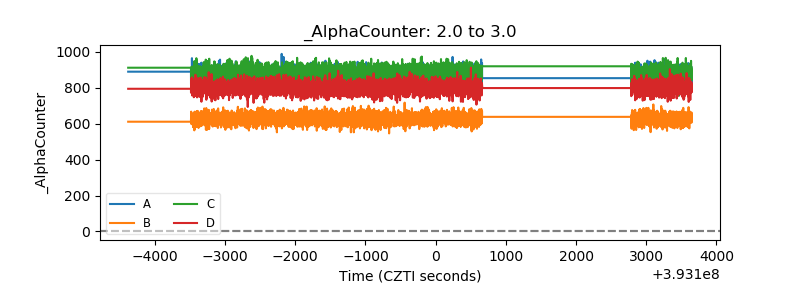 |
| _CPM_Rate | 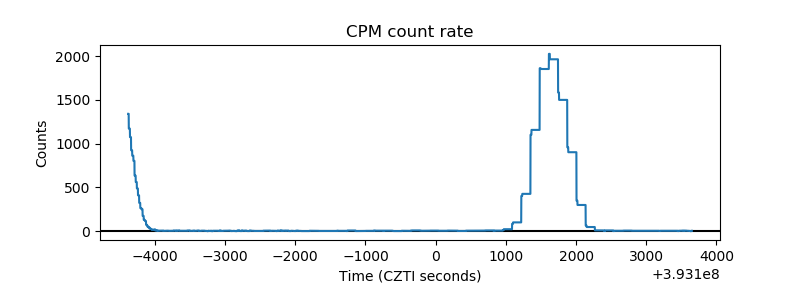 |
| CZT Counter | 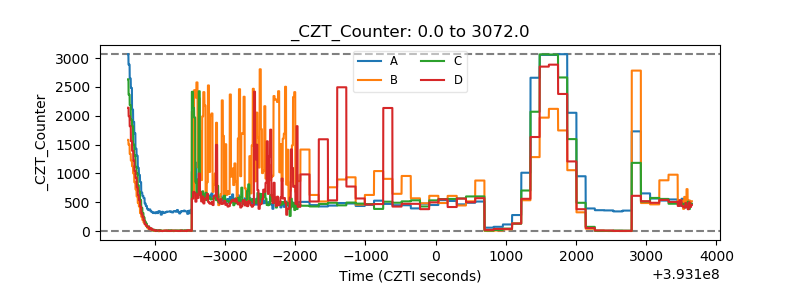 |
| +2.5 Volts monitor |  |
| +5 Volts monitor | 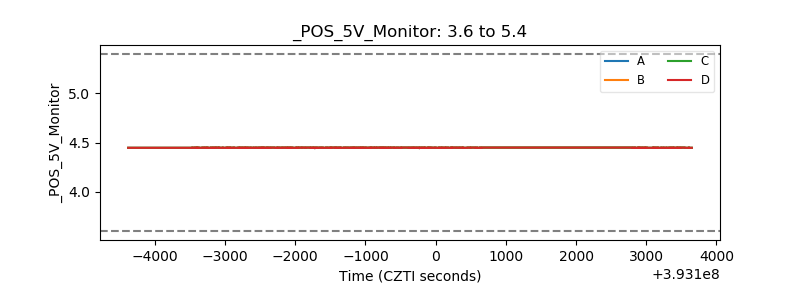 |
| _ROLL_ROT | 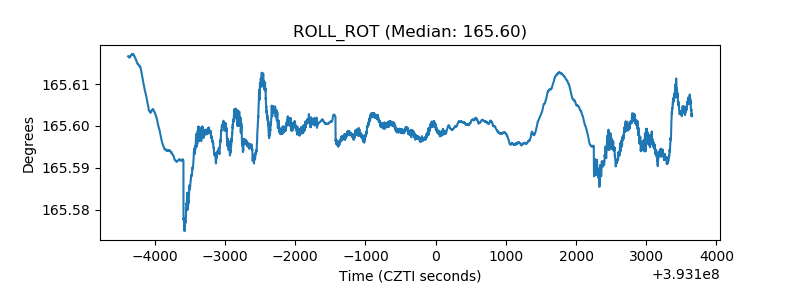 |
| _Roll_DEC | 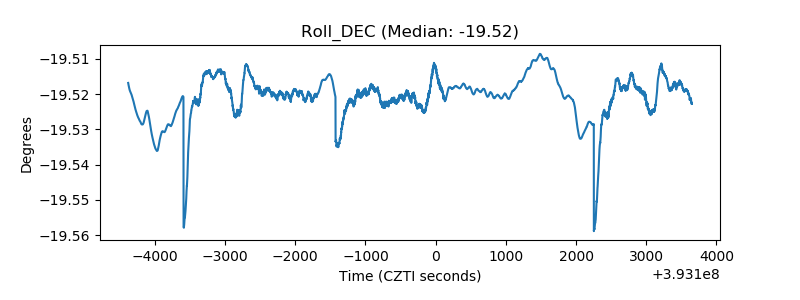 |
| _Roll_RA | 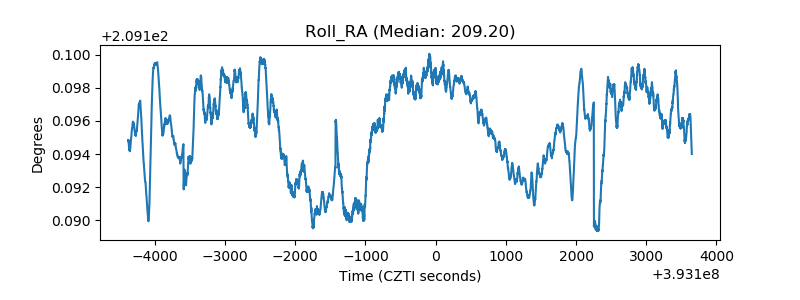 |
| Veto Counter | 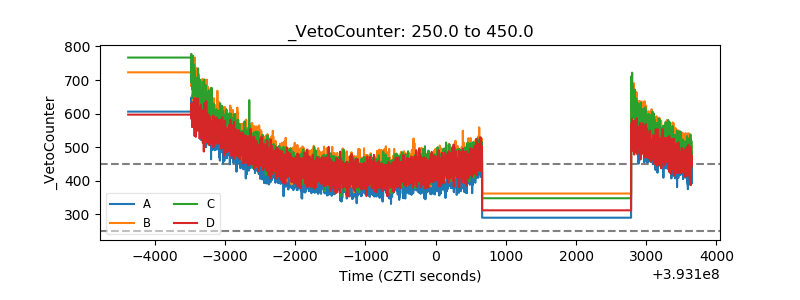 |