| Param | Original file | Final file |
|---|---|---|
| Filename | modeM0/AS1A11_089T02_9000005188_36318cztM0_level2.evt | modeM0/AS1A11_089T02_9000005188_36318cztM0_level2_quad_clean.evt |
| Size (bytes) | 545,564,160 | 77,224,320 |
| Size | 520.3 MB | 73.6 MB |
| Events in quadrant A | 2,700,839 | 540,124 |
| Events in quadrant B | 6,504,339 | 459,860 |
| Events in quadrant C | 3,025,763 | 503,438 |
| Events in quadrant D | 3,942,223 | 473,368 |
| Mode M9 | |||
|---|---|---|---|
| Quadrant | BADHDUFLAG | Total packets | Discarded packets |
| A | 0 | 28 | 0 |
| B | 0 | 28 | 0 |
| C | 0 | 28 | 0 |
| D | 0 | 29 | 0 |
| Mode M0 | |||
|---|---|---|---|
| Quadrant | BADHDUFLAG | Total packets | Discarded packets |
| A | 0 | 11180 | 3 |
| B | 0 | 22805 | 2 |
| C | 0 | 12004 | 2 |
| D | 0 | 15031 | 2 |
| Mode SS | |||
|---|---|---|---|
| Quadrant | BADHDUFLAG | Total packets | Discarded packets |
| A | 0 | 106 | 0 |
| B | 0 | 106 | 0 |
| C | 0 | 106 | 0 |
| D | 0 | 106 | 0 |
| Quadrant | Total seconds | Saturated seconds | Saturation percentage |
|---|---|---|---|
| A | 5149 | 9 | 0.174791% |
| B | 5149 | 1453 | 28.219072% |
| C | 5149 | 98 | 1.903282% |
| D | 5149 | 400 | 7.768499% |
Noise dominated data is calculated using 1-second bins in cleaned event files. If a bin has >2000 counts, and if more than 50% of those come from <1% of pixels, then it is considered to be noise-dominated and hence unusable.
| Quadrant | # 1 sec bins | Bins with >0 counts | Bins with >2000 counts | High rate bins dominated by noise | Noise dominated (total time) | Noise dominated (detector-on time) | Marked lightcurve |
|---|---|---|---|---|---|---|---|
| A | 7182 | 5150 | 0 | 0 | 0.00% | 0.00% |  |
| B | 7181 | 5148 | 1313 | 1313 | 18.28% | 25.51% | 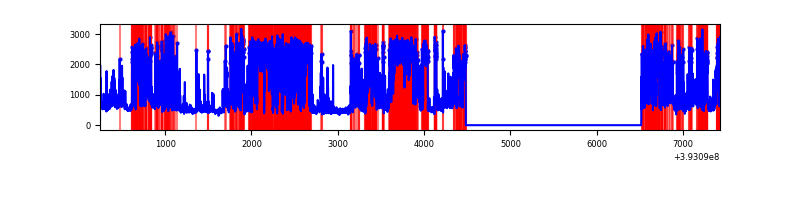 |
| C | 7182 | 5150 | 85 | 85 | 1.18% | 1.65% | 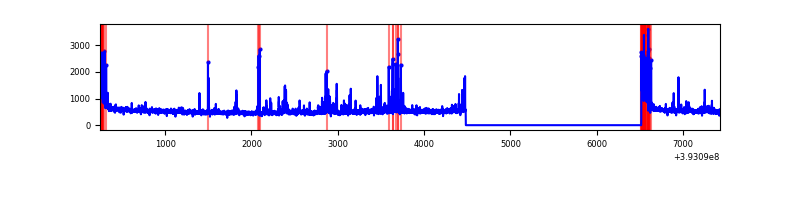 |
| D | 7182 | 5150 | 408 | 408 | 5.68% | 7.92% | 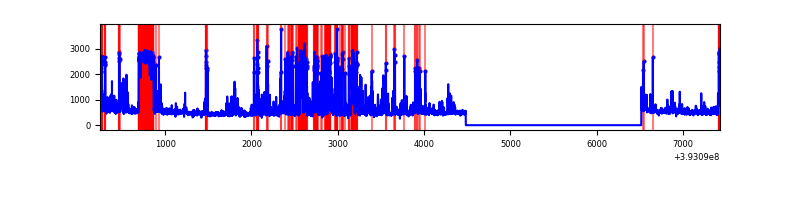 |
Top three noisy pixels from each quadrant. If the there are fewer than three noisy pixels in the level2.evt file, extra rows are filled as -1
| Pixel properties | Quadrant properties | ||||||
|---|---|---|---|---|---|---|---|
| Quadrant | DetID | PixID | Counts | Sigma | Mean | Median | Sigma |
| A | 10 | 83 | 189260 | 1459.62 | 643 | 633 | 129.2 |
| A | 9 | 143 | 8956 | 64.4 | 643 | 633 | 129.2 |
| A | 7 | 16 | 8825 | 63.39 | 643 | 633 | 129.2 |
| B | 5 | 172 | 1904280 | 18135.92 | 551 | 538 | 105.0 |
| B | 4 | 171 | 1207321 | 11496.37 | 551 | 538 | 105.0 |
| B | 5 | 236 | 952537 | 9069.18 | 551 | 538 | 105.0 |
| C | 0 | 10 | 240396 | 1724.68 | 600 | 604 | 139.0 |
| C | 0 | 207 | 226065 | 1621.61 | 600 | 604 | 139.0 |
| C | 15 | 214 | 218152 | 1564.69 | 600 | 604 | 139.0 |
| D | 12 | 233 | 533931 | 3587.53 | 589 | 575 | 148.7 |
| D | 12 | 6 | 446801 | 3001.47 | 589 | 575 | 148.7 |
| D | 2 | 250 | 416252 | 2795.98 | 589 | 575 | 148.7 |
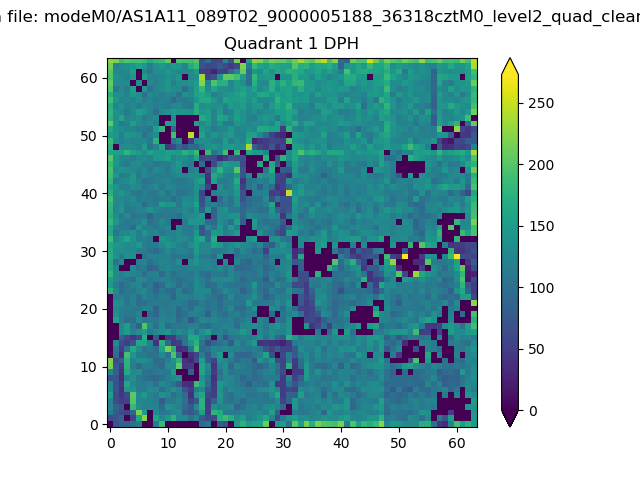
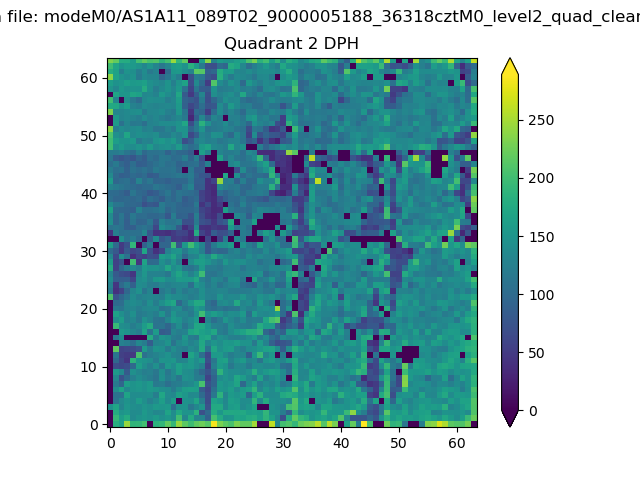
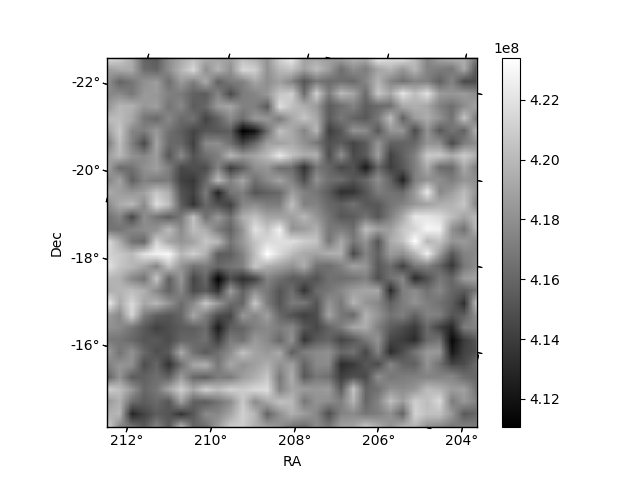
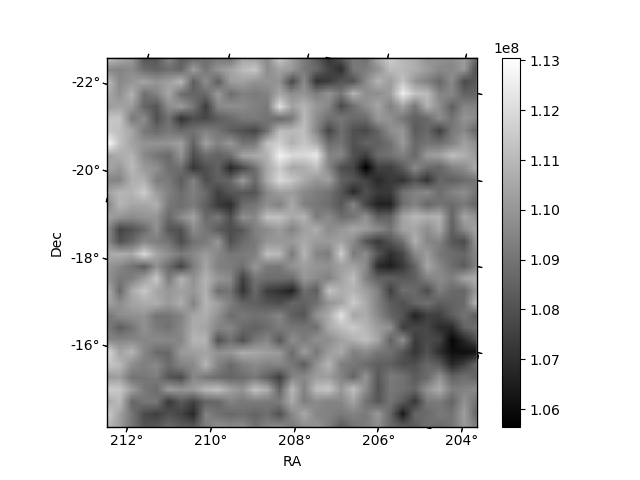
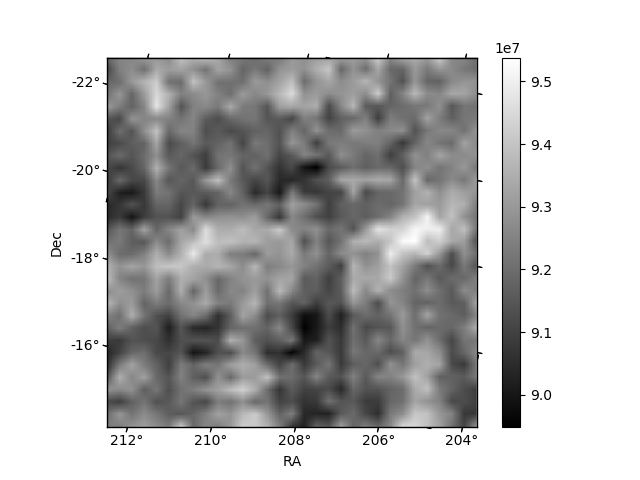
Histogram calculated using DETX and DETY for each event in the final _common_clean file
| Quadrant A | 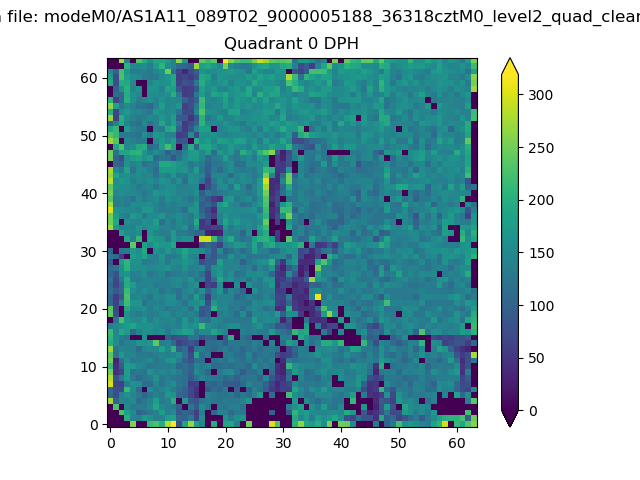 |
 |
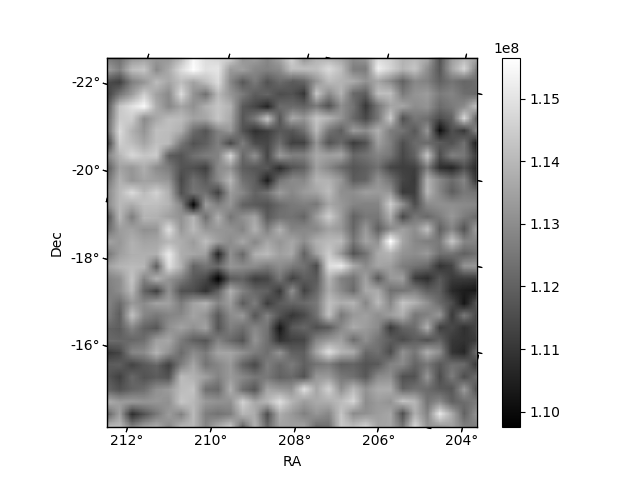
Quadrant B |
|---|---|---|---|
| Quadrant D | 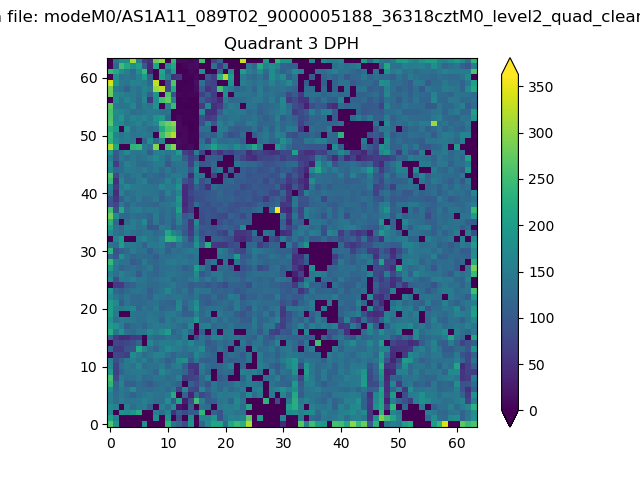 |
 |
Quadrant C |
| Plot type | Count rate plots | Images |
|---|---|---|
| Comparison with Poisson distribution Blue bars denote a histogram of data divided into 1 sec bins. Red curve is a Poisson curve with rate = median count rate of data. |
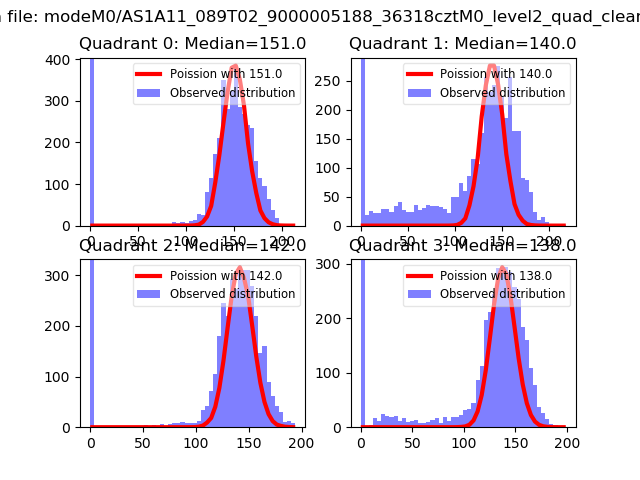 |
 |
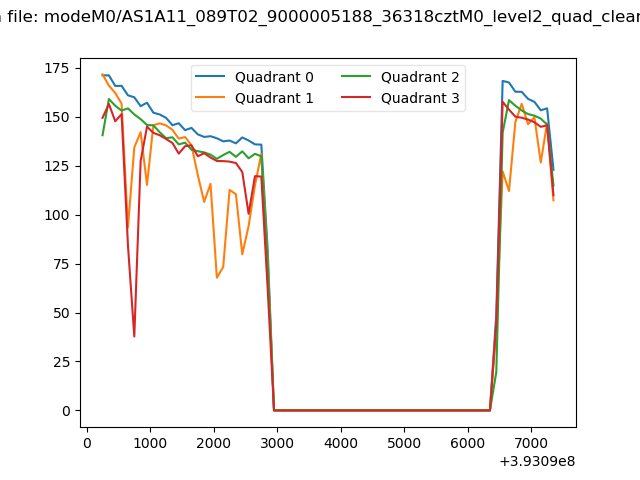
| Quadrant-wise count rates Data is divided into 100 sec bins |
 |
|
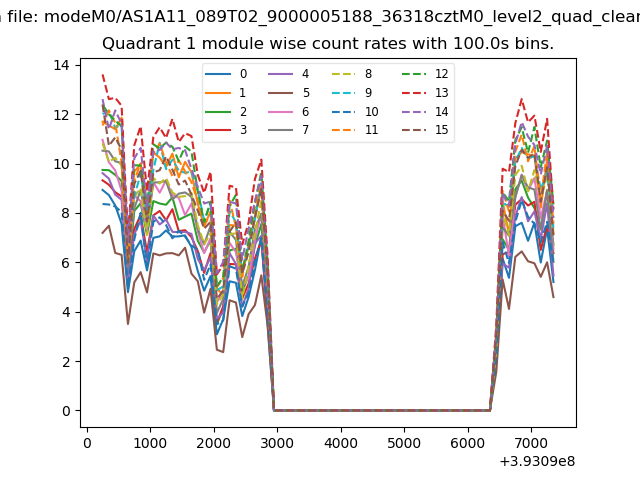
| Module-wise count rates for Quadrant A Data is divided into 100 sec bins |
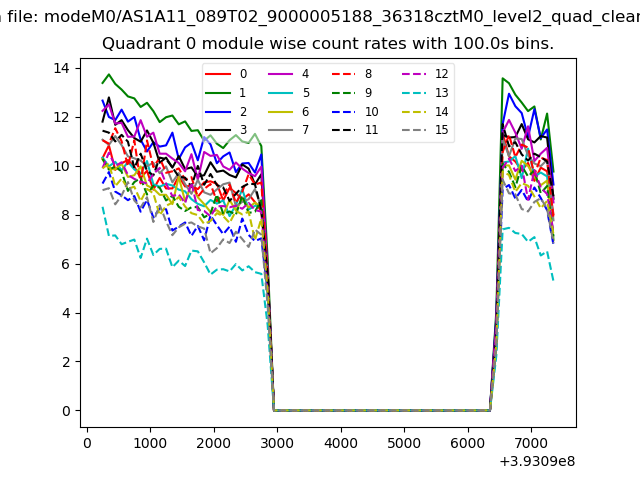 |
 |
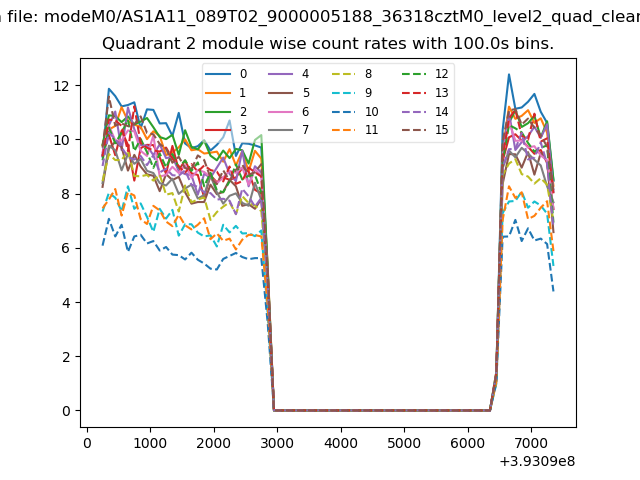
| Module-wise count rates for Quadrant B Data is divided into 100 sec bins |
 |
 |
| Module-wise count rates for Quadrant C Data is divided into 100 sec bins |
 |
 |
| Module-wise count rates for Quadrant D Data is divided into 100 sec bins |
 |
 |
| Parameter | Plot |
|---|---|
| CZT HV Monitor | 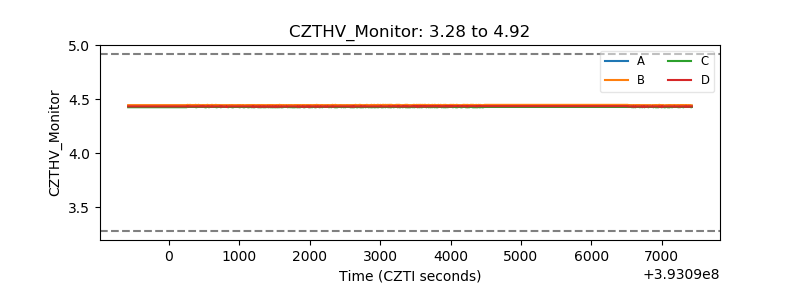 |
| D_VDD | 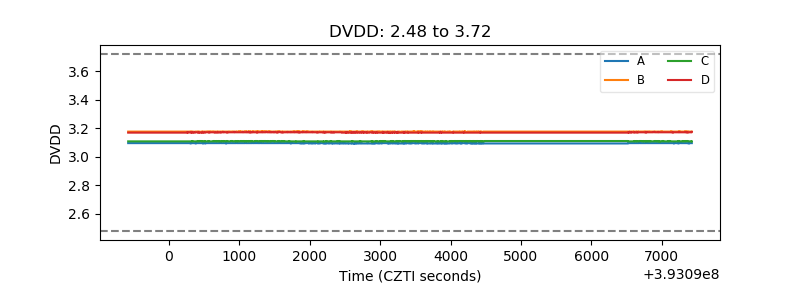 |
| Temperature 1 |  |
| Veto HV Monitor | 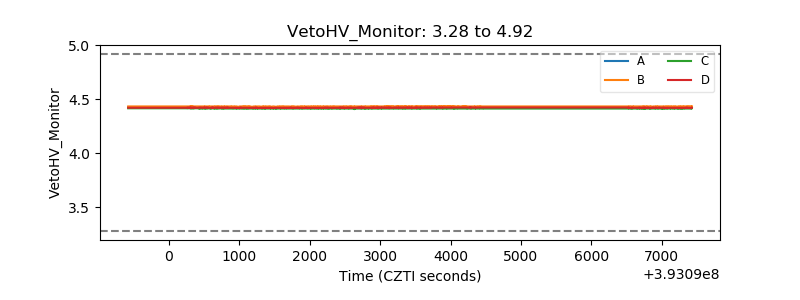 |
| Veto LLD | 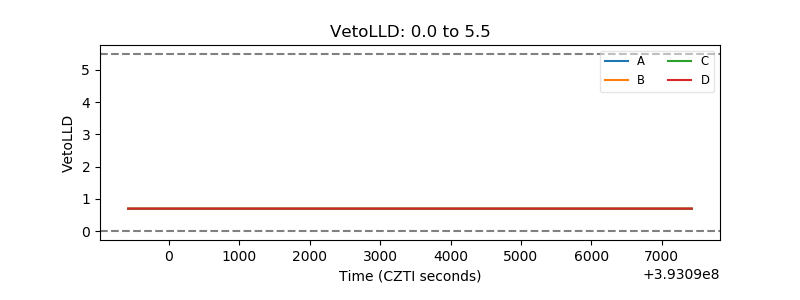 |
| Alpha Counter | 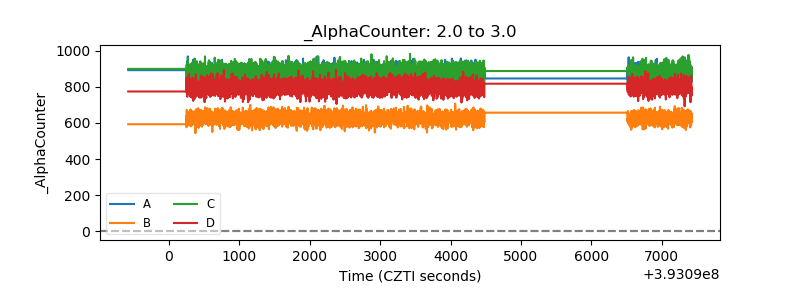 |
| _CPM_Rate | 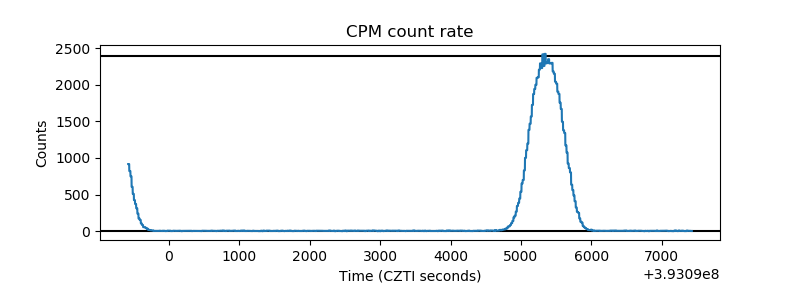 |
| CZT Counter | 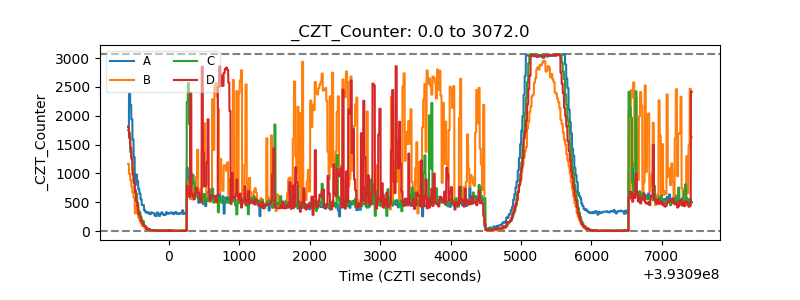 |
| +2.5 Volts monitor | 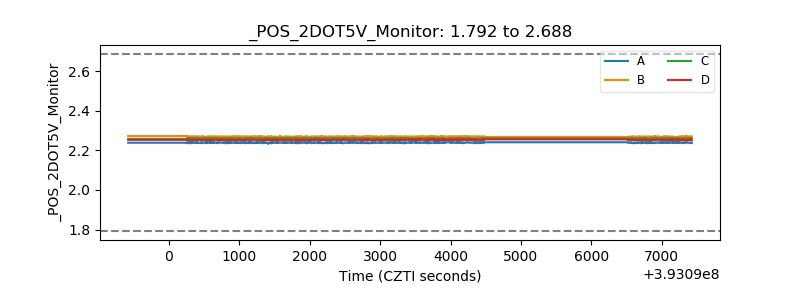 |
| +5 Volts monitor |  |
| _ROLL_ROT | 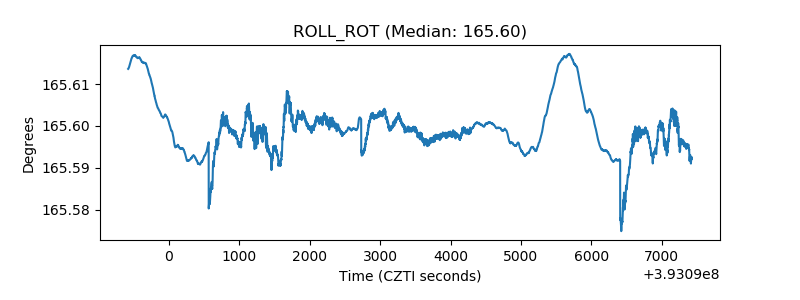 |
| _Roll_DEC | 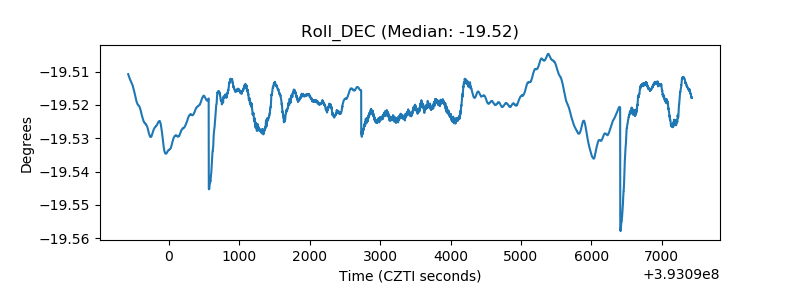 |
| _Roll_RA | 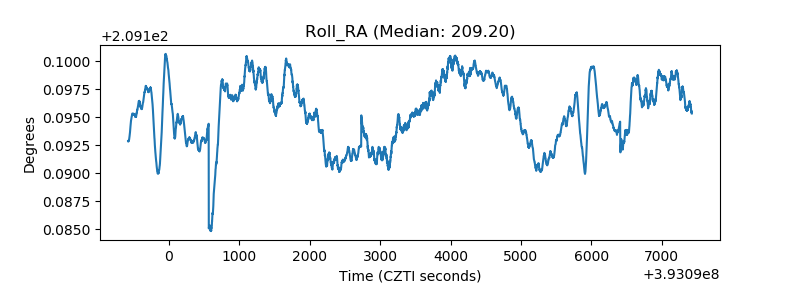 |
| Veto Counter | 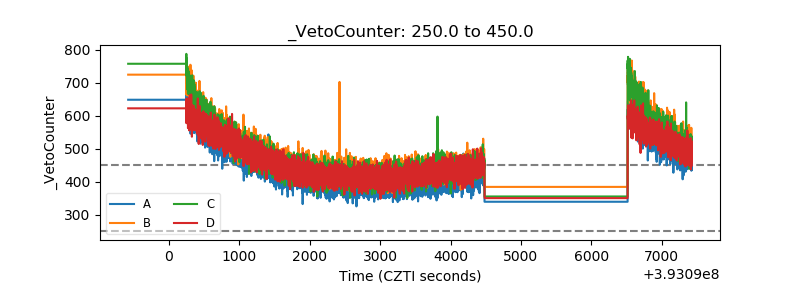 |