| Param | Original file | Final file |
|---|---|---|
| Filename | modeM0/AS1A11_089T02_9000005188_36317cztM0_level2.evt | modeM0/AS1A11_089T02_9000005188_36317cztM0_level2_quad_clean.evt |
| Size (bytes) | 504,705,600 | 84,968,640 |
| Size | 481.3 MB | 81.0 MB |
| Events in quadrant A | 2,729,949 | 590,273 |
| Events in quadrant B | 5,191,000 | 527,969 |
| Events in quadrant C | 2,974,301 | 556,014 |
| Events in quadrant D | 4,029,673 | 526,750 |
| Mode M9 | |||
|---|---|---|---|
| Quadrant | BADHDUFLAG | Total packets | Discarded packets |
| A | 0 | 20 | 0 |
| B | 0 | 20 | 0 |
| C | 0 | 20 | 0 |
| D | 0 | 20 | 0 |
| Mode M0 | |||
|---|---|---|---|
| Quadrant | BADHDUFLAG | Total packets | Discarded packets |
| A | 0 | 11437 | 3 |
| B | 0 | 19000 | 2 |
| C | 0 | 12084 | 2 |
| D | 0 | 15477 | 2 |
| Mode SS | |||
|---|---|---|---|
| Quadrant | BADHDUFLAG | Total packets | Discarded packets |
| A | 0 | 108 | 0 |
| B | 0 | 108 | 0 |
| C | 0 | 108 | 0 |
| D | 0 | 108 | 0 |
| Quadrant | Total seconds | Saturated seconds | Saturation percentage |
|---|---|---|---|
| A | 5312 | 6 | 0.112952% |
| B | 5312 | 811 | 15.267319% |
| C | 5312 | 67 | 1.261295% |
| D | 5312 | 349 | 6.570030% |
Noise dominated data is calculated using 1-second bins in cleaned event files. If a bin has >2000 counts, and if more than 50% of those come from <1% of pixels, then it is considered to be noise-dominated and hence unusable.
| Quadrant | # 1 sec bins | Bins with >0 counts | Bins with >2000 counts | High rate bins dominated by noise | Noise dominated (total time) | Noise dominated (detector-on time) | Marked lightcurve |
|---|---|---|---|---|---|---|---|
| A | 7255 | 5313 | 0 | 0 | 0.00% | 0.00% | 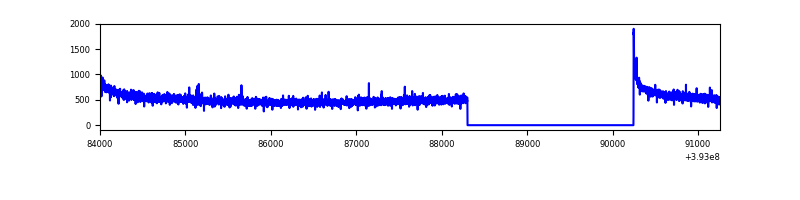 |
| B | 7255 | 5313 | 689 | 689 | 9.50% | 12.97% | 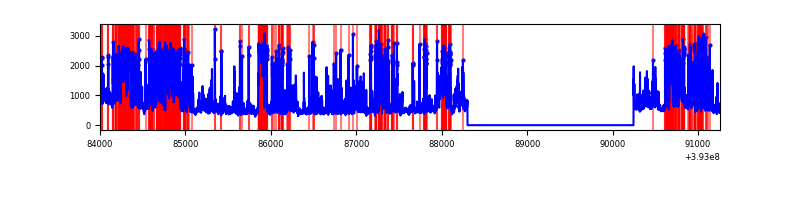 |
| C | 7255 | 5313 | 62 | 62 | 0.85% | 1.17% | 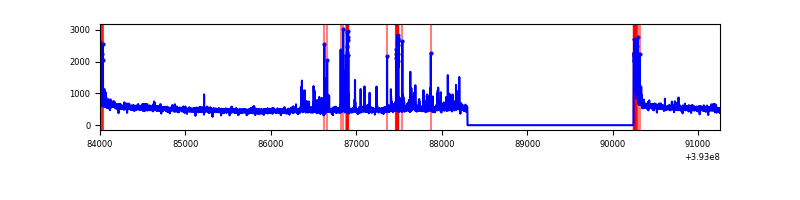 |
| D | 7255 | 5313 | 348 | 348 | 4.80% | 6.55% | 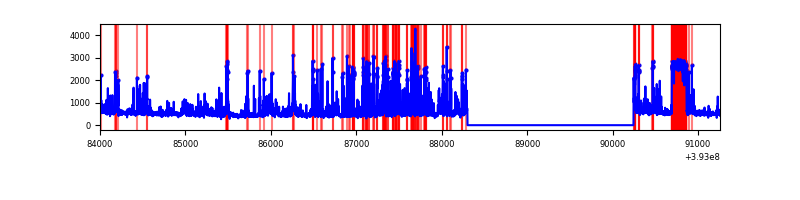 |
Top three noisy pixels from each quadrant. If the there are fewer than three noisy pixels in the level2.evt file, extra rows are filled as -1
| Pixel properties | Quadrant properties | ||||||
|---|---|---|---|---|---|---|---|
| Quadrant | DetID | PixID | Counts | Sigma | Mean | Median | Sigma |
| A | 10 | 83 | 178380 | 1346.02 | 656 | 646 | 132.0 |
| A | 13 | 254 | 7646 | 53.01 | 656 | 646 | 132.0 |
| A | 3 | 137 | 6241 | 42.37 | 656 | 646 | 132.0 |
| B | 5 | 172 | 1034746 | 9203.55 | 596 | 582 | 112.4 |
| B | 5 | 236 | 804206 | 7151.86 | 596 | 582 | 112.4 |
| B | 4 | 171 | 625813 | 5564.25 | 596 | 582 | 112.4 |
| C | 0 | 207 | 243639 | 1705.08 | 612 | 615 | 142.5 |
| C | 15 | 214 | 226073 | 1581.84 | 612 | 615 | 142.5 |
| C | 0 | 10 | 111499 | 777.97 | 612 | 615 | 142.5 |
| D | 12 | 6 | 553070 | 3719.99 | 607 | 591 | 148.5 |
| D | 12 | 233 | 501818 | 3374.9 | 607 | 591 | 148.5 |
| D | 2 | 250 | 247260 | 1660.89 | 607 | 591 | 148.5 |
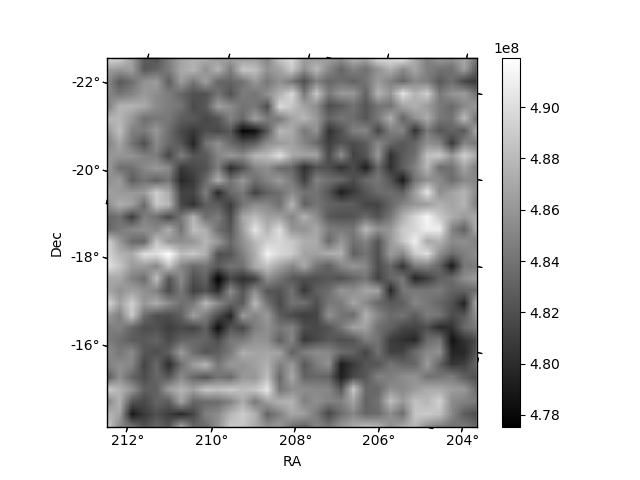
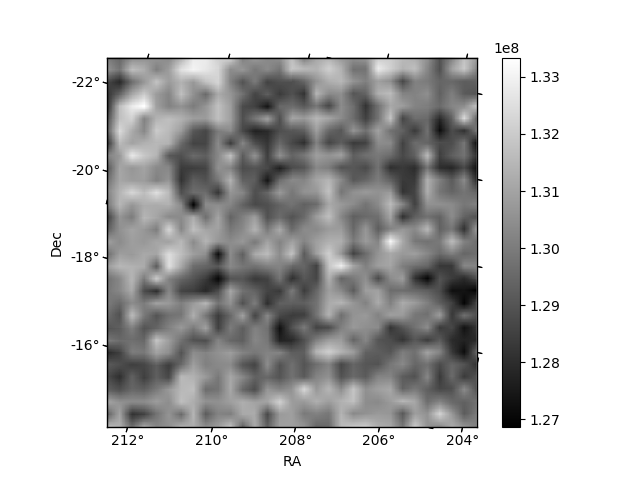
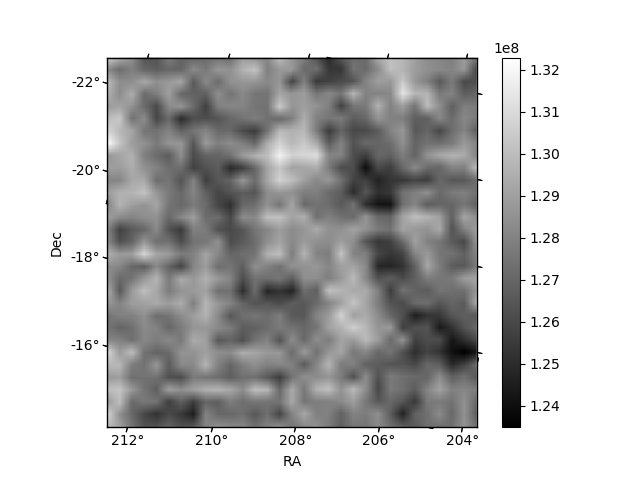
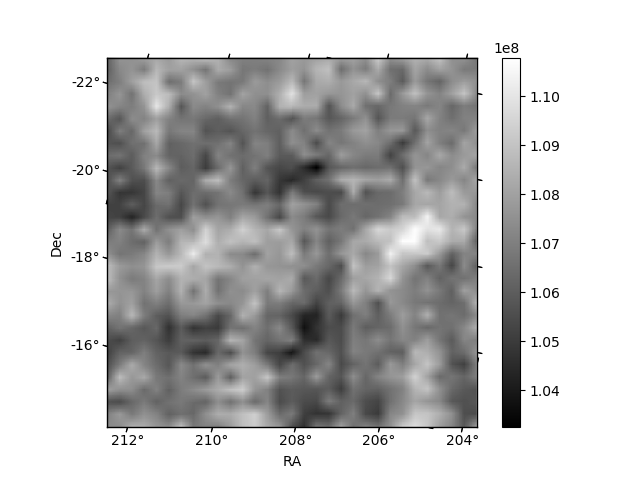
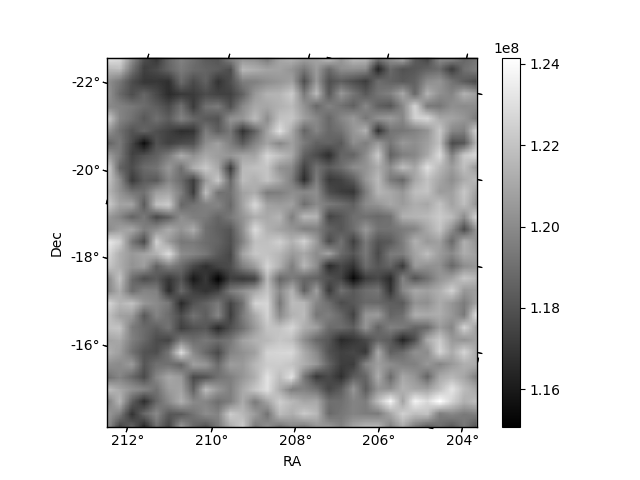
Histogram calculated using DETX and DETY for each event in the final _common_clean file
| Quadrant A | 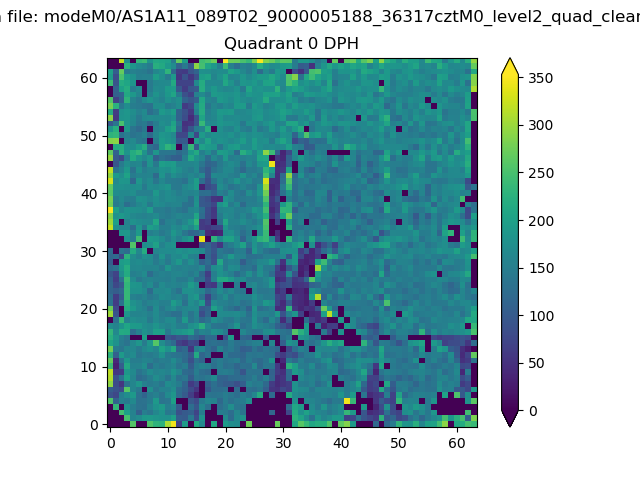 |
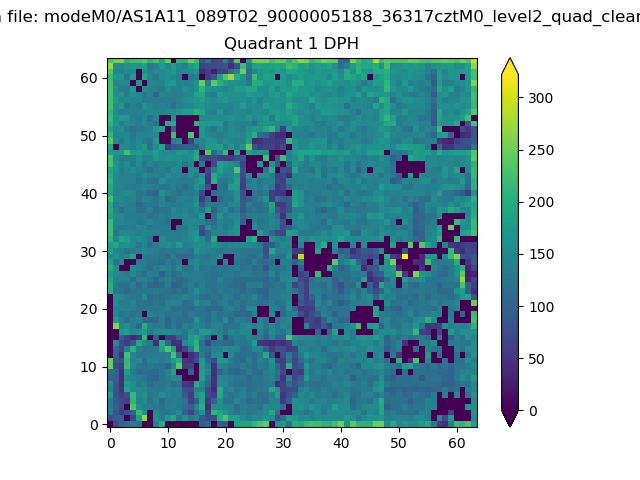 |
Quadrant B |
|---|---|---|---|
| Quadrant D | 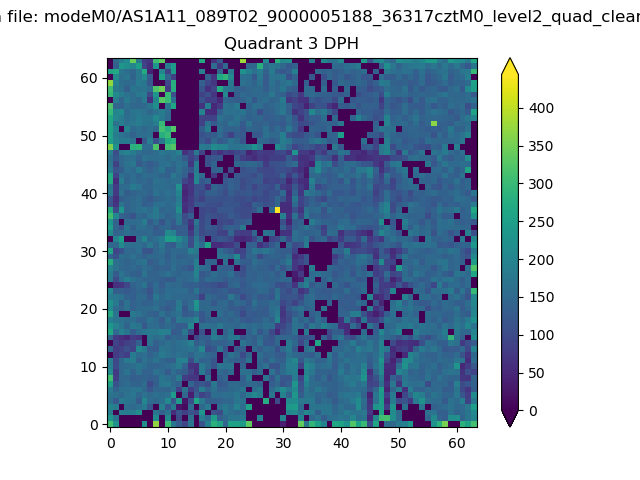 |
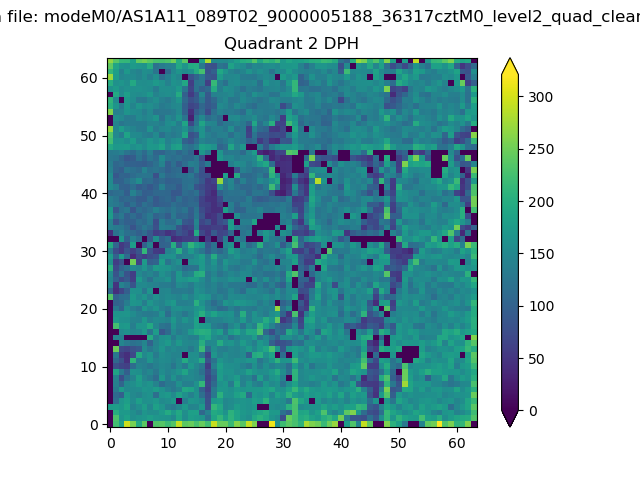 |
Quadrant C |
| Plot type | Count rate plots | Images |
|---|---|---|
| Comparison with Poisson distribution Blue bars denote a histogram of data divided into 1 sec bins. Red curve is a Poisson curve with rate = median count rate of data. |
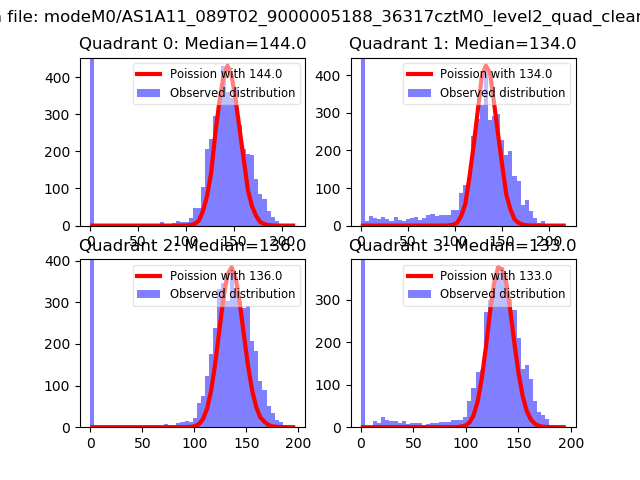 |
 |
| Quadrant-wise count rates Data is divided into 100 sec bins |
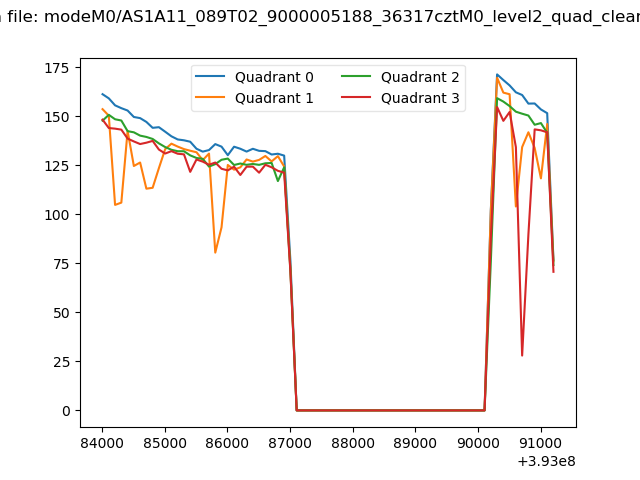 |
|
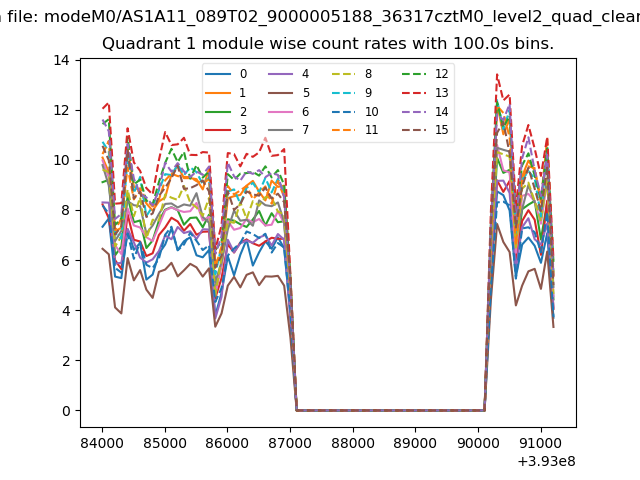
| Module-wise count rates for Quadrant A Data is divided into 100 sec bins |
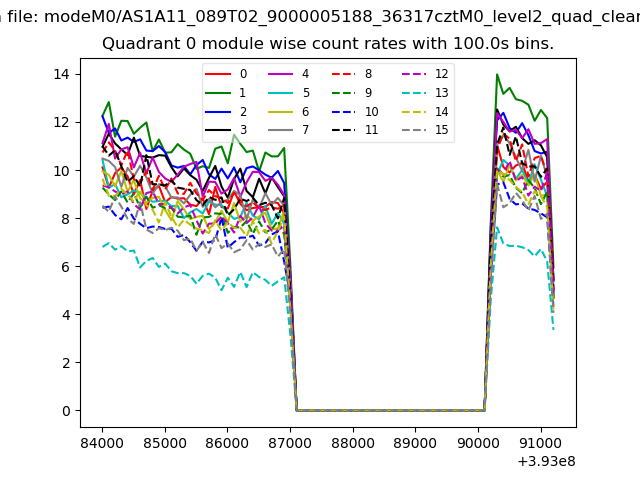 |
 |
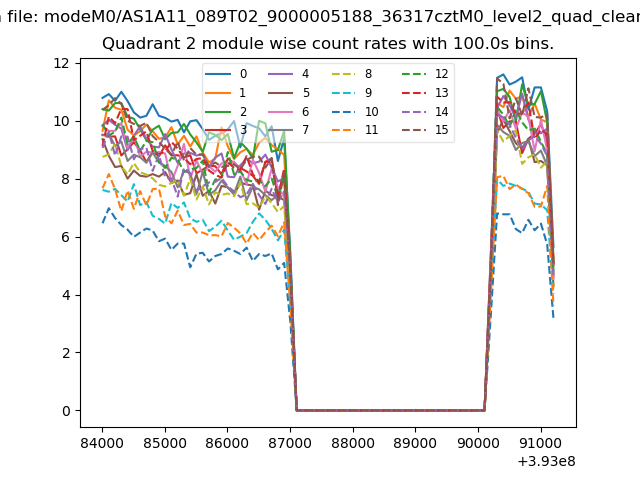
| Module-wise count rates for Quadrant B Data is divided into 100 sec bins |
 |
 |
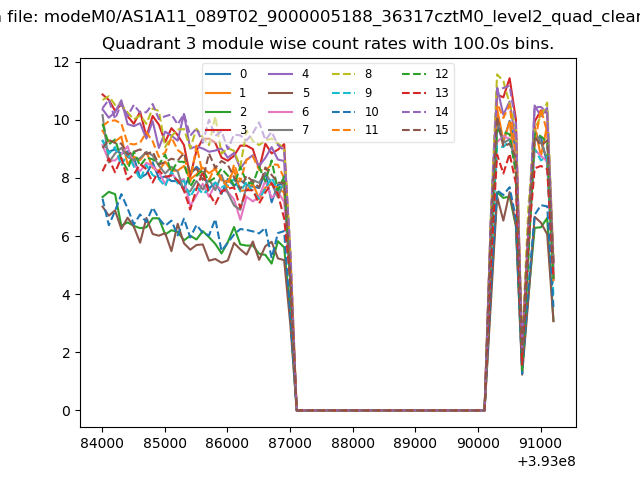
| Module-wise count rates for Quadrant C Data is divided into 100 sec bins |
 |
 |
| Module-wise count rates for Quadrant D Data is divided into 100 sec bins |
 |
 |
| Parameter | Plot |
|---|---|
| CZT HV Monitor | 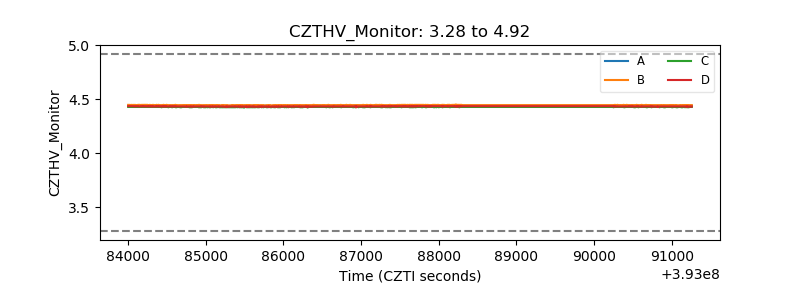 |
| D_VDD | 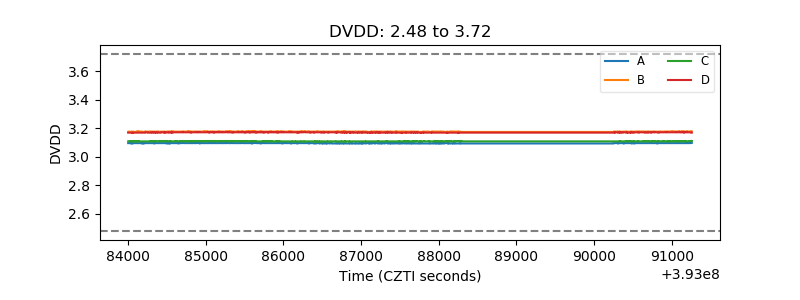 |
| Temperature 1 | 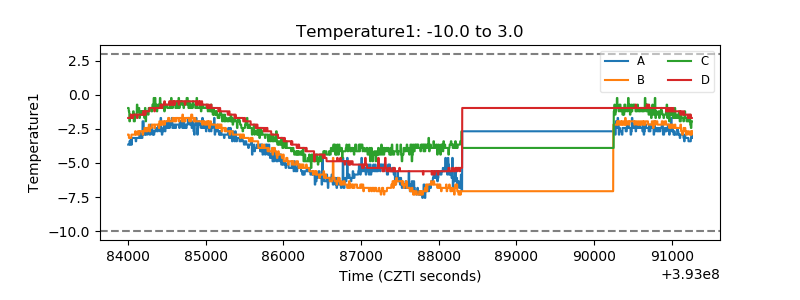 |
| Veto HV Monitor | 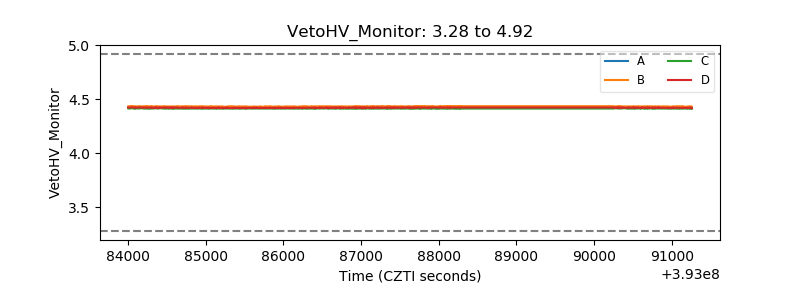 |
| Veto LLD | 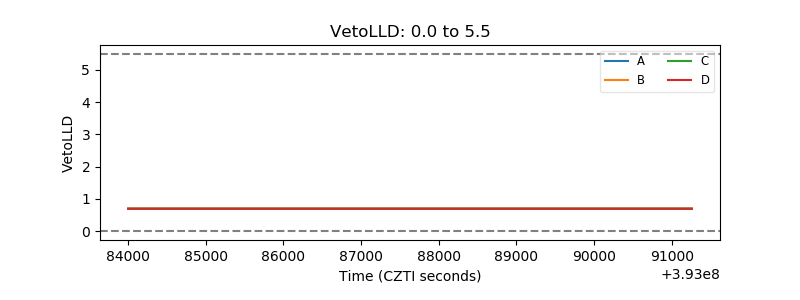 |
| Alpha Counter | 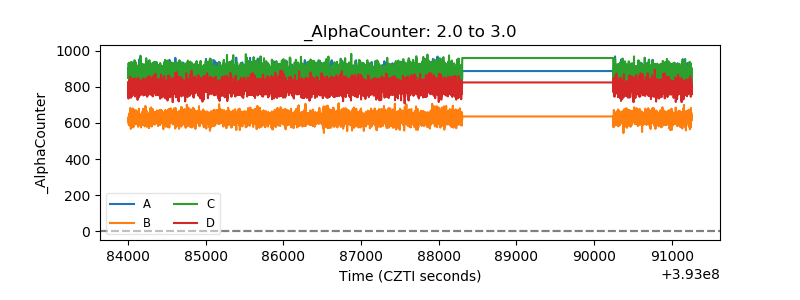 |
| _CPM_Rate | 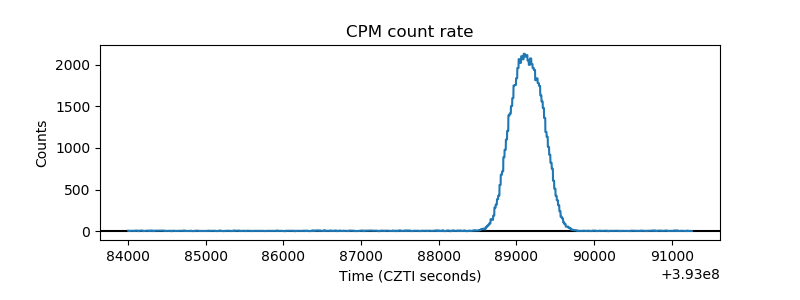 |
| CZT Counter | 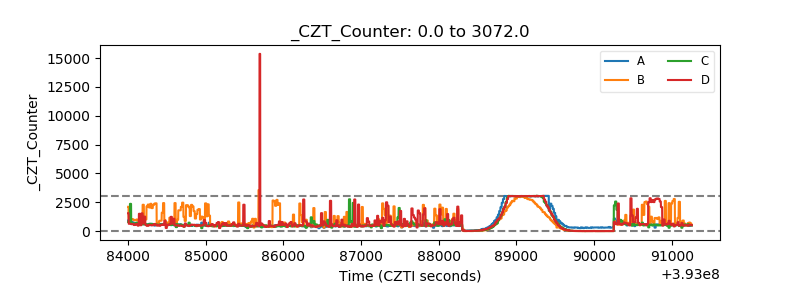 |
| +2.5 Volts monitor | 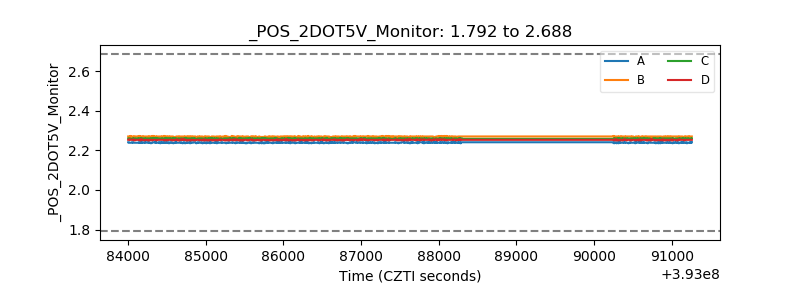 |
| +5 Volts monitor | 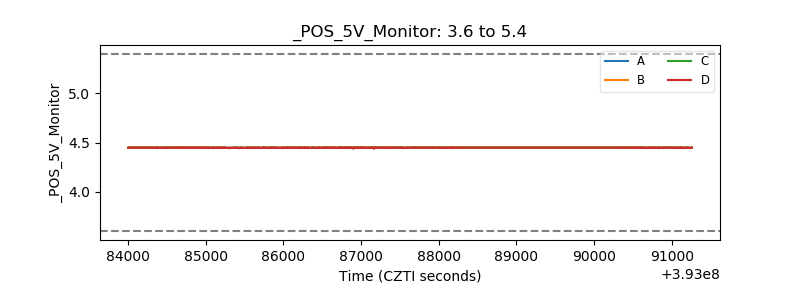 |
| _ROLL_ROT | 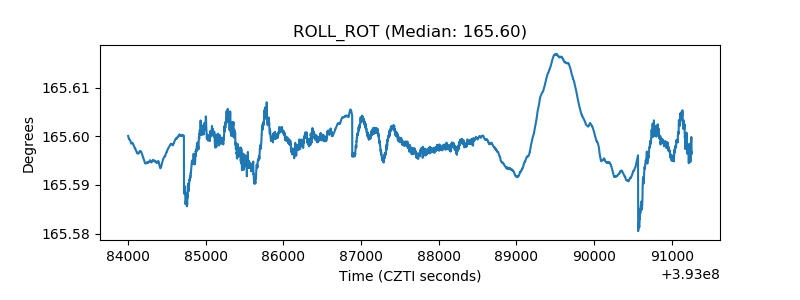 |
| _Roll_DEC | 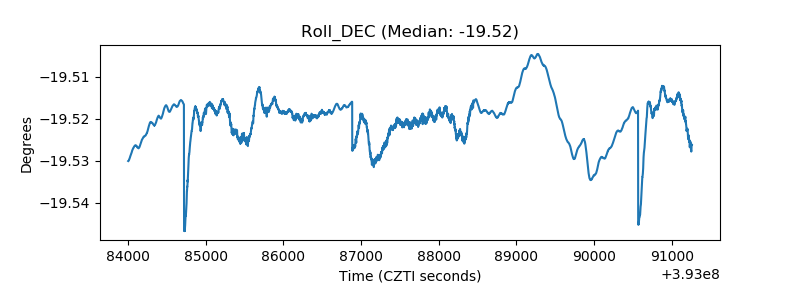 |
| _Roll_RA | 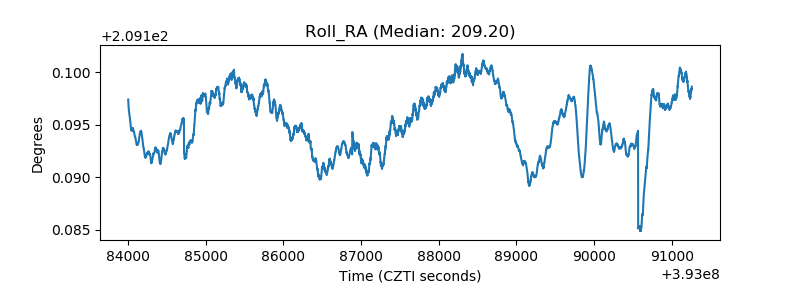 |
| Veto Counter | 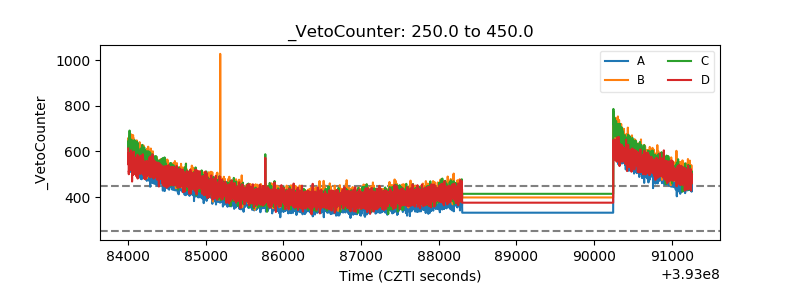 |