| Param | Original file | Final file |
|---|---|---|
| Filename | modeM0/AS1A11_089T02_9000005188_36316cztM0_level2.evt | modeM0/AS1A11_089T02_9000005188_36316cztM0_level2_quad_clean.evt |
| Size (bytes) | 642,945,600 | 77,443,200 |
| Size | 613.2 MB | 73.9 MB |
| Events in quadrant A | 2,538,722 | 568,596 |
| Events in quadrant B | 7,117,725 | 455,376 |
| Events in quadrant C | 2,687,312 | 545,213 |
| Events in quadrant D | 6,777,018 | 411,050 |
| Mode M9 | |||
|---|---|---|---|
| Quadrant | BADHDUFLAG | Total packets | Discarded packets |
| A | 0 | 18 | 0 |
| B | 0 | 18 | 0 |
| C | 0 | 18 | 0 |
| D | 0 | 18 | 0 |
| Mode M0 | |||
|---|---|---|---|
| Quadrant | BADHDUFLAG | Total packets | Discarded packets |
| A | 0 | 10838 | 2 |
| B | 0 | 24790 | 1 |
| C | 0 | 11149 | 1 |
| D | 0 | 23591 | 1 |
| Mode SS | |||
|---|---|---|---|
| Quadrant | BADHDUFLAG | Total packets | Discarded packets |
| A | 0 | 106 | 0 |
| B | 0 | 106 | 0 |
| C | 0 | 106 | 0 |
| D | 0 | 106 | 0 |
| Quadrant | Total seconds | Saturated seconds | Saturation percentage |
|---|---|---|---|
| A | 5188 | 5 | 0.096376% |
| B | 5188 | 1573 | 30.319969% |
| C | 5188 | 23 | 0.443331% |
| D | 5188 | 1553 | 29.934464% |
Noise dominated data is calculated using 1-second bins in cleaned event files. If a bin has >2000 counts, and if more than 50% of those come from <1% of pixels, then it is considered to be noise-dominated and hence unusable.
| Quadrant | # 1 sec bins | Bins with >0 counts | Bins with >2000 counts | High rate bins dominated by noise | Noise dominated (total time) | Noise dominated (detector-on time) | Marked lightcurve |
|---|---|---|---|---|---|---|---|
| A | 6981 | 5189 | 0 | 0 | 0.00% | 0.00% | 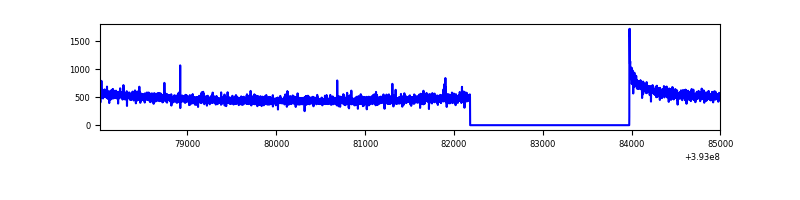 |
| B | 6980 | 5188 | 1389 | 1389 | 19.90% | 26.77% | 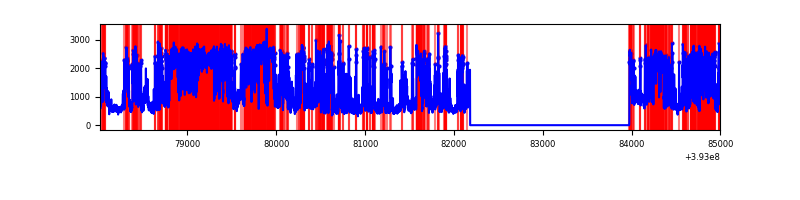 |
| C | 6981 | 5189 | 21 | 21 | 0.30% | 0.40% | 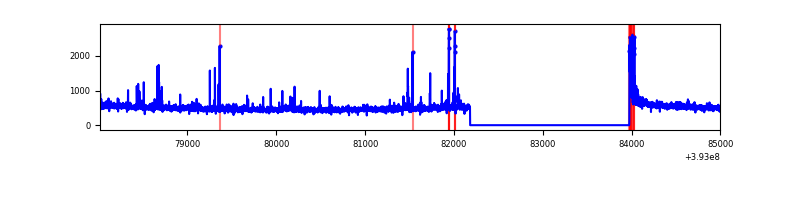 |
| D | 6981 | 5189 | 1586 | 1586 | 22.72% | 30.56% | 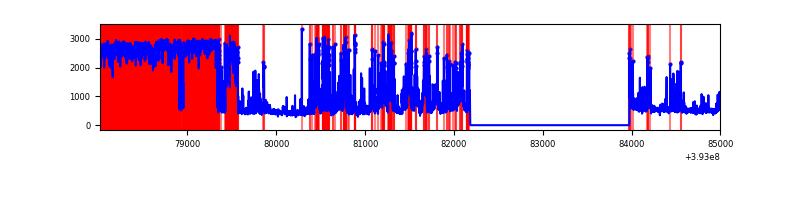 |
Top three noisy pixels from each quadrant. If the there are fewer than three noisy pixels in the level2.evt file, extra rows are filled as -1
| Pixel properties | Quadrant properties | ||||||
|---|---|---|---|---|---|---|---|
| Quadrant | DetID | PixID | Counts | Sigma | Mean | Median | Sigma |
| A | 10 | 83 | 145054 | 1147.88 | 618 | 607 | 125.8 |
| A | 13 | 254 | 7085 | 51.48 | 618 | 607 | 125.8 |
| A | 3 | 137 | 6208 | 44.51 | 618 | 607 | 125.8 |
| B | 5 | 172 | 3084324 | 30585.73 | 522 | 511 | 100.8 |
| B | 4 | 171 | 1291655 | 12805.77 | 522 | 511 | 100.8 |
| B | 5 | 236 | 365620 | 3621.21 | 522 | 511 | 100.8 |
| C | 15 | 214 | 216136 | 1577.95 | 585 | 589 | 136.6 |
| C | 0 | 10 | 100687 | 732.79 | 585 | 589 | 136.6 |
| C | 0 | 207 | 79455 | 577.35 | 585 | 589 | 136.6 |
| D | 12 | 227 | 4114514 | 34142.23 | 495 | 482 | 120.5 |
| D | 12 | 6 | 307136 | 2544.91 | 495 | 482 | 120.5 |
| D | 12 | 235 | 95152 | 785.66 | 495 | 482 | 120.5 |
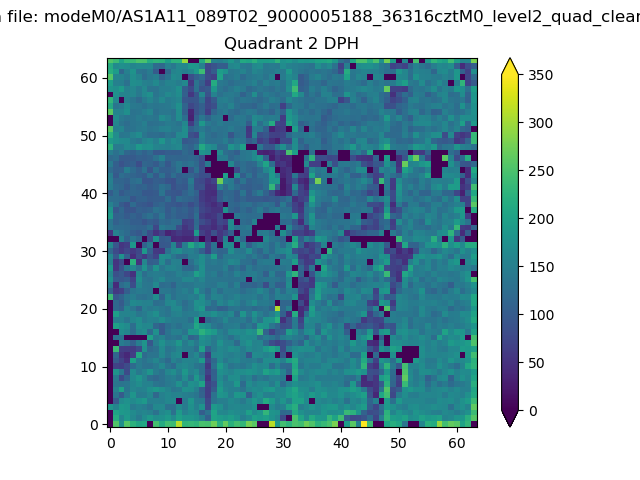
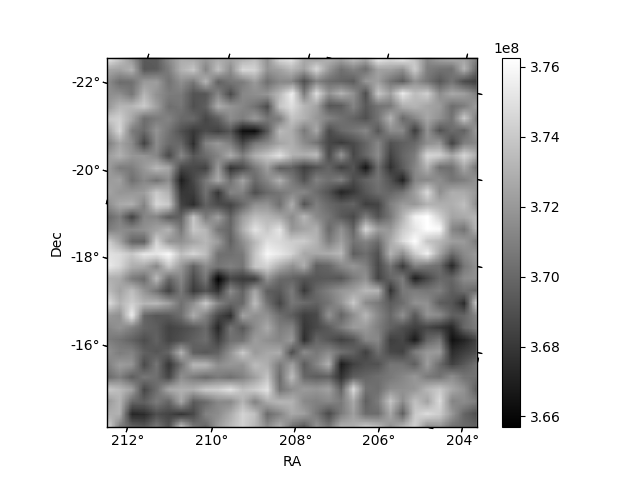
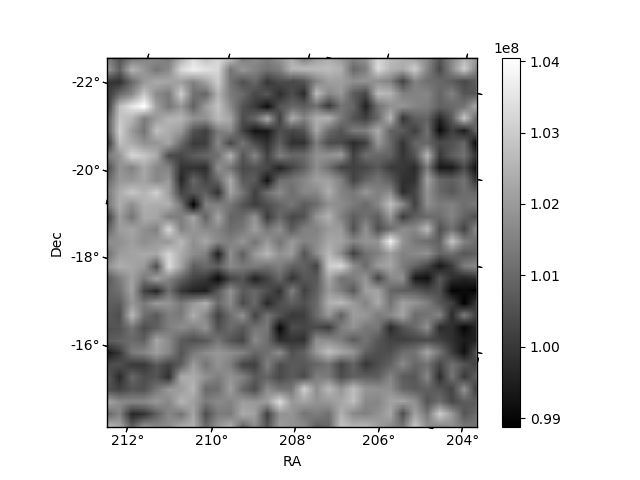
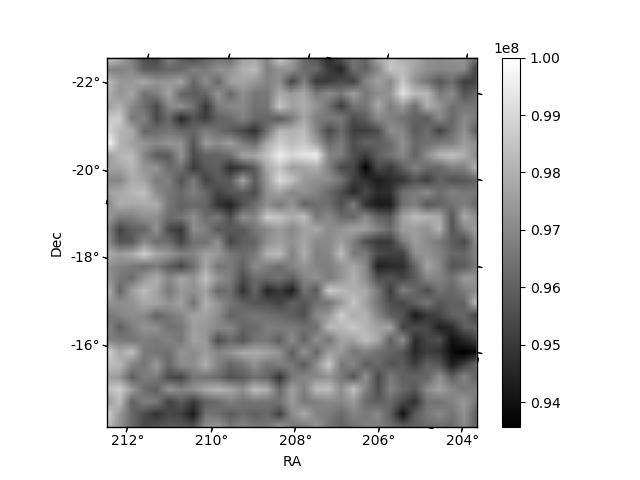
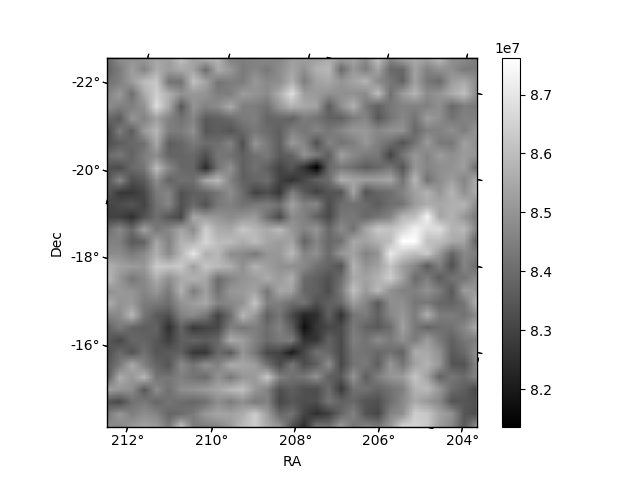
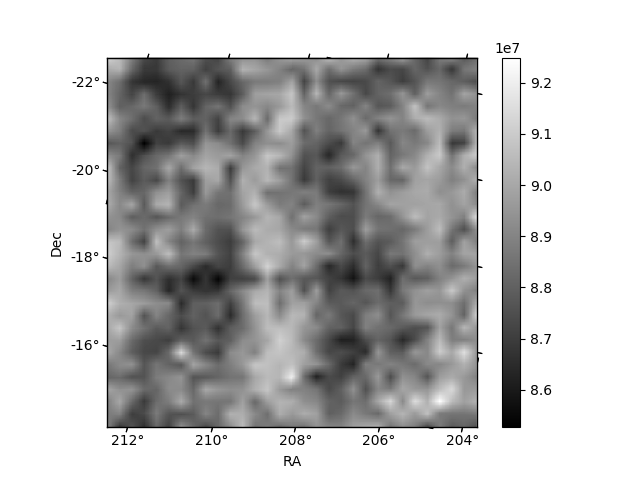
Histogram calculated using DETX and DETY for each event in the final _common_clean file
| Quadrant A | 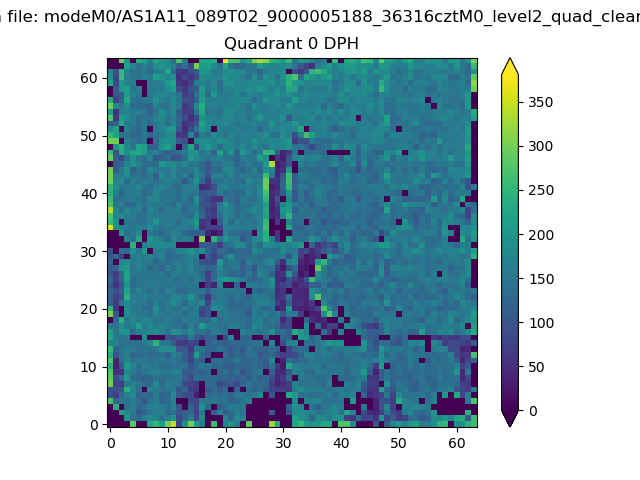 |
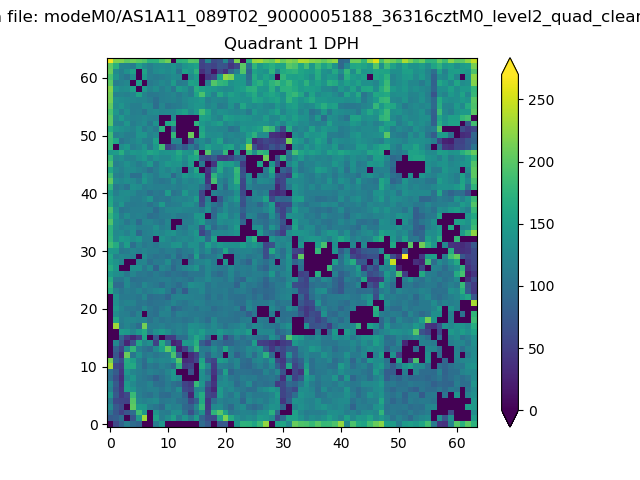 |
Quadrant B |
|---|---|---|---|
| Quadrant D | 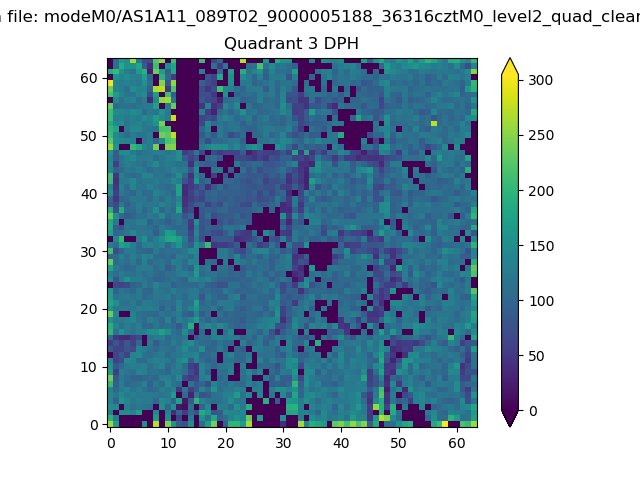 |
 |
Quadrant C |
| Plot type | Count rate plots | Images |
|---|---|---|
| Comparison with Poisson distribution Blue bars denote a histogram of data divided into 1 sec bins. Red curve is a Poisson curve with rate = median count rate of data. |
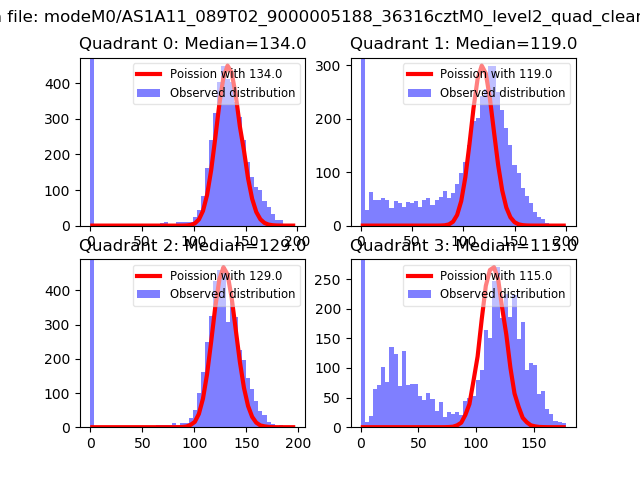 |
 |
| Quadrant-wise count rates Data is divided into 100 sec bins |
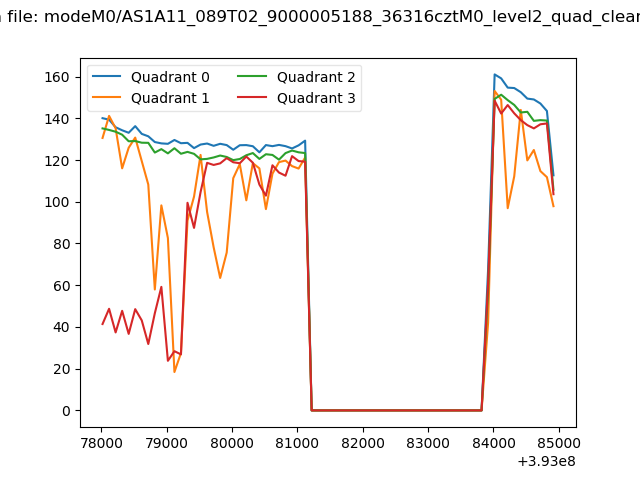 |
|
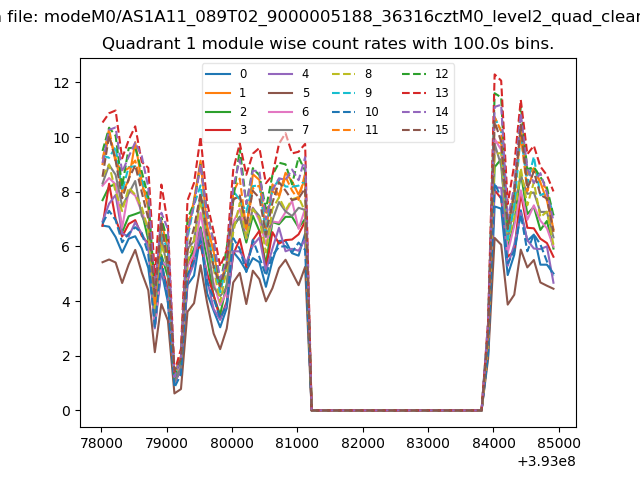
| Module-wise count rates for Quadrant A Data is divided into 100 sec bins |
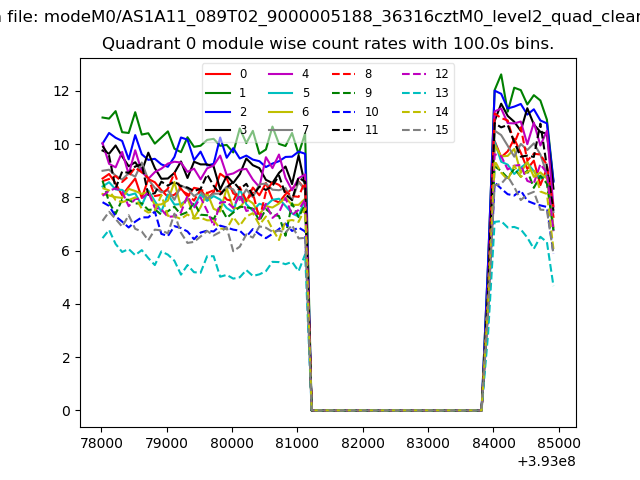 |
 |
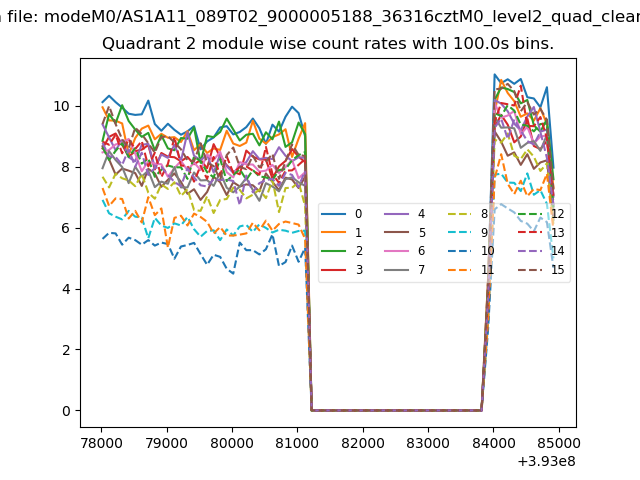
| Module-wise count rates for Quadrant B Data is divided into 100 sec bins |
 |
 |
| Module-wise count rates for Quadrant C Data is divided into 100 sec bins |
 |
 |
| Module-wise count rates for Quadrant D Data is divided into 100 sec bins |
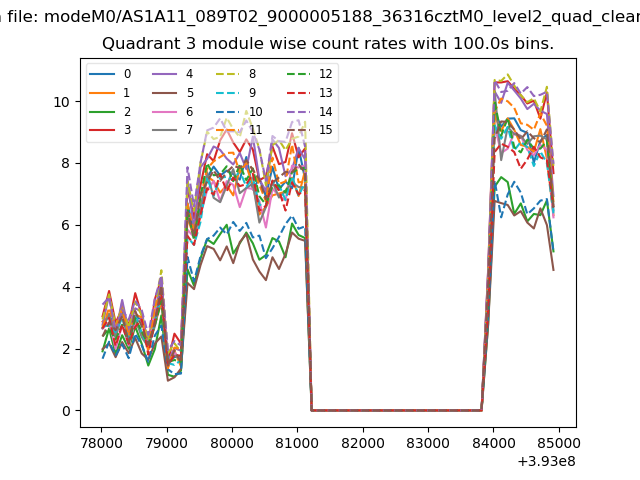 |
 |
| Parameter | Plot |
|---|---|
| CZT HV Monitor | 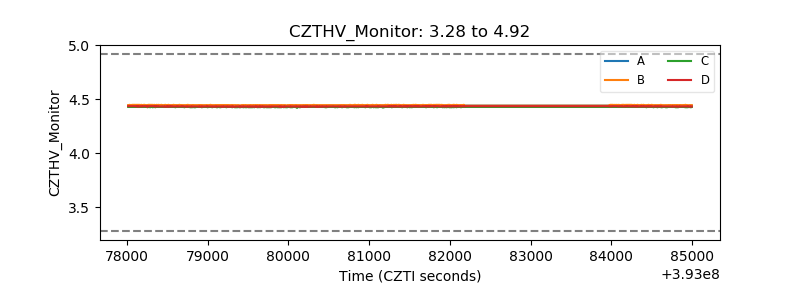 |
| D_VDD | 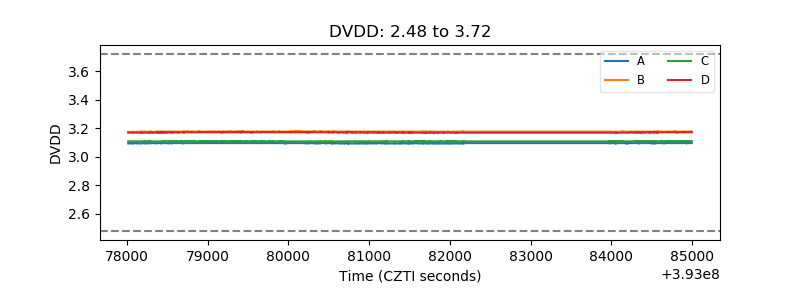 |
| Temperature 1 | 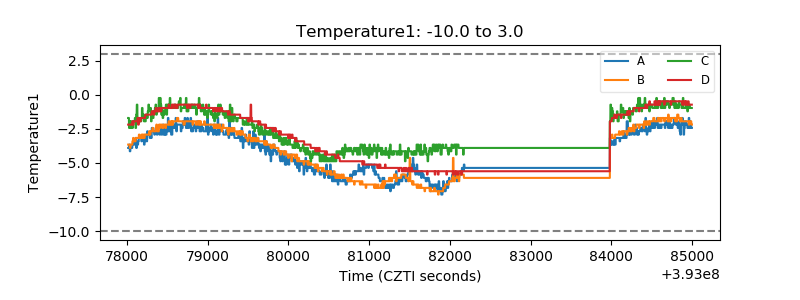 |
| Veto HV Monitor | 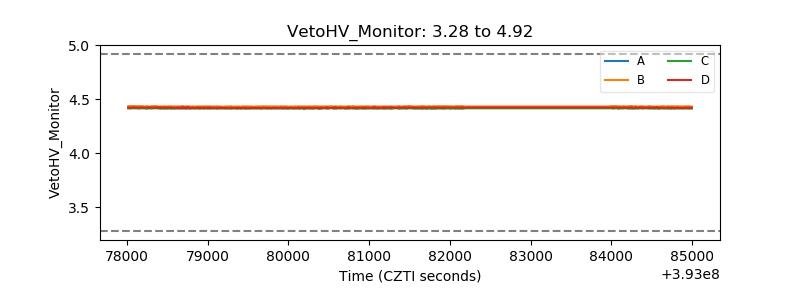 |
| Veto LLD | 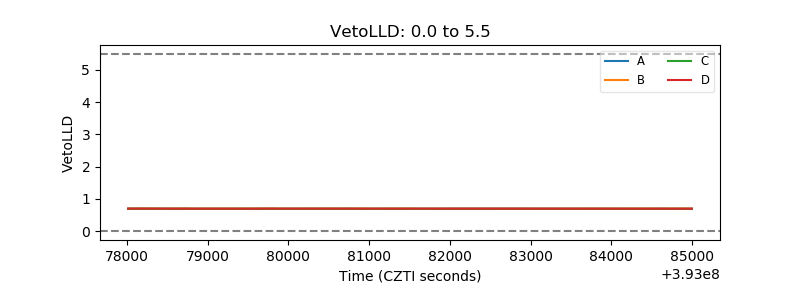 |
| Alpha Counter | 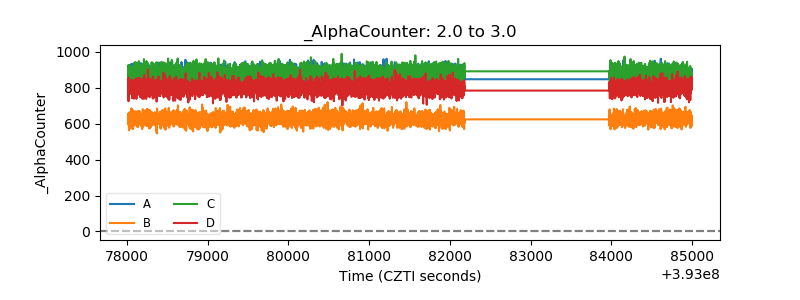 |
| _CPM_Rate | 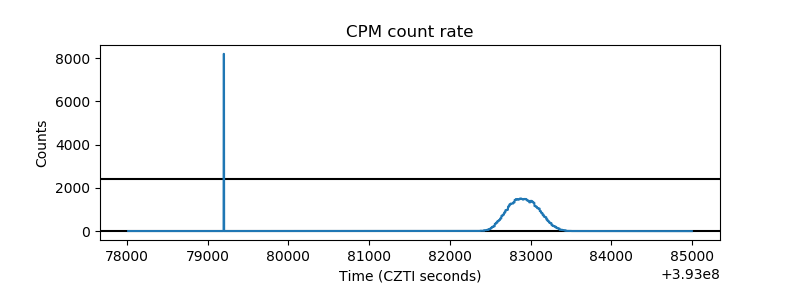 |
| CZT Counter | 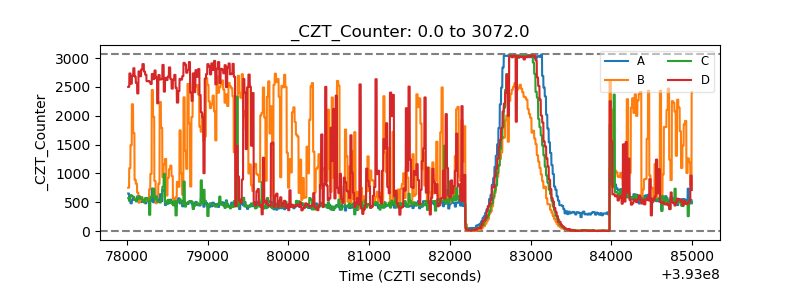 |
| +2.5 Volts monitor | 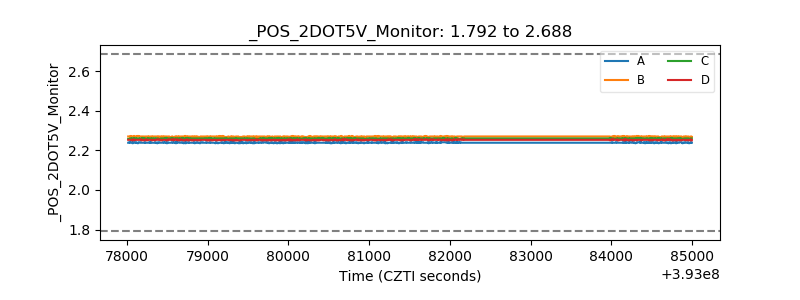 |
| +5 Volts monitor | 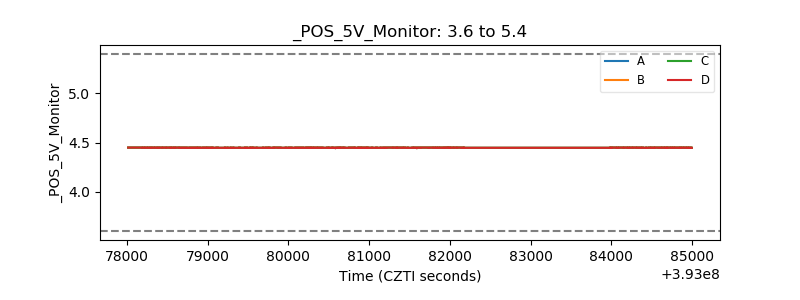 |
| _ROLL_ROT | 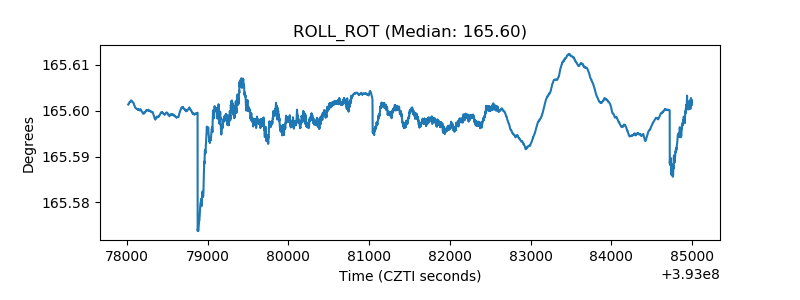 |
| _Roll_DEC | 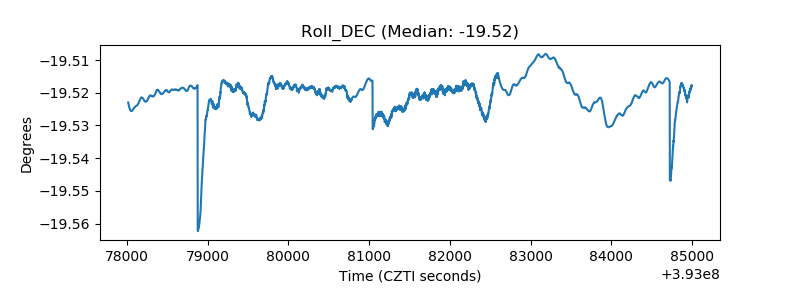 |
| _Roll_RA | 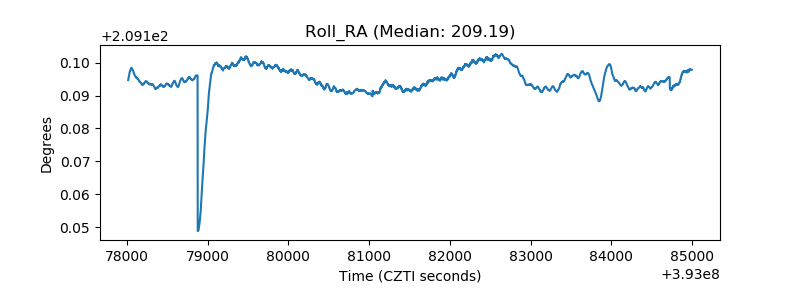 |
| Veto Counter | 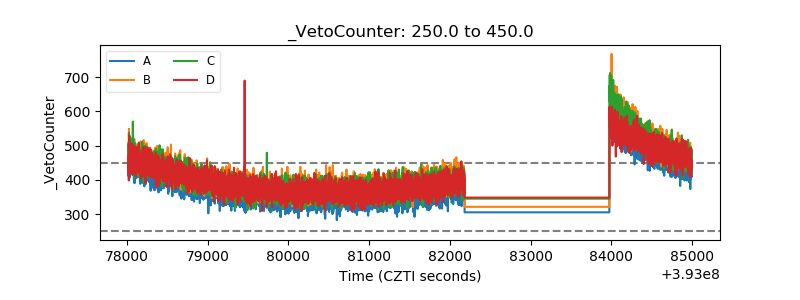 |