| Param | Original file | Final file |
|---|---|---|
| Filename | modeM0/AS1A11_089T02_9000005188_36314cztM0_level2.evt | modeM0/AS1A11_089T02_9000005188_36314cztM0_level2_quad_clean.evt |
| Size (bytes) | 579,090,240 | 82,938,240 |
| Size | 552.3 MB | 79.1 MB |
| Events in quadrant A | 2,712,328 | 579,788 |
| Events in quadrant B | 5,267,548 | 526,725 |
| Events in quadrant C | 3,433,747 | 557,191 |
| Events in quadrant D | 5,747,099 | 457,734 |
| Mode M9 | |||
|---|---|---|---|
| Quadrant | BADHDUFLAG | Total packets | Discarded packets |
| A | 0 | 32 | 0 |
| B | 0 | 32 | 0 |
| C | 0 | 32 | 0 |
| D | 0 | 32 | 0 |
| Mode M0 | |||
|---|---|---|---|
| Quadrant | BADHDUFLAG | Total packets | Discarded packets |
| A | 0 | 11665 | 3 |
| B | 0 | 19328 | 2 |
| C | 0 | 13691 | 2 |
| D | 0 | 20855 | 2 |
| Mode SS | |||
|---|---|---|---|
| Quadrant | BADHDUFLAG | Total packets | Discarded packets |
| A | 0 | 116 | 0 |
| B | 0 | 116 | 0 |
| C | 0 | 116 | 0 |
| D | 0 | 116 | 0 |
| Quadrant | Total seconds | Saturated seconds | Saturation percentage |
|---|---|---|---|
| A | 5562 | 12 | 0.215750% |
| B | 5562 | 846 | 15.210356% |
| C | 5562 | 128 | 2.301330% |
| D | 5562 | 1139 | 20.478245% |
Noise dominated data is calculated using 1-second bins in cleaned event files. If a bin has >2000 counts, and if more than 50% of those come from <1% of pixels, then it is considered to be noise-dominated and hence unusable.
| Quadrant | # 1 sec bins | Bins with >0 counts | Bins with >2000 counts | High rate bins dominated by noise | Noise dominated (total time) | Noise dominated (detector-on time) | Marked lightcurve |
|---|---|---|---|---|---|---|---|
| A | 8786 | 5564 | 0 | 0 | 0.00% | 0.00% | 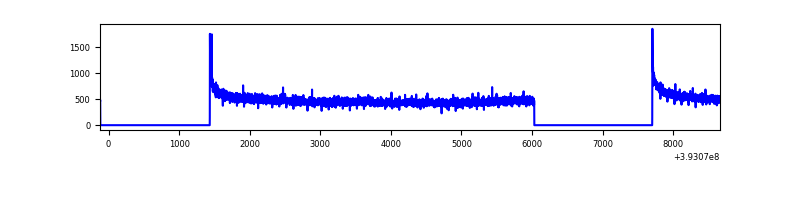 |
| B | 8786 | 5564 | 723 | 723 | 8.23% | 12.99% | 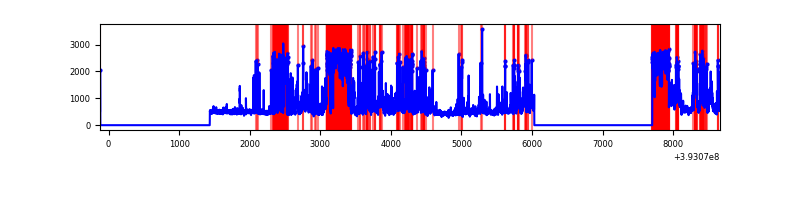 |
| C | 8786 | 5564 | 119 | 119 | 1.35% | 2.14% | 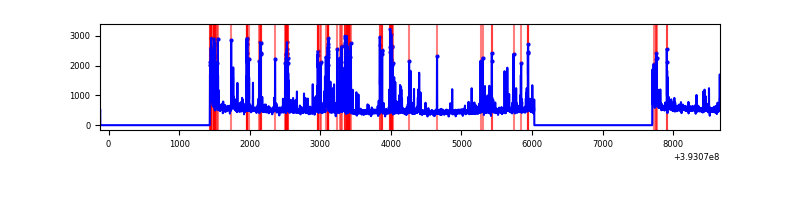 |
| D | 8785 | 5563 | 1134 | 1134 | 12.91% | 20.38% | 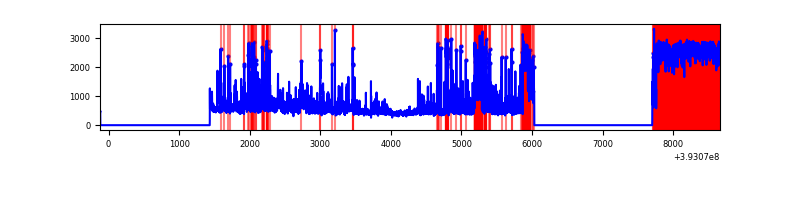 |
Top three noisy pixels from each quadrant. If the there are fewer than three noisy pixels in the level2.evt file, extra rows are filled as -1
| Pixel properties | Quadrant properties | ||||||
|---|---|---|---|---|---|---|---|
| Quadrant | DetID | PixID | Counts | Sigma | Mean | Median | Sigma |
| A | 10 | 83 | 190383 | 1427.24 | 651 | 637 | 132.9 |
| A | 13 | 254 | 7133 | 48.86 | 651 | 637 | 132.9 |
| A | 3 | 137 | 6675 | 45.42 | 651 | 637 | 132.9 |
| B | 4 | 171 | 1719840 | 14710.63 | 600 | 585 | 116.9 |
| B | 5 | 172 | 744366 | 6364.08 | 600 | 585 | 116.9 |
| B | 5 | 236 | 176675 | 1506.69 | 600 | 585 | 116.9 |
| C | 0 | 207 | 581476 | 4017.02 | 617 | 621 | 144.6 |
| C | 15 | 214 | 237979 | 1641.5 | 617 | 621 | 144.6 |
| C | 0 | 10 | 203895 | 1405.78 | 617 | 621 | 144.6 |
| D | 12 | 227 | 2722410 | 19742.82 | 558 | 543 | 137.9 |
| D | 12 | 6 | 504226 | 3653.42 | 558 | 543 | 137.9 |
| D | 2 | 250 | 97050 | 700.0 | 558 | 543 | 137.9 |
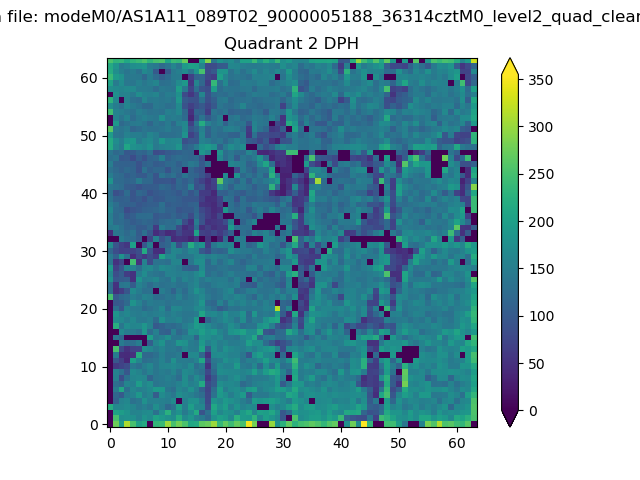
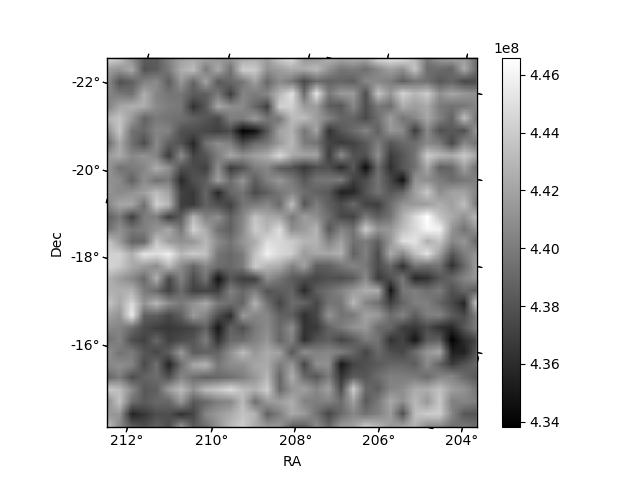
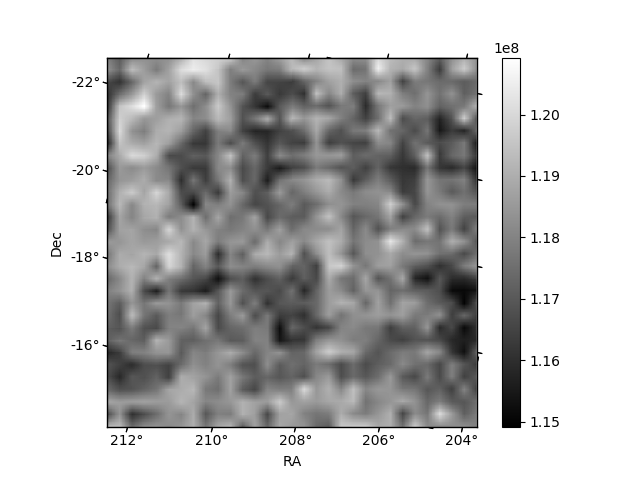
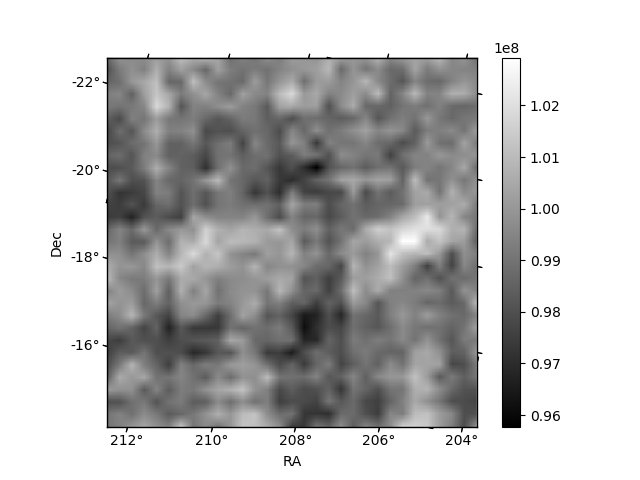
Histogram calculated using DETX and DETY for each event in the final _common_clean file
| Quadrant A | 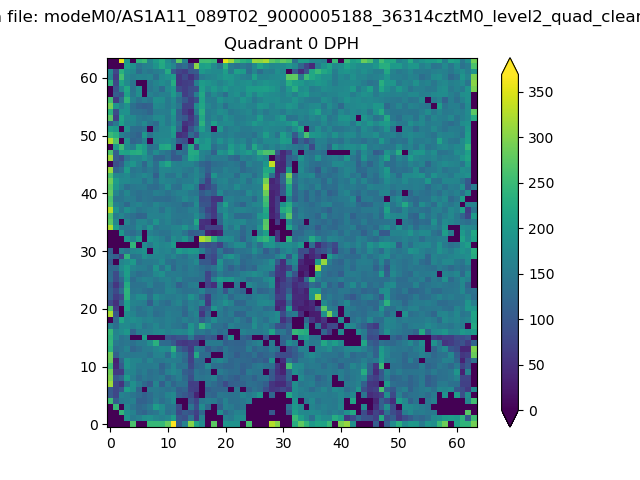 |
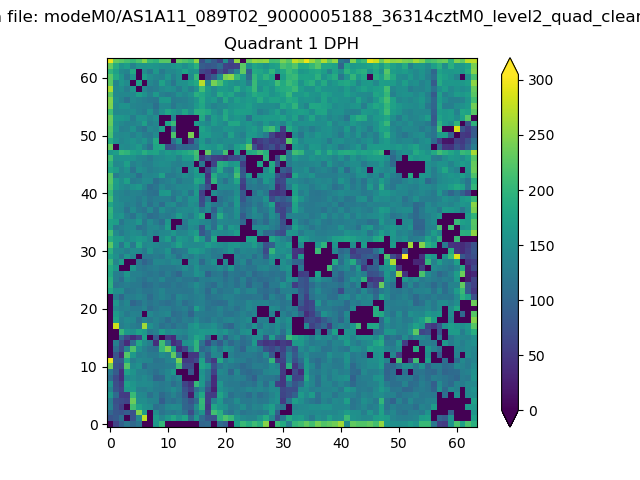 |
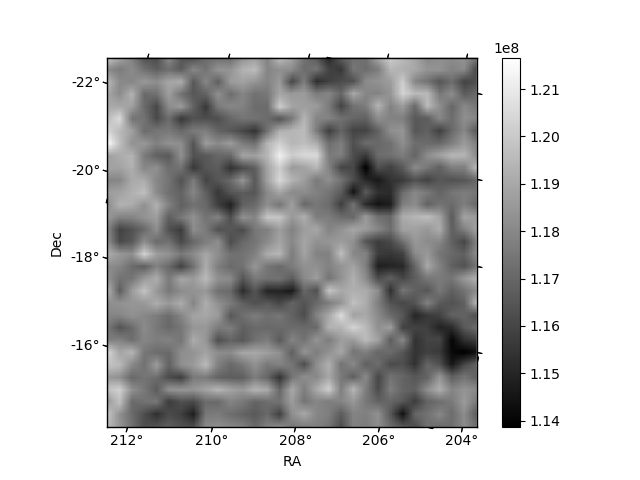
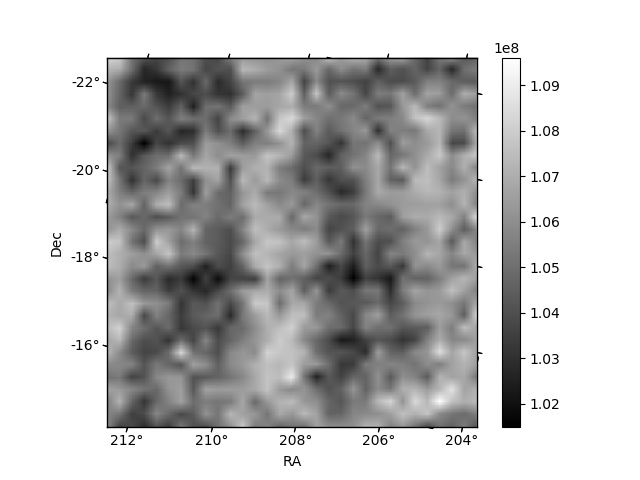
Quadrant B |
|---|---|---|---|
| Quadrant D | 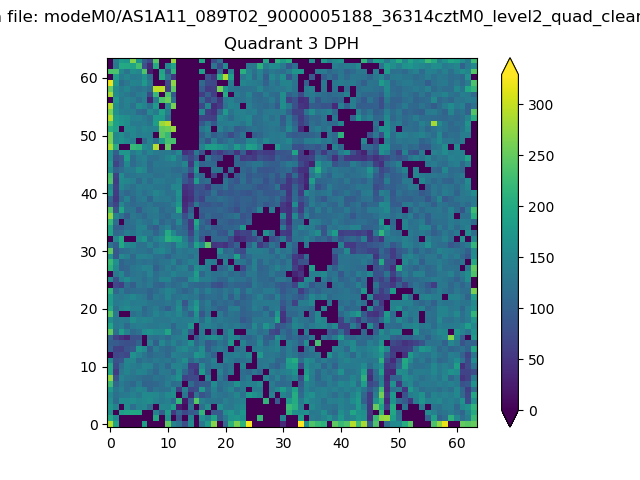 |
 |
Quadrant C |
| Plot type | Count rate plots | Images |
|---|---|---|
| Comparison with Poisson distribution Blue bars denote a histogram of data divided into 1 sec bins. Red curve is a Poisson curve with rate = median count rate of data. |
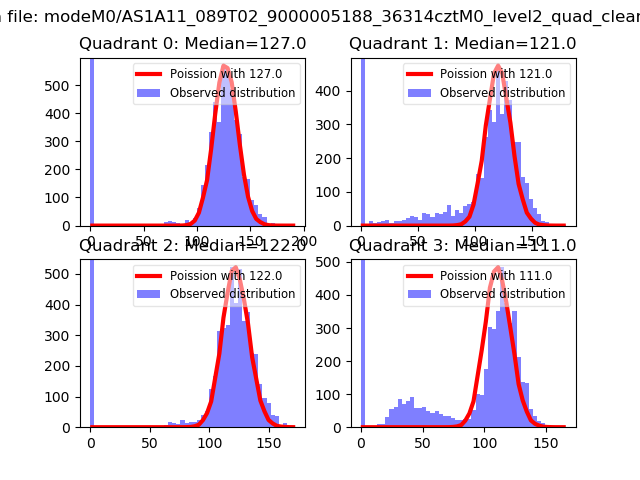 |
 |
| Quadrant-wise count rates Data is divided into 100 sec bins |
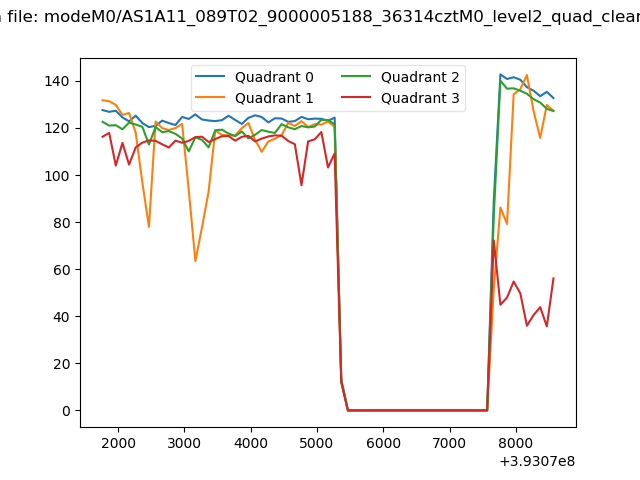 |
|
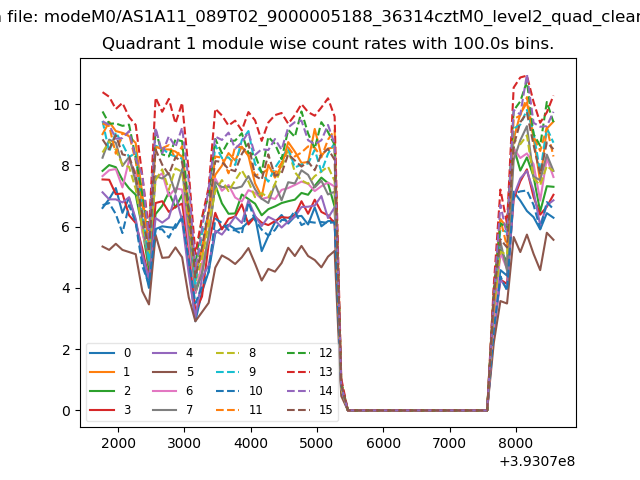
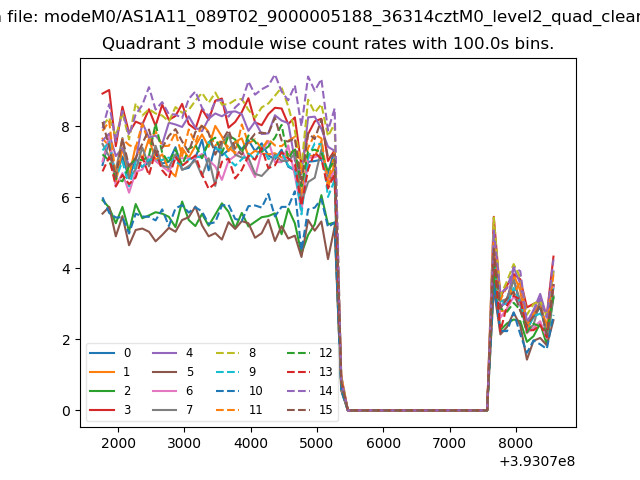
| Module-wise count rates for Quadrant A Data is divided into 100 sec bins |
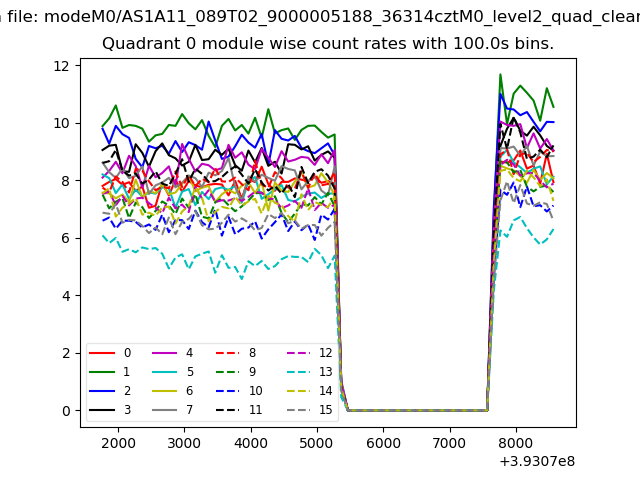 |
 |
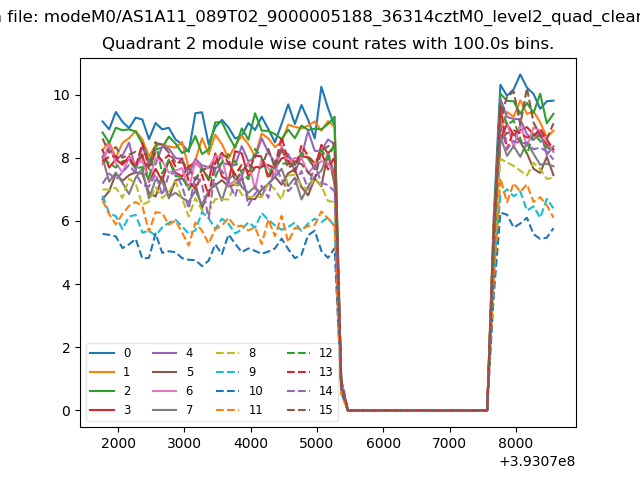
| Module-wise count rates for Quadrant B Data is divided into 100 sec bins |
 |
 |
| Module-wise count rates for Quadrant C Data is divided into 100 sec bins |
 |
 |
| Module-wise count rates for Quadrant D Data is divided into 100 sec bins |
 |
 |
| Parameter | Plot |
|---|---|
| CZT HV Monitor | 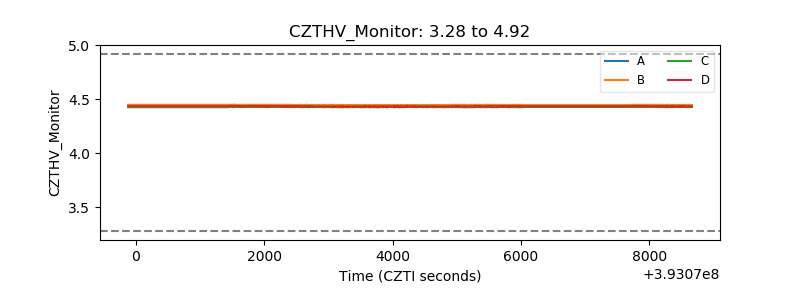 |
| D_VDD | 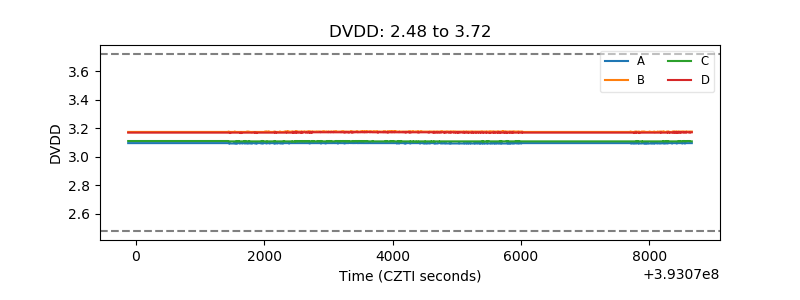 |
| Temperature 1 | 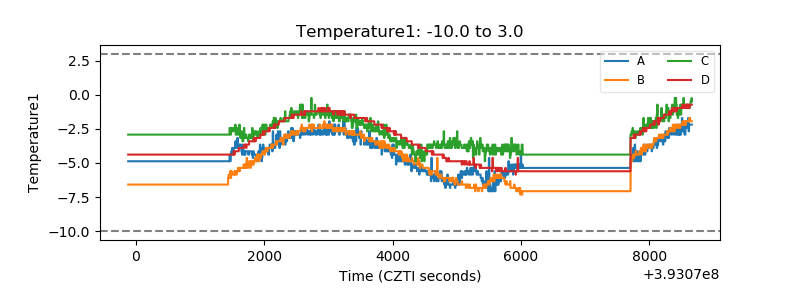 |
| Veto HV Monitor | 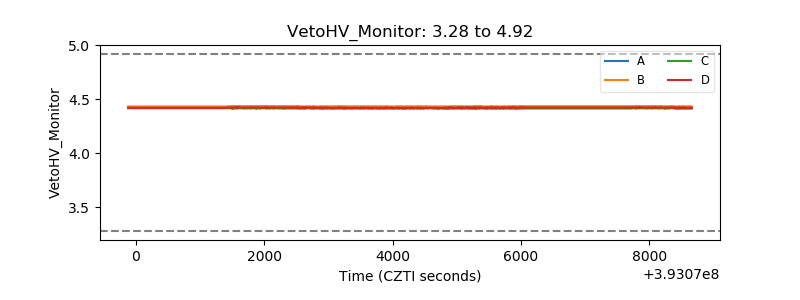 |
| Veto LLD |  |
| Alpha Counter | 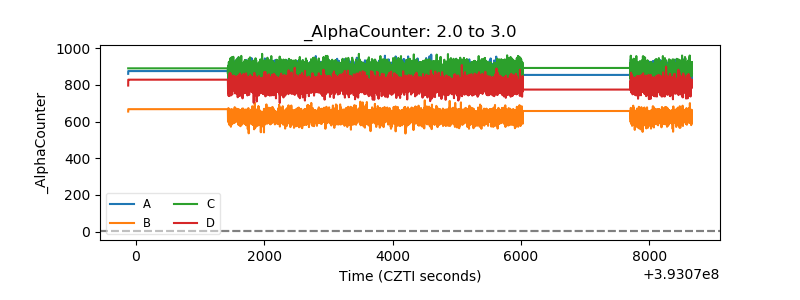 |
| _CPM_Rate | 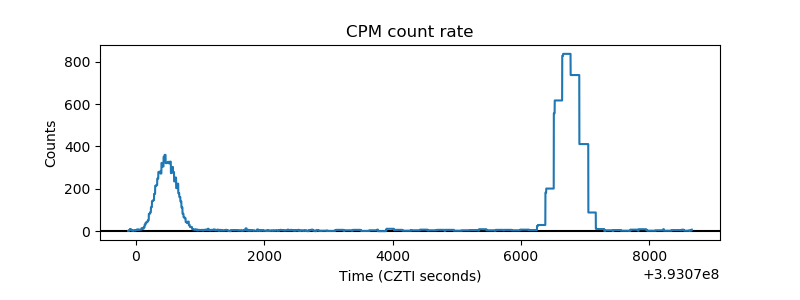 |
| CZT Counter | 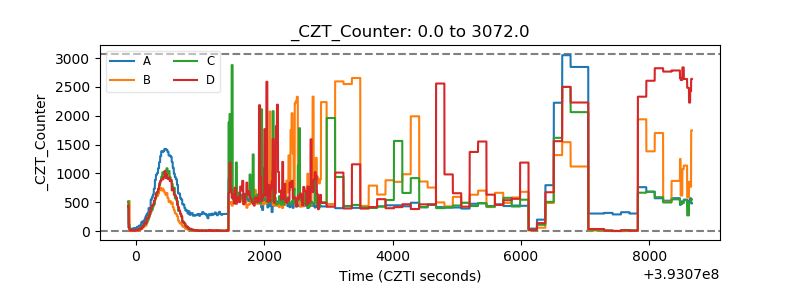 |
| +2.5 Volts monitor | 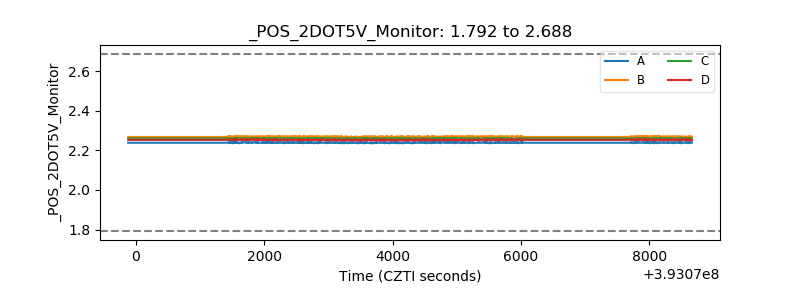 |
| +5 Volts monitor | 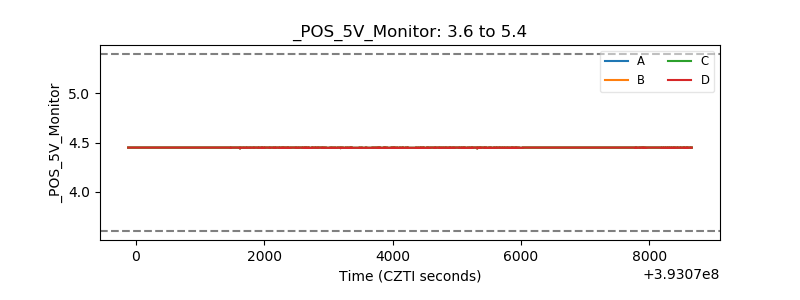 |
| _ROLL_ROT | 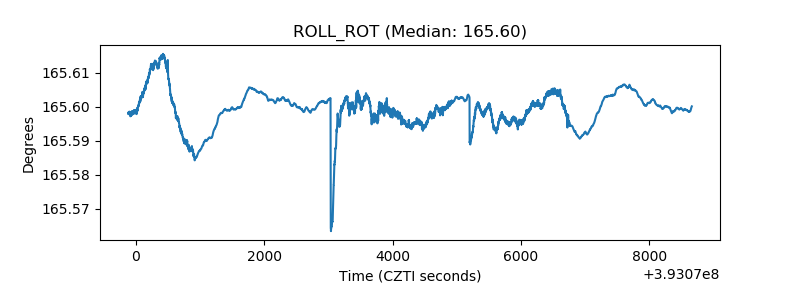 |
| _Roll_DEC | 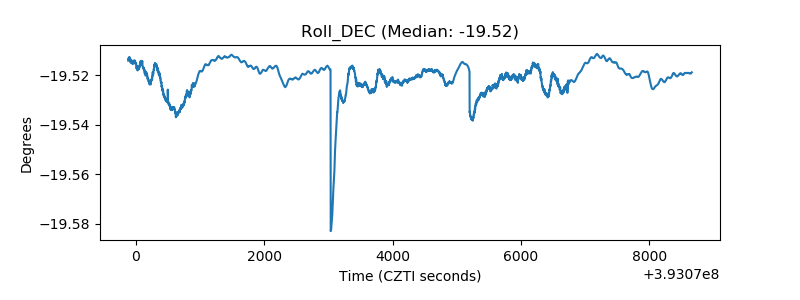 |
| _Roll_RA | 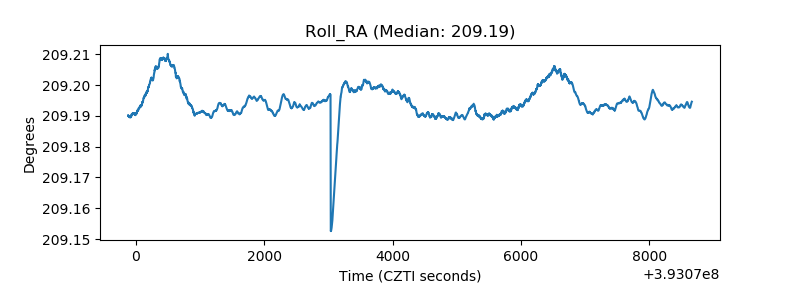 |
| Veto Counter | 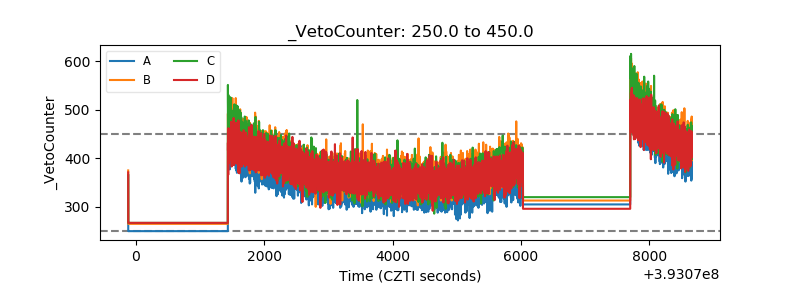 |