| Param | Original file | Final file |
|---|---|---|
| Filename | modeM0/AS1A11_089T02_9000005188_36313cztM0_level2.evt | modeM0/AS1A11_089T02_9000005188_36313cztM0_level2_quad_clean.evt |
| Size (bytes) | 499,426,560 | 79,666,560 |
| Size | 476.3 MB | 76.0 MB |
| Events in quadrant A | 2,792,391 | 526,742 |
| Events in quadrant B | 5,057,788 | 484,075 |
| Events in quadrant C | 3,009,873 | 513,574 |
| Events in quadrant D | 3,875,701 | 486,591 |
| Mode M9 | |||
|---|---|---|---|
| Quadrant | BADHDUFLAG | Total packets | Discarded packets |
| A | 0 | 29 | 0 |
| B | 0 | 29 | 0 |
| C | 0 | 29 | 0 |
| D | 0 | 29 | 0 |
| Mode M0 | |||
|---|---|---|---|
| Quadrant | BADHDUFLAG | Total packets | Discarded packets |
| A | 0 | 11922 | 3 |
| B | 0 | 18701 | 2 |
| C | 0 | 12475 | 2 |
| D | 0 | 15337 | 2 |
| Mode SS | |||
|---|---|---|---|
| Quadrant | BADHDUFLAG | Total packets | Discarded packets |
| A | 0 | 116 | 0 |
| B | 0 | 116 | 0 |
| C | 0 | 116 | 0 |
| D | 0 | 116 | 0 |
| Quadrant | Total seconds | Saturated seconds | Saturation percentage |
|---|---|---|---|
| A | 5739 | 9 | 0.156822% |
| B | 5739 | 797 | 13.887437% |
| C | 5739 | 68 | 1.184875% |
| D | 5739 | 213 | 3.711448% |
Noise dominated data is calculated using 1-second bins in cleaned event files. If a bin has >2000 counts, and if more than 50% of those come from <1% of pixels, then it is considered to be noise-dominated and hence unusable.
| Quadrant | # 1 sec bins | Bins with >0 counts | Bins with >2000 counts | High rate bins dominated by noise | Noise dominated (total time) | Noise dominated (detector-on time) | Marked lightcurve |
|---|---|---|---|---|---|---|---|
| A | 7291 | 5740 | 1 | 1 | 0.01% | 0.02% | 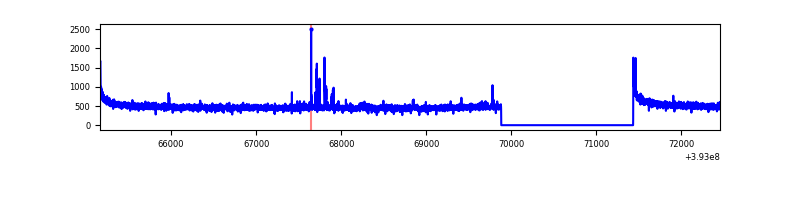 |
| B | 7291 | 5740 | 723 | 723 | 9.92% | 12.60% | 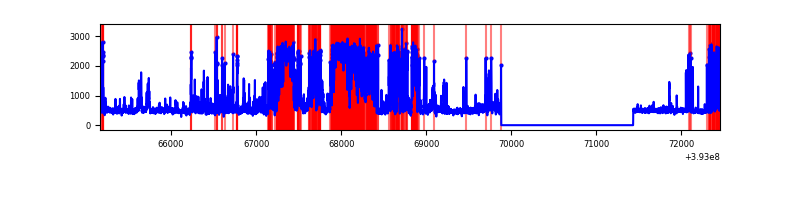 |
| C | 7291 | 5740 | 51 | 51 | 0.70% | 0.89% | 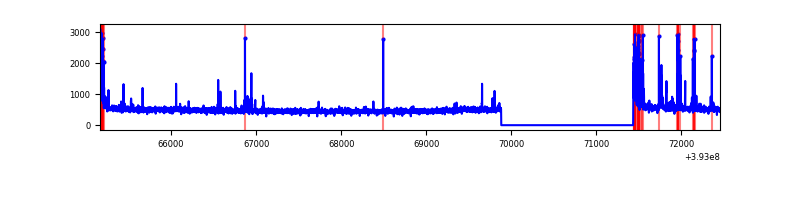 |
| D | 7291 | 5740 | 195 | 195 | 2.67% | 3.40% | 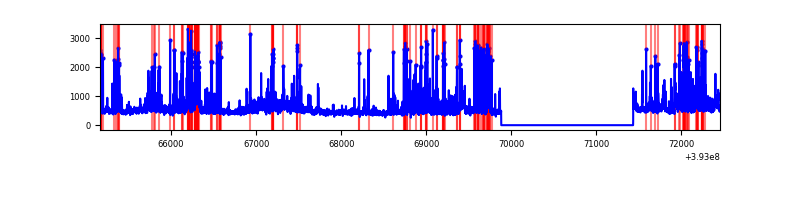 |
Top three noisy pixels from each quadrant. If the there are fewer than three noisy pixels in the level2.evt file, extra rows are filled as -1
| Pixel properties | Quadrant properties | ||||||
|---|---|---|---|---|---|---|---|
| Quadrant | DetID | PixID | Counts | Sigma | Mean | Median | Sigma |
| A | 10 | 83 | 190387 | 1402.21 | 661 | 648 | 135.3 |
| A | 7 | 3 | 30703 | 222.11 | 661 | 648 | 135.3 |
| A | 9 | 143 | 11643 | 81.25 | 661 | 648 | 135.3 |
| B | 5 | 172 | 1815820 | 15069.42 | 620 | 603 | 120.5 |
| B | 4 | 171 | 513972 | 4261.85 | 620 | 603 | 120.5 |
| B | 5 | 236 | 120469 | 995.09 | 620 | 603 | 120.5 |
| C | 15 | 214 | 246770 | 1657.0 | 633 | 637 | 148.5 |
| C | 0 | 10 | 189285 | 1270.0 | 633 | 637 | 148.5 |
| C | 0 | 207 | 100025 | 669.09 | 633 | 637 | 148.5 |
| D | 12 | 6 | 813400 | 5150.41 | 632 | 613 | 157.8 |
| D | 12 | 235 | 256099 | 1618.95 | 632 | 613 | 157.8 |
| D | 12 | 227 | 128138 | 808.09 | 632 | 613 | 157.8 |
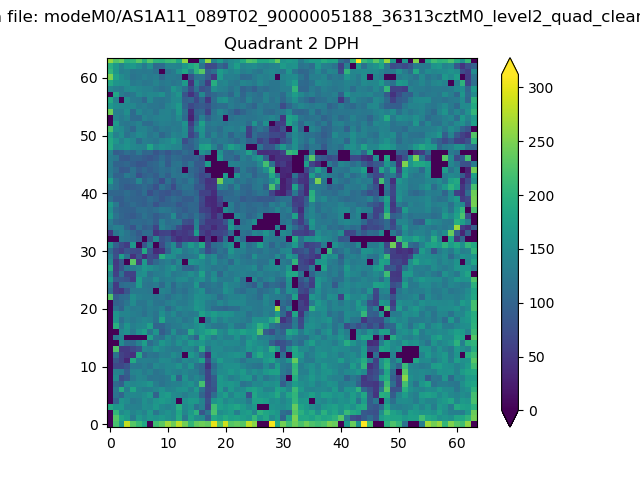
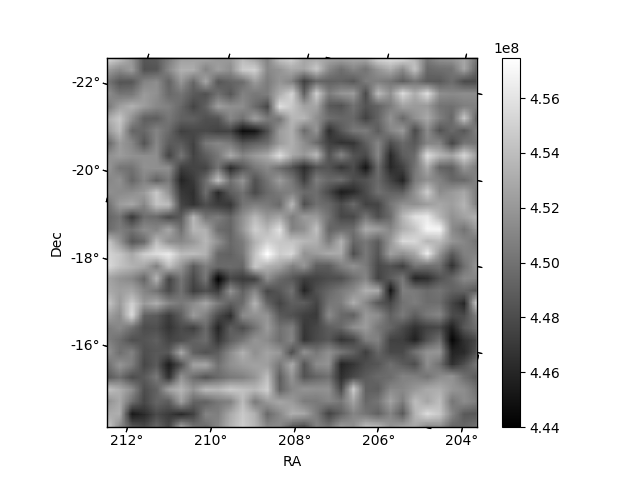
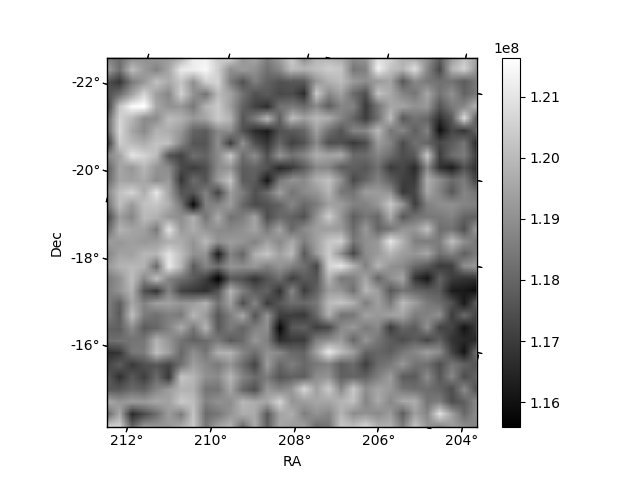
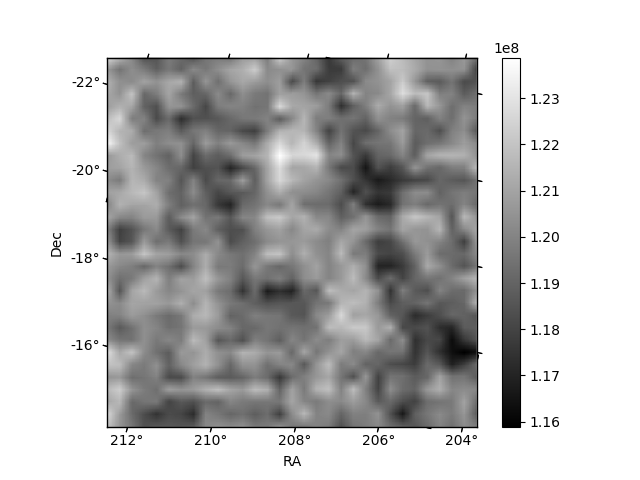
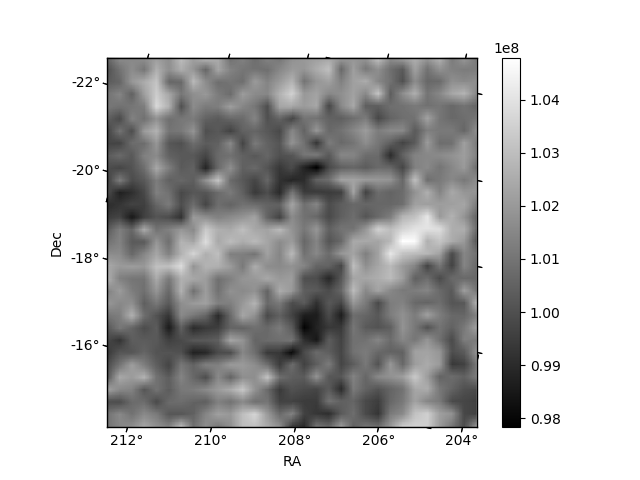
Histogram calculated using DETX and DETY for each event in the final _common_clean file
| Quadrant A | 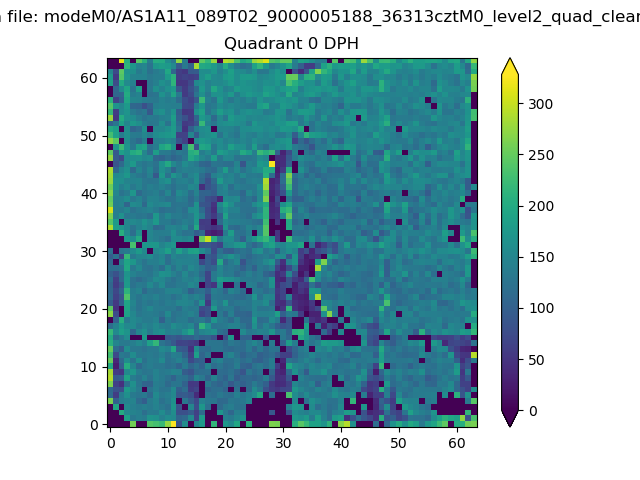 |
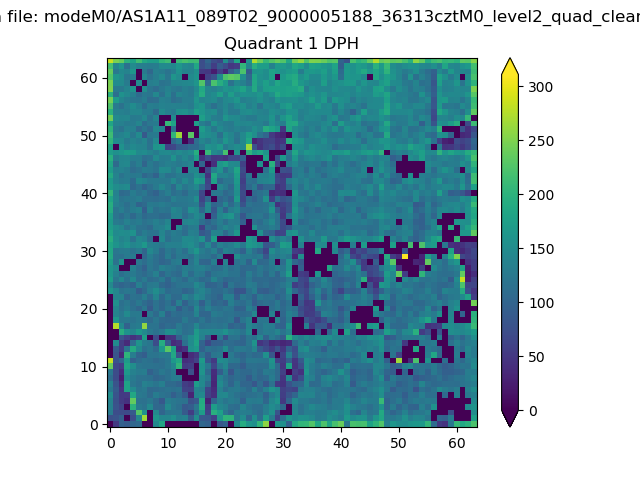 |
Quadrant B |
|---|---|---|---|
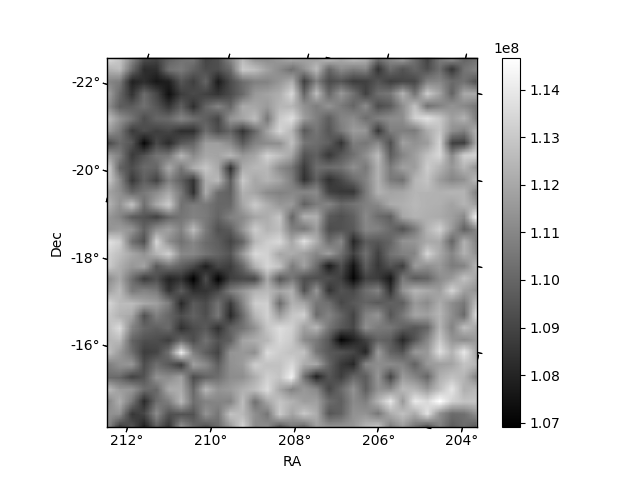
| Quadrant D | 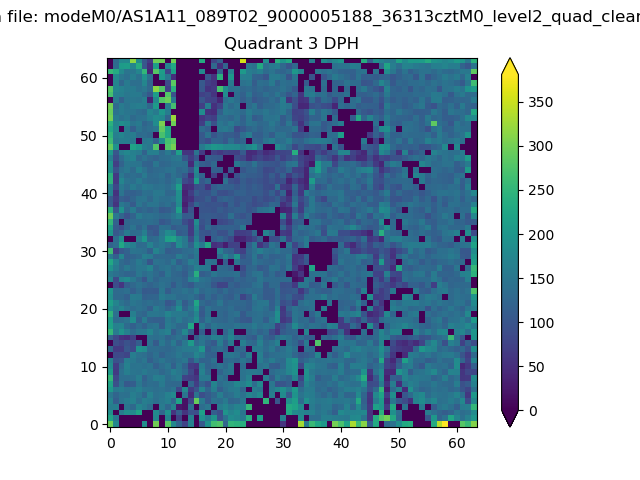 |
 |
Quadrant C |
| Plot type | Count rate plots | Images |
|---|---|---|
| Comparison with Poisson distribution Blue bars denote a histogram of data divided into 1 sec bins. Red curve is a Poisson curve with rate = median count rate of data. |
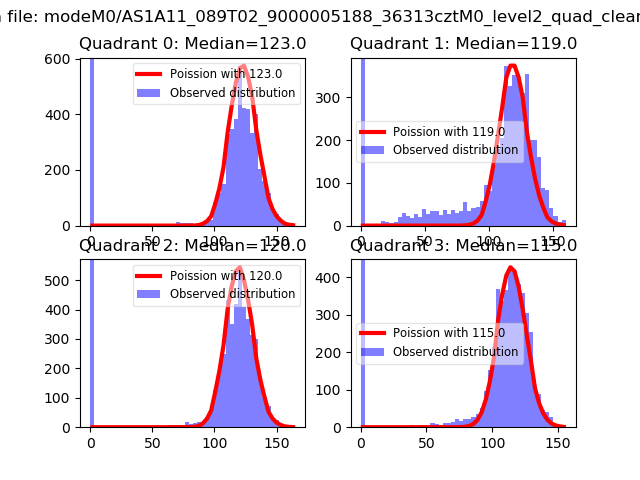 |
 |
| Quadrant-wise count rates Data is divided into 100 sec bins |
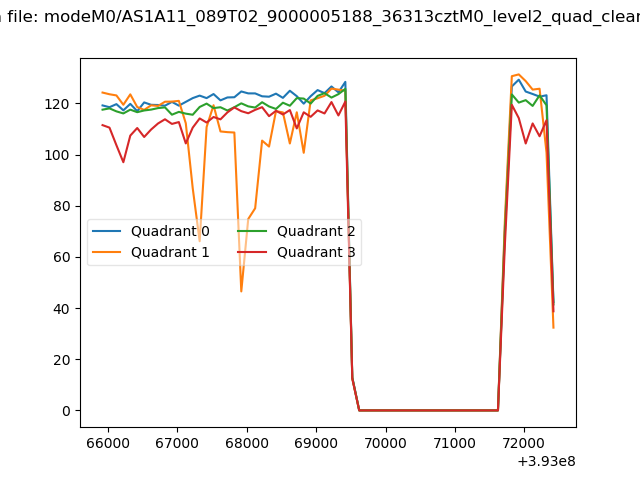 |
|
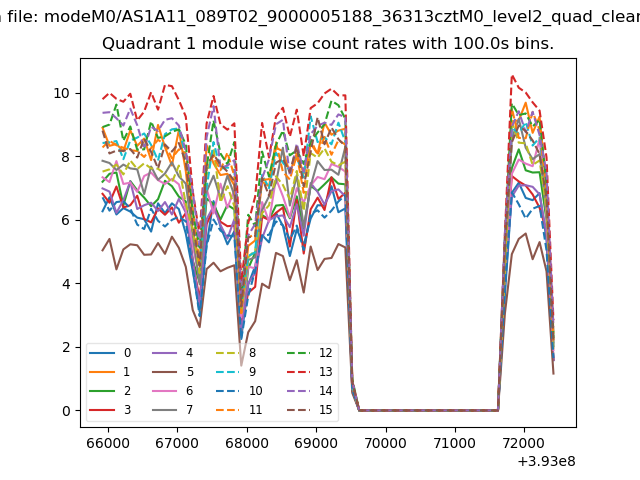
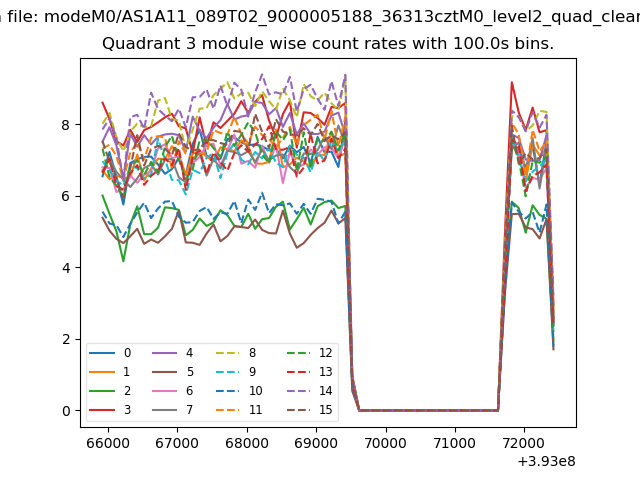
| Module-wise count rates for Quadrant A Data is divided into 100 sec bins |
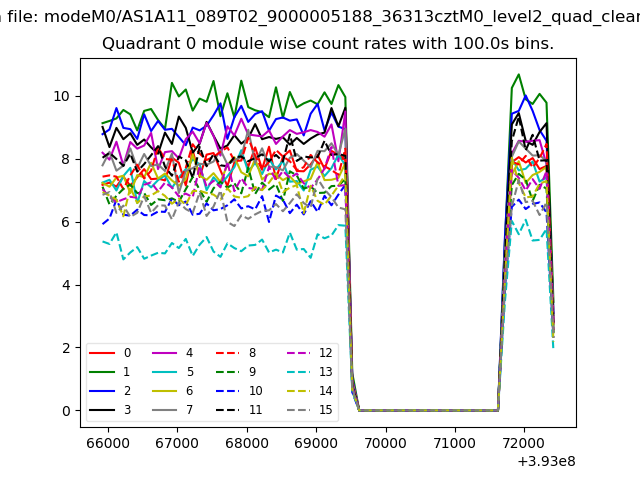 |
 |
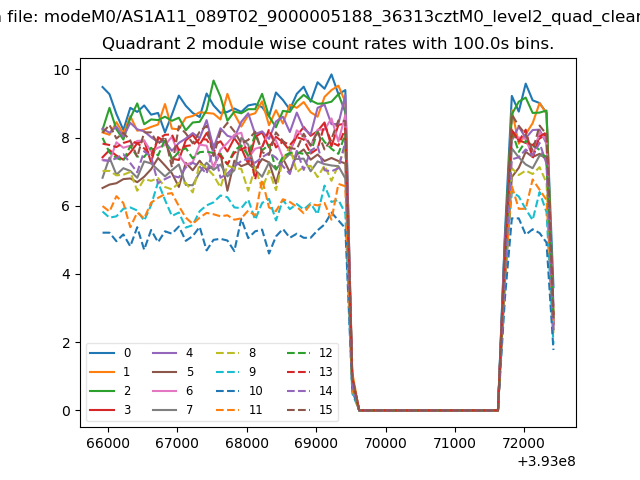
| Module-wise count rates for Quadrant B Data is divided into 100 sec bins |
 |
 |
| Module-wise count rates for Quadrant C Data is divided into 100 sec bins |
 |
 |
| Module-wise count rates for Quadrant D Data is divided into 100 sec bins |
 |
 |
| Parameter | Plot |
|---|---|
| CZT HV Monitor | 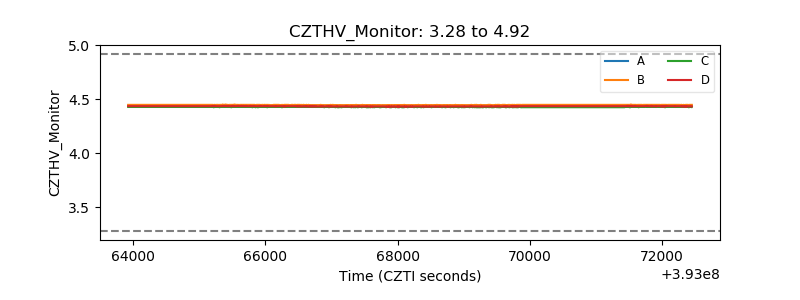 |
| D_VDD | 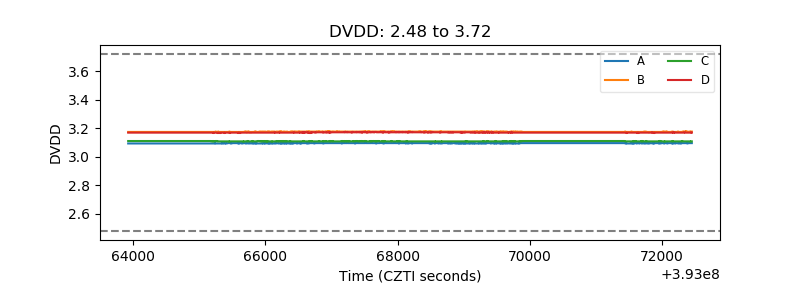 |
| Temperature 1 | 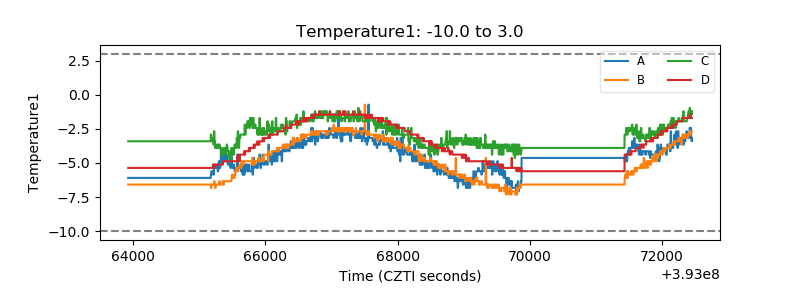 |
| Veto HV Monitor | 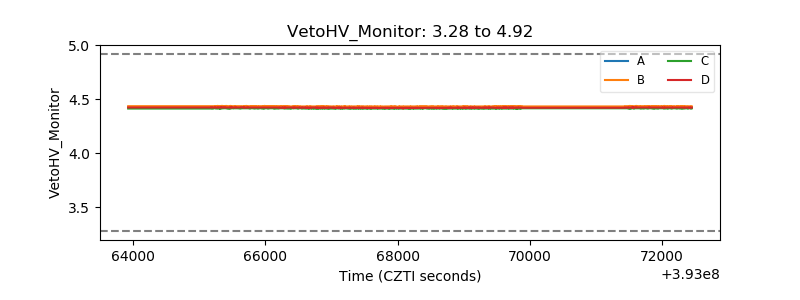 |
| Veto LLD | 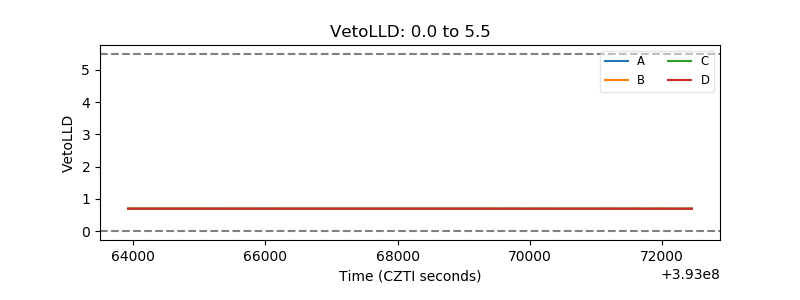 |
| Alpha Counter | 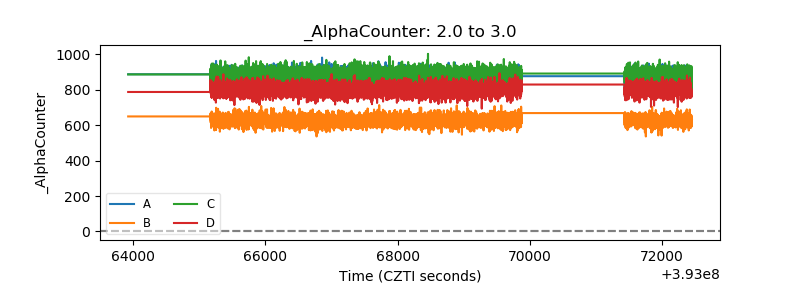 |
| _CPM_Rate | 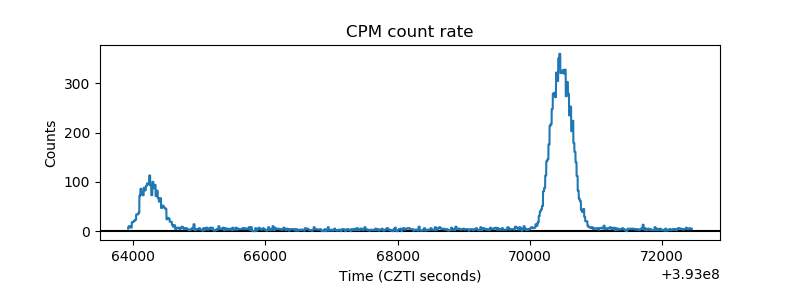 |
| CZT Counter | 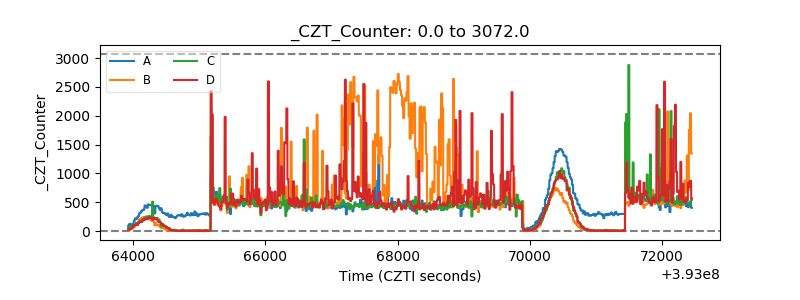 |
| +2.5 Volts monitor | 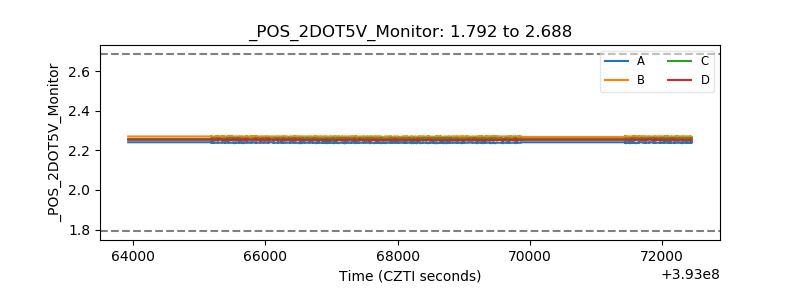 |
| +5 Volts monitor | 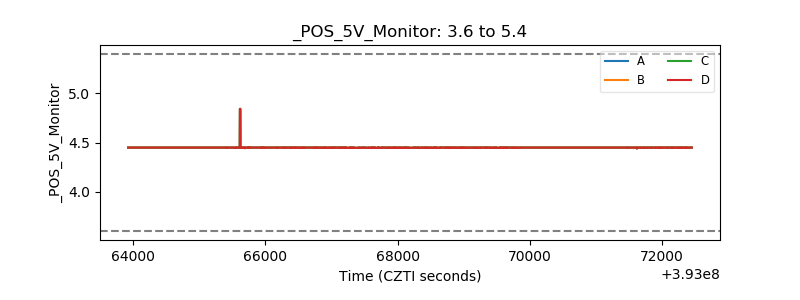 |
| _ROLL_ROT | 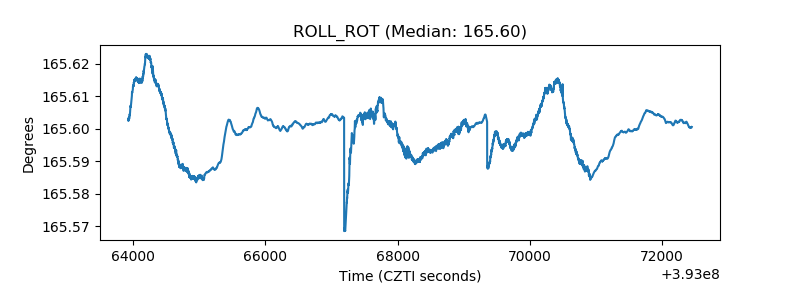 |
| _Roll_DEC | 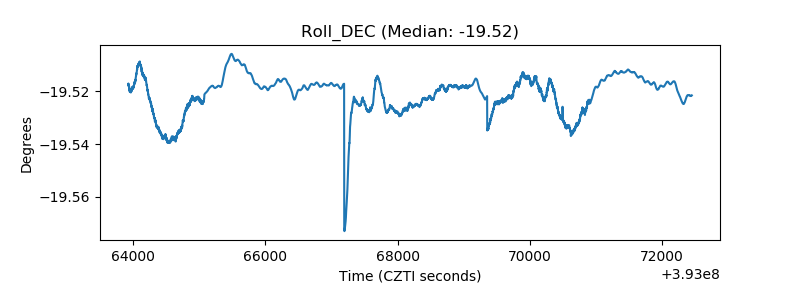 |
| _Roll_RA | 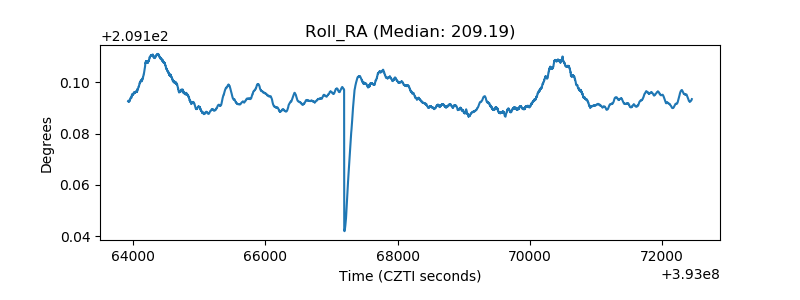 |
| Veto Counter | 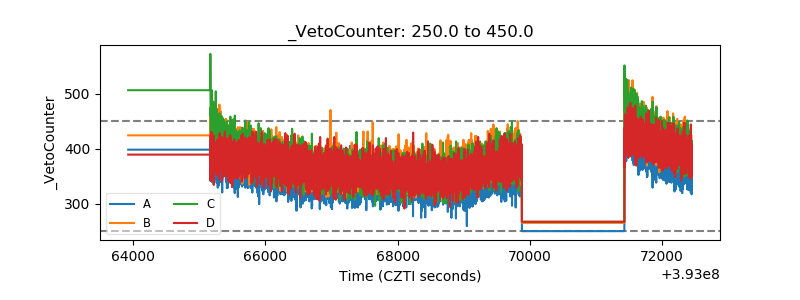 |