| Param | Original file | Final file |
|---|---|---|
| Filename | modeM0/AS1A11_089T02_9000005188_36307cztM0_level2.evt | modeM0/AS1A11_089T02_9000005188_36307cztM0_level2_quad_clean.evt |
| Size (bytes) | 483,505,920 | 57,352,320 |
| Size | 461.1 MB | 54.7 MB |
| Events in quadrant A | 2,511,333 | 358,400 |
| Events in quadrant B | 3,644,304 | 349,962 |
| Events in quadrant C | 2,698,465 | 349,936 |
| Events in quadrant D | 5,438,125 | 315,330 |
| Mode M9 | |||
|---|---|---|---|
| Quadrant | BADHDUFLAG | Total packets | Discarded packets |
| A | 0 | 36 | 0 |
| B | 0 | 36 | 0 |
| C | 0 | 36 | 0 |
| D | 0 | 37 | 0 |
| Mode M0 | |||
|---|---|---|---|
| Quadrant | BADHDUFLAG | Total packets | Discarded packets |
| A | 0 | 10790 | 3 |
| B | 0 | 14200 | 2 |
| C | 0 | 11179 | 2 |
| D | 0 | 19753 | 2 |
| Mode SS | |||
|---|---|---|---|
| Quadrant | BADHDUFLAG | Total packets | Discarded packets |
| A | 0 | 106 | 0 |
| B | 0 | 106 | 0 |
| C | 0 | 106 | 0 |
| D | 0 | 106 | 0 |
| Quadrant | Total seconds | Saturated seconds | Saturation percentage |
|---|---|---|---|
| A | 5173 | 9 | 0.173980% |
| B | 5173 | 321 | 6.205297% |
| C | 5173 | 40 | 0.773246% |
| D | 5173 | 518 | 10.013532% |
Noise dominated data is calculated using 1-second bins in cleaned event files. If a bin has >2000 counts, and if more than 50% of those come from <1% of pixels, then it is considered to be noise-dominated and hence unusable.
| Quadrant | # 1 sec bins | Bins with >0 counts | Bins with >2000 counts | High rate bins dominated by noise | Noise dominated (total time) | Noise dominated (detector-on time) | Marked lightcurve |
|---|---|---|---|---|---|---|---|
| A | 7116 | 5174 | 4 | 4 | 0.06% | 0.08% | 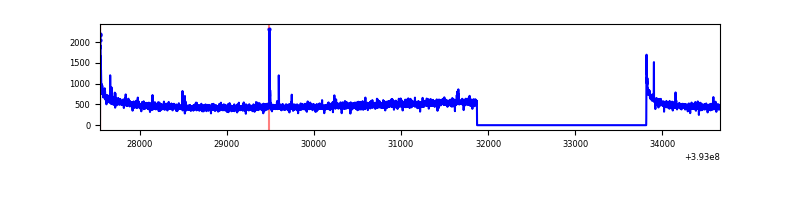 |
| B | 7116 | 5174 | 259 | 259 | 3.64% | 5.01% | 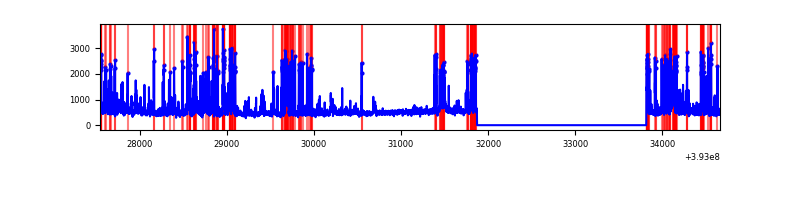 |
| C | 7116 | 5174 | 44 | 44 | 0.62% | 0.85% | 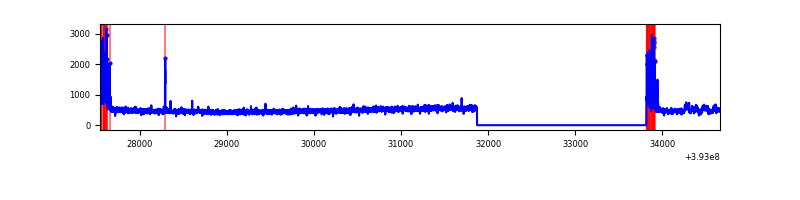 |
| D | 7116 | 5174 | 622 | 622 | 8.74% | 12.02% | 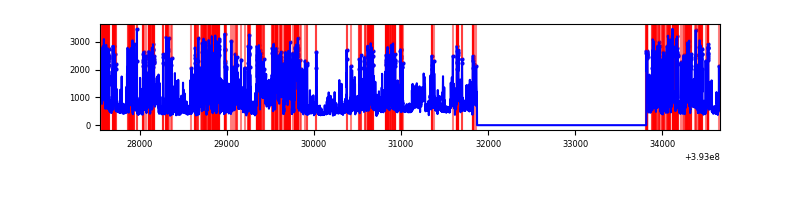 |
Top three noisy pixels from each quadrant. If the there are fewer than three noisy pixels in the level2.evt file, extra rows are filled as -1
| Pixel properties | Quadrant properties | ||||||
|---|---|---|---|---|---|---|---|
| Quadrant | DetID | PixID | Counts | Sigma | Mean | Median | Sigma |
| A | 10 | 83 | 176471 | 1491.09 | 589 | 578 | 118.0 |
| A | 15 | 223 | 37486 | 312.88 | 589 | 578 | 118.0 |
| A | 13 | 254 | 7796 | 61.19 | 589 | 578 | 118.0 |
| B | 5 | 172 | 766704 | 6960.7 | 573 | 558 | 110.1 |
| B | 5 | 236 | 369769 | 3354.41 | 573 | 558 | 110.1 |
| B | 4 | 171 | 79808 | 720.01 | 573 | 558 | 110.1 |
| C | 15 | 214 | 219225 | 1649.3 | 568 | 574 | 132.6 |
| C | 0 | 10 | 215529 | 1621.42 | 568 | 574 | 132.6 |
| C | 0 | 207 | 29579 | 218.79 | 568 | 574 | 132.6 |
| D | 7 | 223 | 1685391 | 12533.3 | 545 | 532 | 134.4 |
| D | 12 | 6 | 871058 | 6475.66 | 545 | 532 | 134.4 |
| D | 12 | 235 | 239659 | 1778.81 | 545 | 532 | 134.4 |
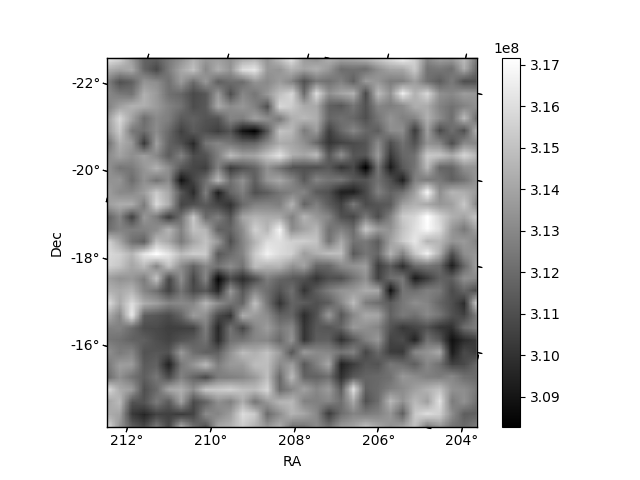
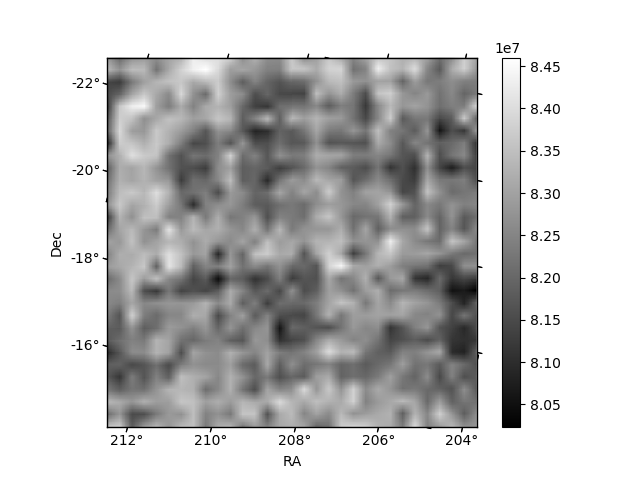
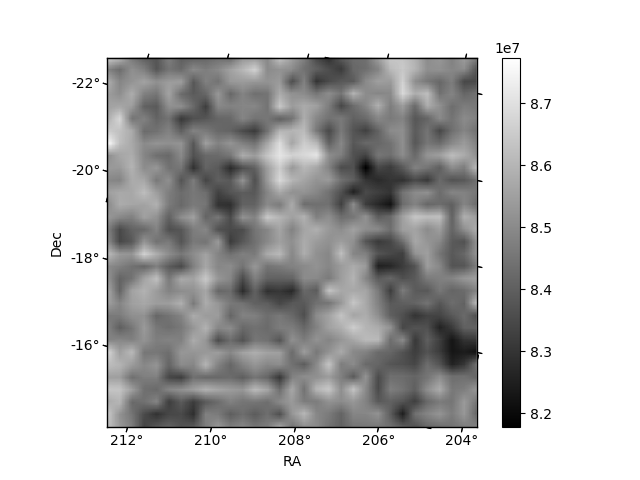
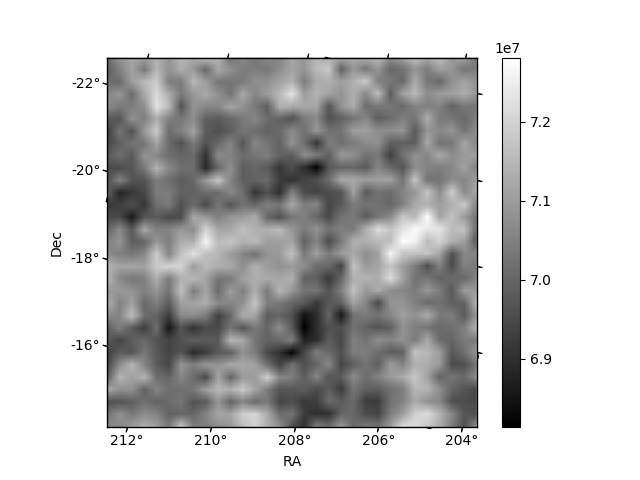
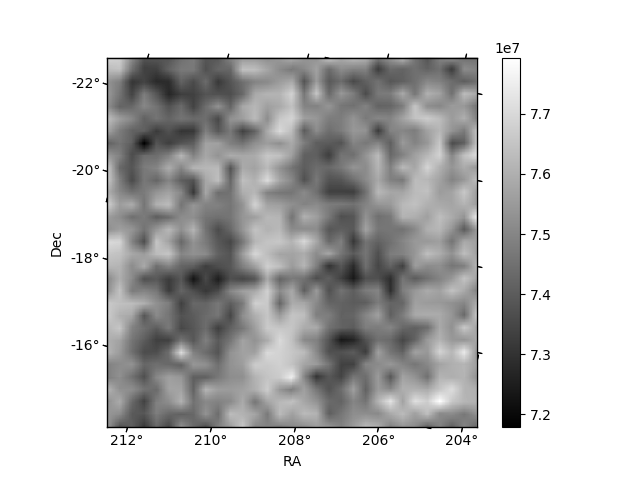
Histogram calculated using DETX and DETY for each event in the final _common_clean file
| Quadrant A | 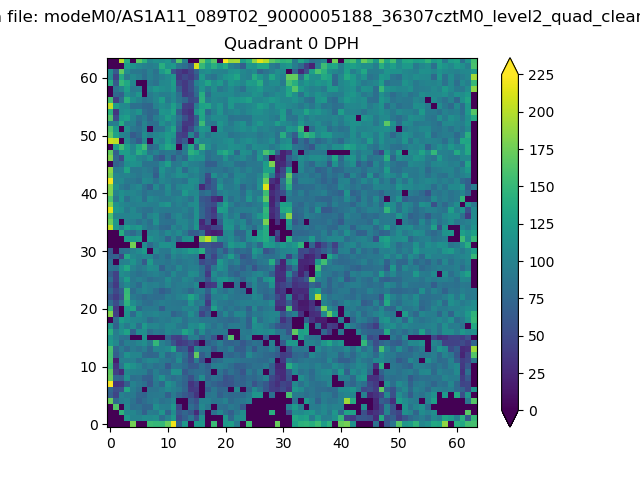 |
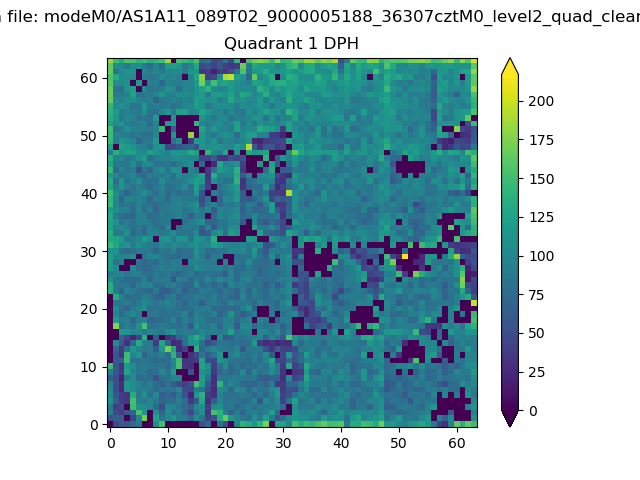 |
Quadrant B |
|---|---|---|---|
| Quadrant D | 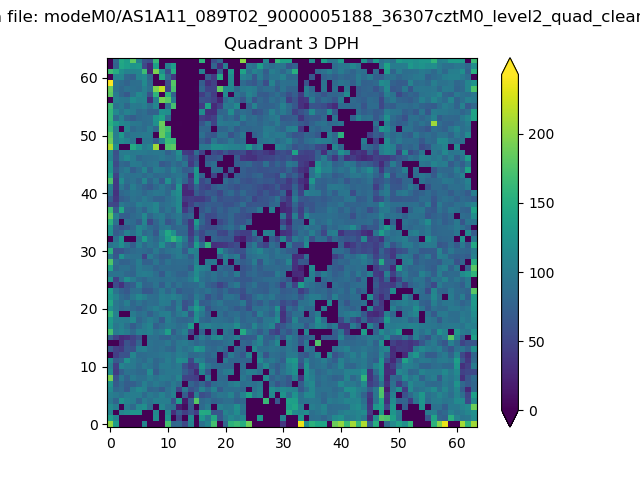 |
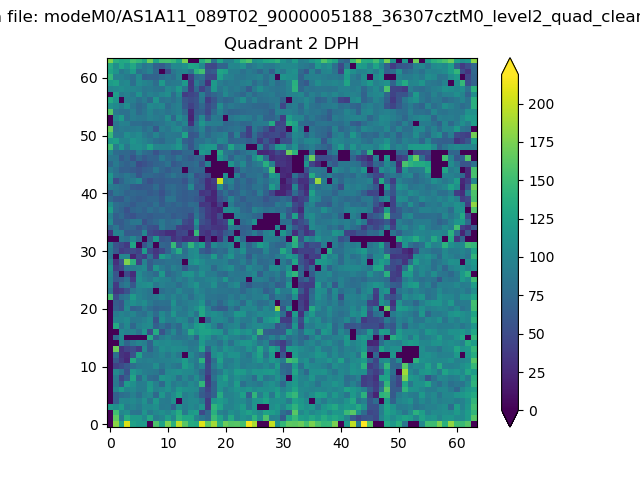 |
Quadrant C |
| Plot type | Count rate plots | Images |
|---|---|---|
| Comparison with Poisson distribution Blue bars denote a histogram of data divided into 1 sec bins. Red curve is a Poisson curve with rate = median count rate of data. |
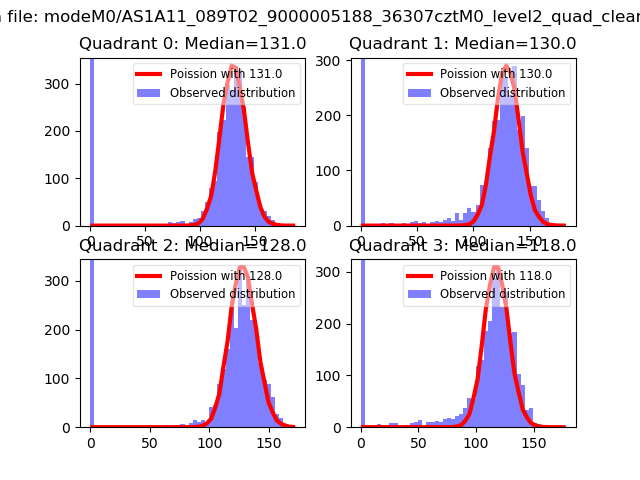 |
 |
| Quadrant-wise count rates Data is divided into 100 sec bins |
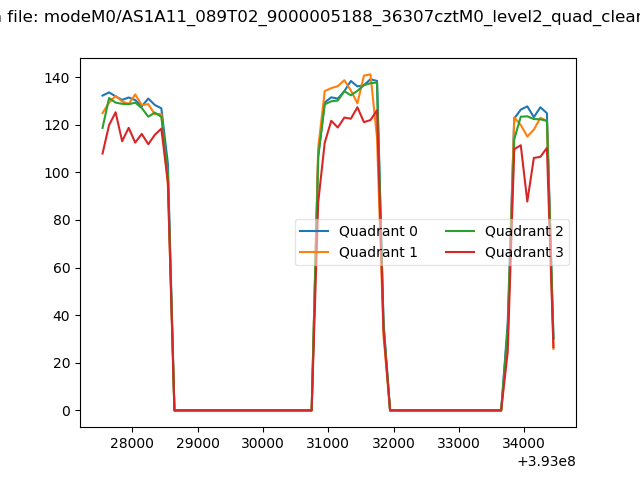 |
|
| Module-wise count rates for Quadrant A Data is divided into 100 sec bins |
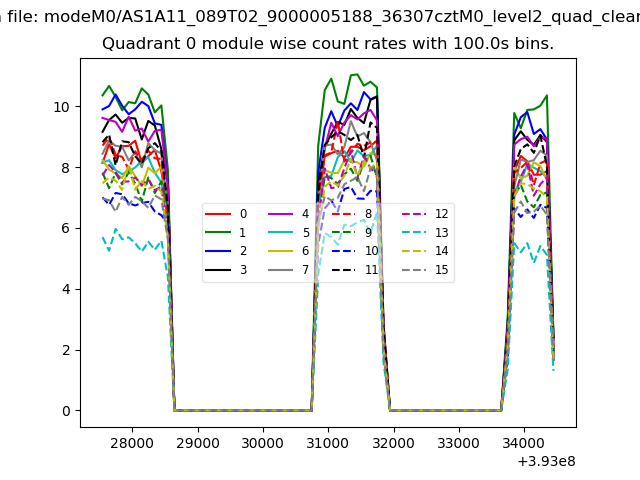 |
 |
| Module-wise count rates for Quadrant B Data is divided into 100 sec bins |
 |
 |
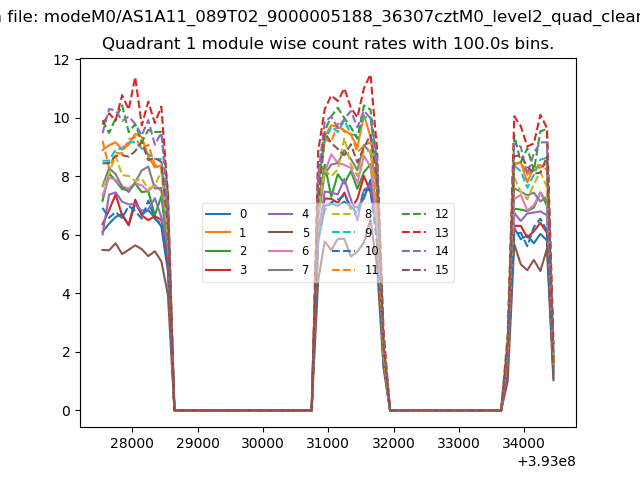
| Module-wise count rates for Quadrant C Data is divided into 100 sec bins |
 |
 |
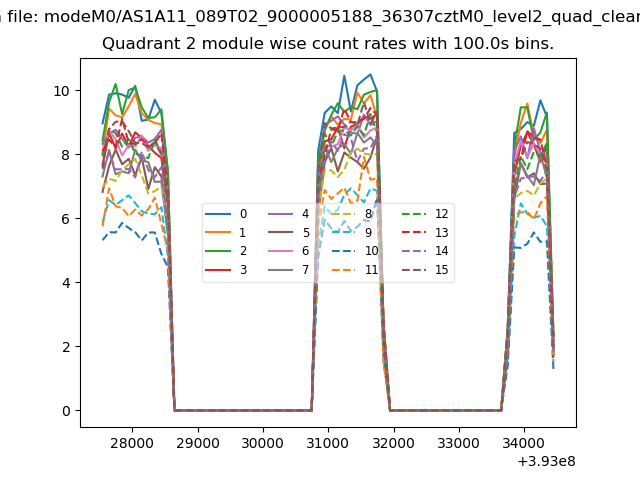
| Module-wise count rates for Quadrant D Data is divided into 100 sec bins |
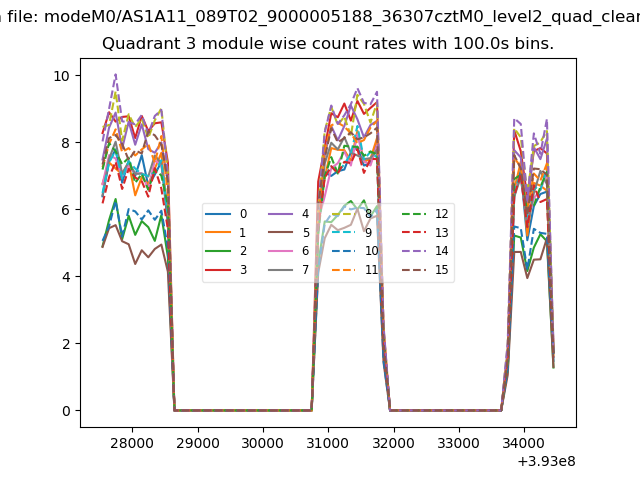 |
 |
| Parameter | Plot |
|---|---|
| CZT HV Monitor | 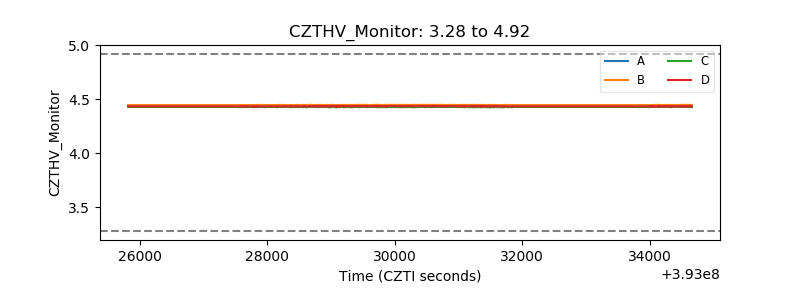 |
| D_VDD | 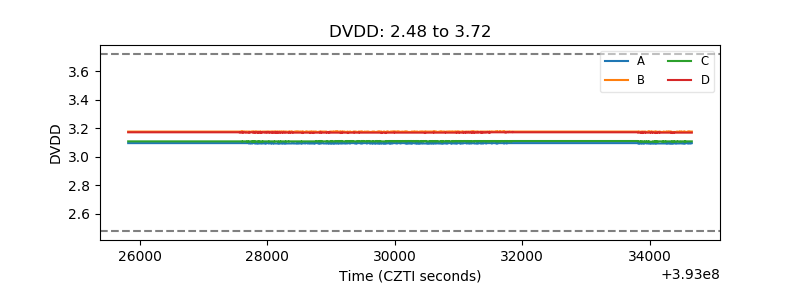 |
| Temperature 1 | 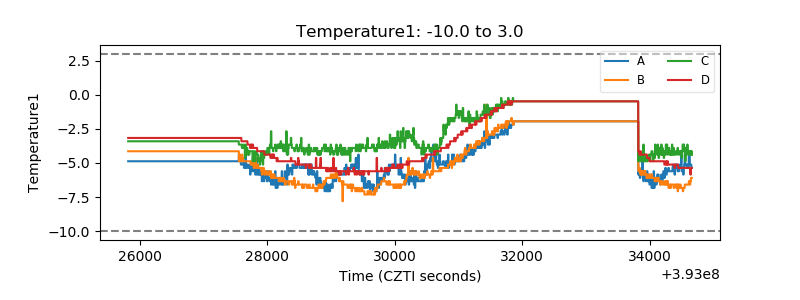 |
| Veto HV Monitor | 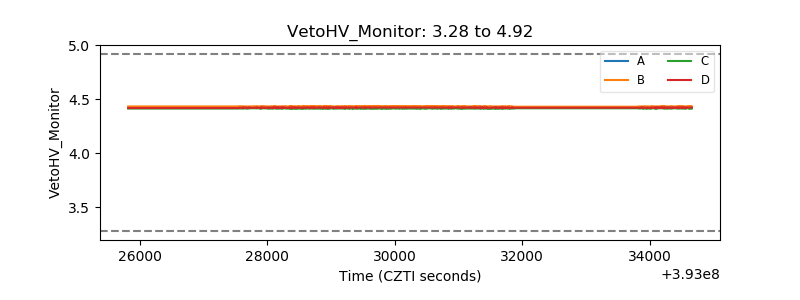 |
| Veto LLD | 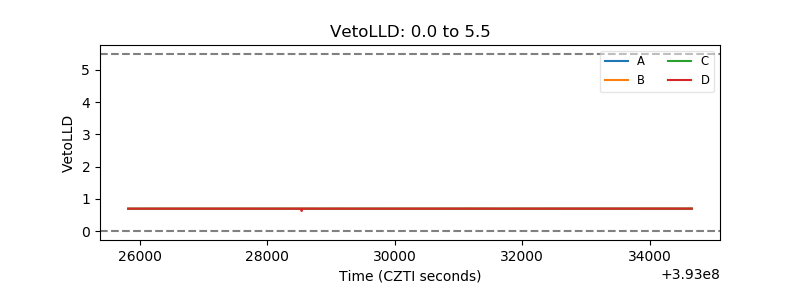 |
| Alpha Counter | 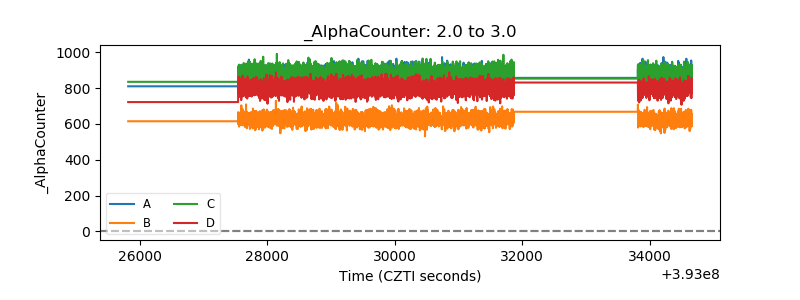 |
| _CPM_Rate | 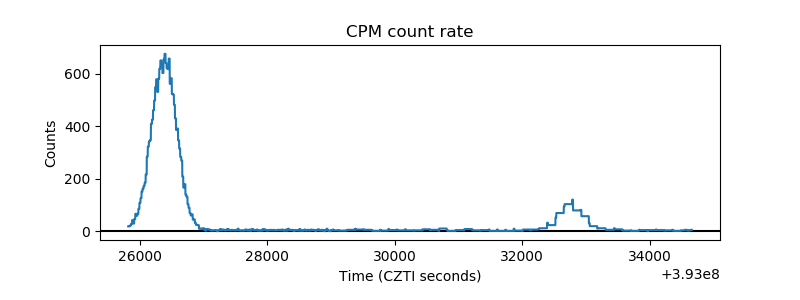 |
| CZT Counter | 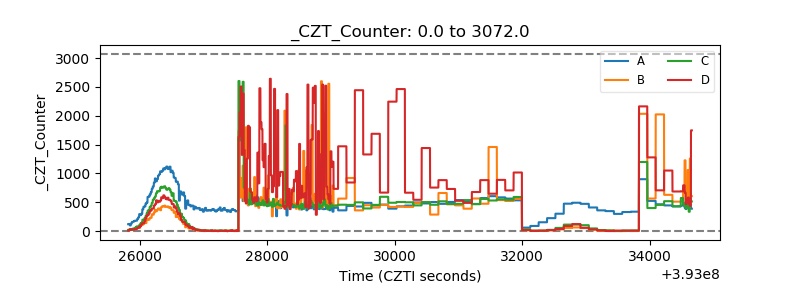 |
| +2.5 Volts monitor | 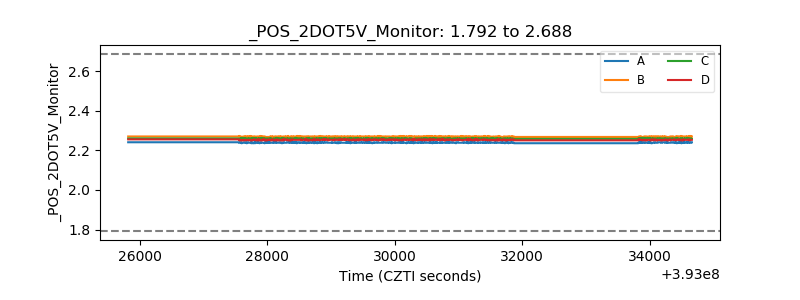 |
| +5 Volts monitor | 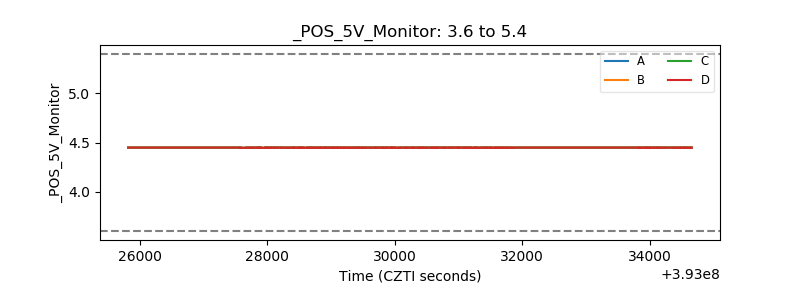 |
| _ROLL_ROT | 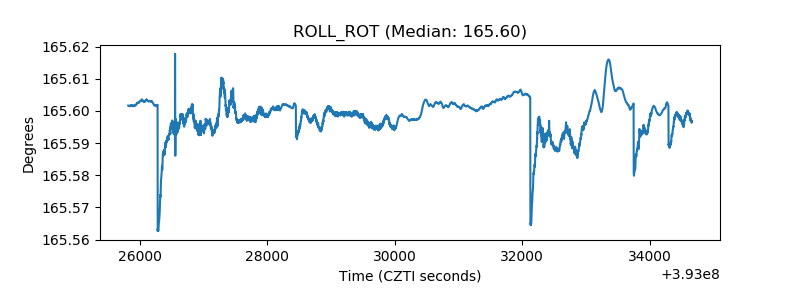 |
| _Roll_DEC | 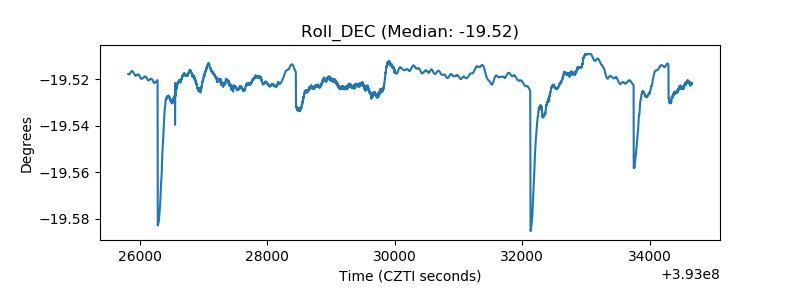 |
| _Roll_RA | 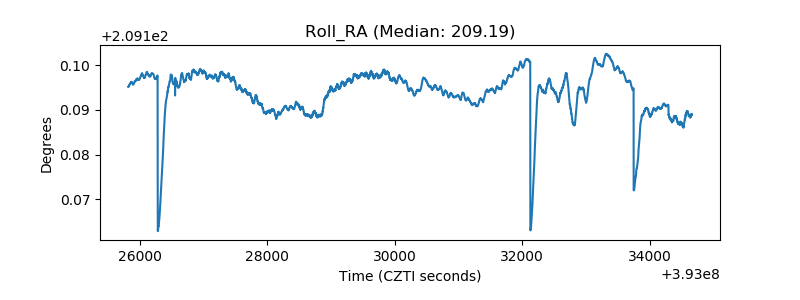 |
| Veto Counter | 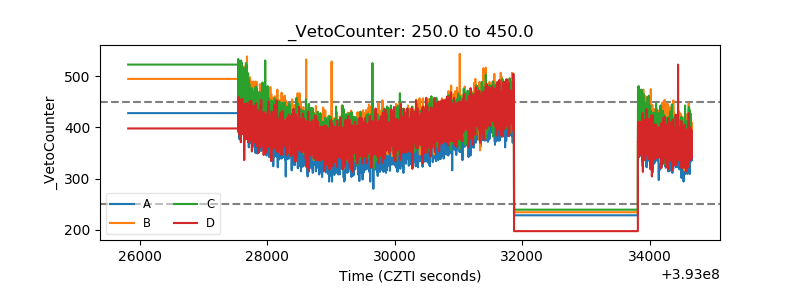 |