| Param | Original file | Final file |
|---|---|---|
| Filename | modeM0/AS1A11_089T02_9000005188_36306cztM0_level2.evt | modeM0/AS1A11_089T02_9000005188_36306cztM0_level2_quad_clean.evt |
| Size (bytes) | 462,165,120 | 56,520,000 |
| Size | 440.8 MB | 53.9 MB |
| Events in quadrant A | 2,465,129 | 359,389 |
| Events in quadrant B | 3,791,849 | 347,496 |
| Events in quadrant C | 2,616,355 | 345,954 |
| Events in quadrant D | 4,793,506 | 316,946 |
| Mode M9 | |||
|---|---|---|---|
| Quadrant | BADHDUFLAG | Total packets | Discarded packets |
| A | 0 | 37 | 0 |
| B | 0 | 37 | 0 |
| C | 0 | 37 | 0 |
| D | 0 | 38 | 0 |
| Mode M0 | |||
|---|---|---|---|
| Quadrant | BADHDUFLAG | Total packets | Discarded packets |
| A | 0 | 10434 | 3 |
| B | 0 | 14468 | 2 |
| C | 0 | 10722 | 2 |
| D | 0 | 17545 | 2 |
| Mode SS | |||
|---|---|---|---|
| Quadrant | BADHDUFLAG | Total packets | Discarded packets |
| A | 0 | 100 | 0 |
| B | 0 | 100 | 0 |
| C | 0 | 100 | 0 |
| D | 0 | 100 | 0 |
| Quadrant | Total seconds | Saturated seconds | Saturation percentage |
|---|---|---|---|
| A | 4860 | 13 | 0.267490% |
| B | 4860 | 322 | 6.625514% |
| C | 4860 | 84 | 1.728395% |
| D | 4860 | 470 | 9.670782% |
Noise dominated data is calculated using 1-second bins in cleaned event files. If a bin has >2000 counts, and if more than 50% of those come from <1% of pixels, then it is considered to be noise-dominated and hence unusable.
| Quadrant | # 1 sec bins | Bins with >0 counts | Bins with >2000 counts | High rate bins dominated by noise | Noise dominated (total time) | Noise dominated (detector-on time) | Marked lightcurve |
|---|---|---|---|---|---|---|---|
| A | 6953 | 4861 | 6 | 6 | 0.09% | 0.12% | 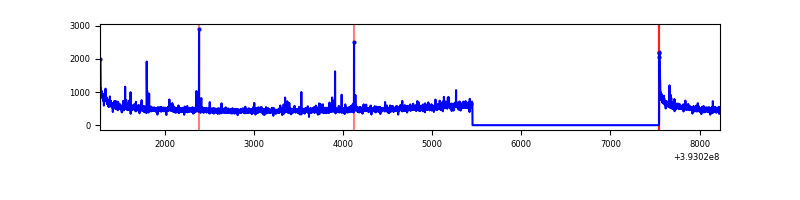 |
| B | 6953 | 4861 | 276 | 276 | 3.97% | 5.68% | 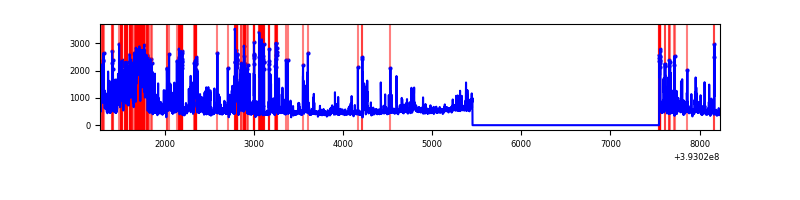 |
| C | 6953 | 4861 | 84 | 84 | 1.21% | 1.73% | 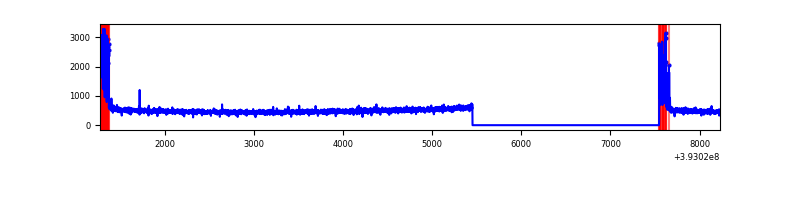 |
| D | 6953 | 4861 | 525 | 525 | 7.55% | 10.80% | 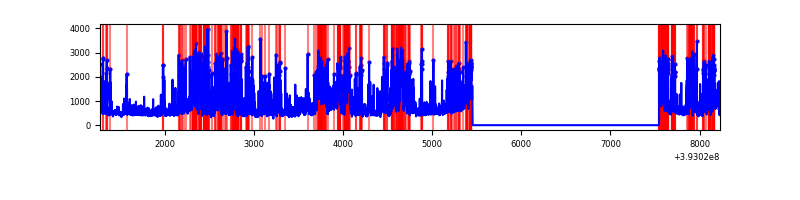 |
Top three noisy pixels from each quadrant. If the there are fewer than three noisy pixels in the level2.evt file, extra rows are filled as -1
| Pixel properties | Quadrant properties | ||||||
|---|---|---|---|---|---|---|---|
| Quadrant | DetID | PixID | Counts | Sigma | Mean | Median | Sigma |
| A | 10 | 83 | 173905 | 1508.61 | 567 | 557 | 114.9 |
| A | 15 | 223 | 23558 | 200.17 | 567 | 557 | 114.9 |
| A | 7 | 3 | 20343 | 172.19 | 567 | 557 | 114.9 |
| B | 5 | 172 | 564915 | 5341.34 | 552 | 539 | 105.7 |
| B | 5 | 236 | 407206 | 3848.76 | 552 | 539 | 105.7 |
| B | 4 | 171 | 333324 | 3149.53 | 552 | 539 | 105.7 |
| C | 0 | 10 | 287944 | 2272.77 | 543 | 549 | 126.5 |
| C | 15 | 214 | 205734 | 1622.64 | 543 | 549 | 126.5 |
| C | 15 | 159 | 5099 | 35.98 | 543 | 549 | 126.5 |
| D | 7 | 223 | 1258911 | 9801.17 | 522 | 509 | 128.4 |
| D | 12 | 6 | 690808 | 5376.45 | 522 | 509 | 128.4 |
| D | 13 | 249 | 366232 | 2848.46 | 522 | 509 | 128.4 |
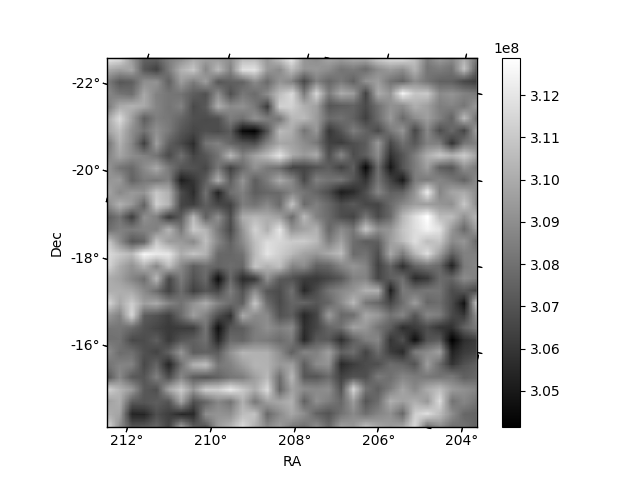
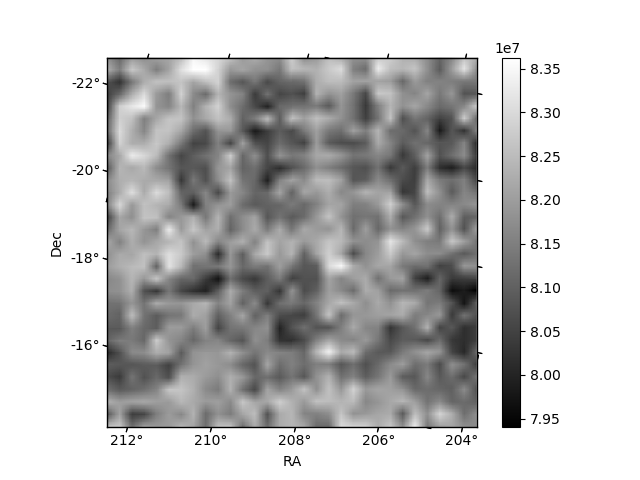
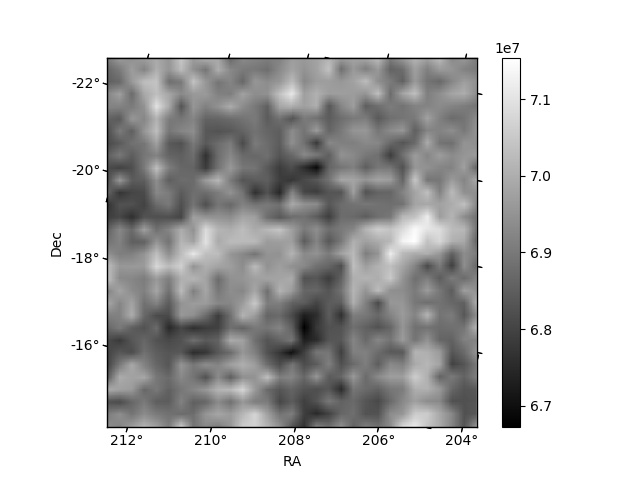
Histogram calculated using DETX and DETY for each event in the final _common_clean file
| Quadrant A | 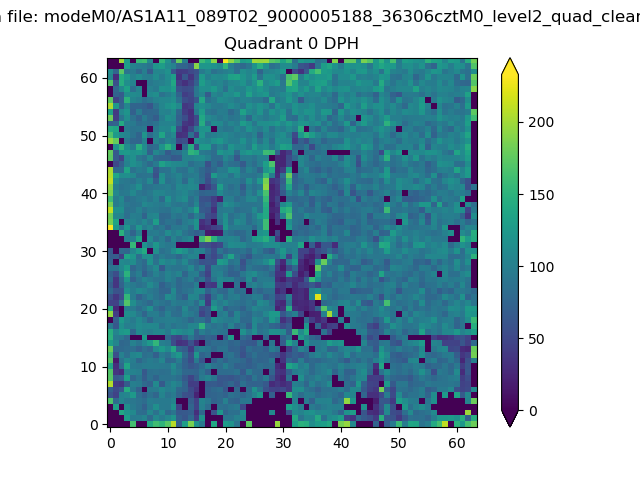 |
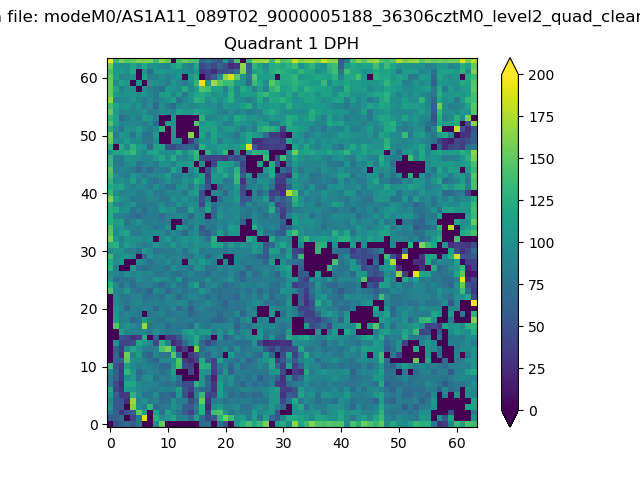 |
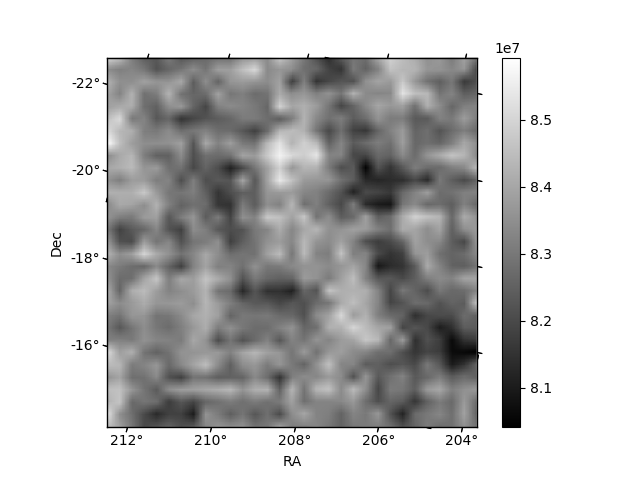
Quadrant B |
|---|---|---|---|
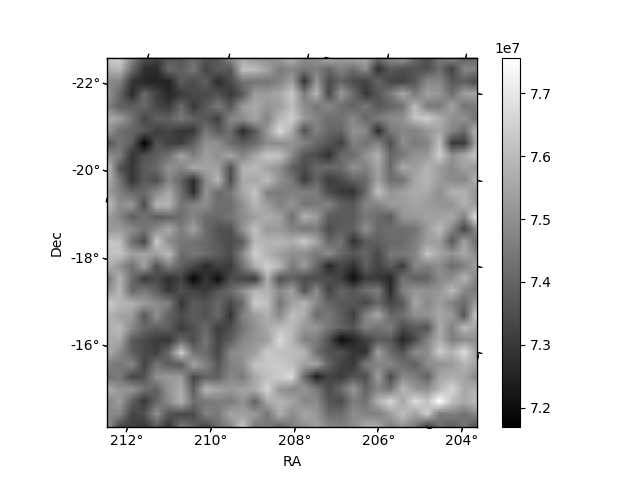
| Quadrant D | 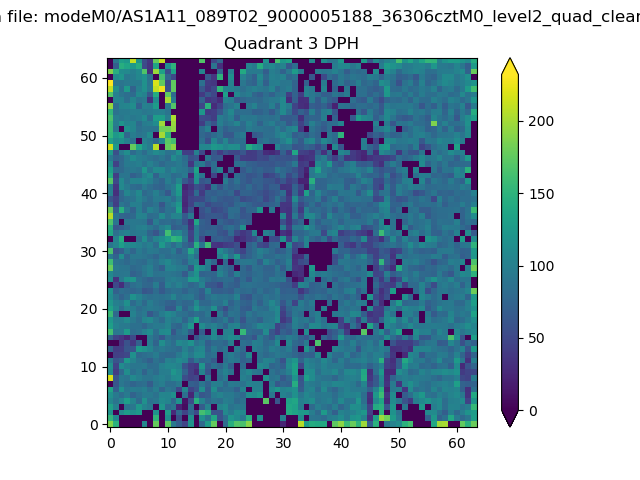 |
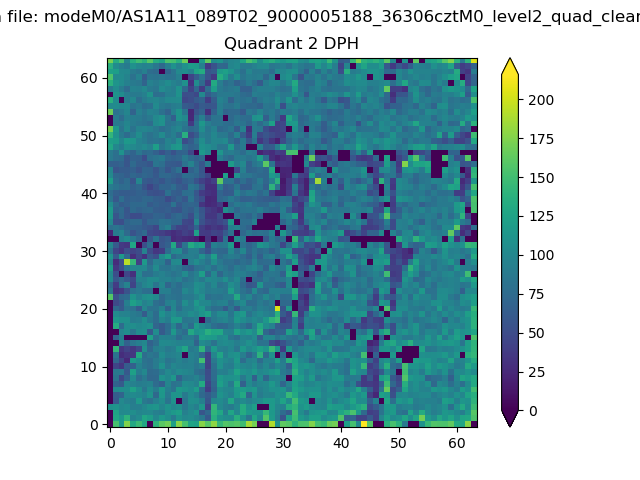 |
Quadrant C |
| Plot type | Count rate plots | Images |
|---|---|---|
| Comparison with Poisson distribution Blue bars denote a histogram of data divided into 1 sec bins. Red curve is a Poisson curve with rate = median count rate of data. |
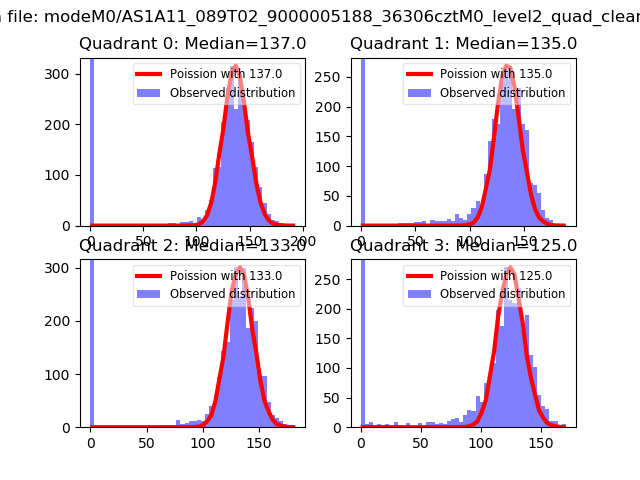 |
 |
| Quadrant-wise count rates Data is divided into 100 sec bins |
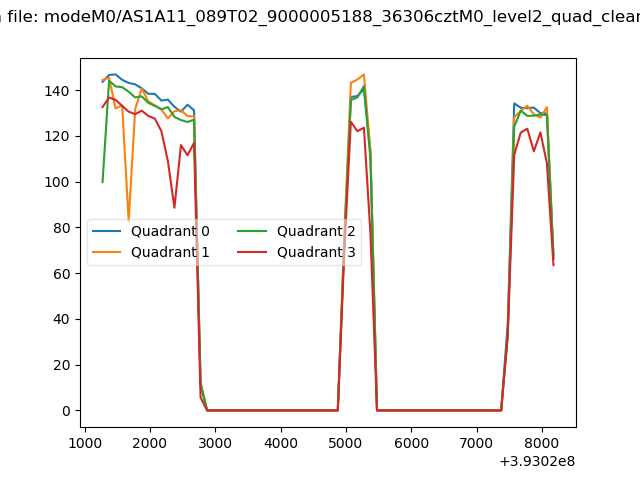 |
|
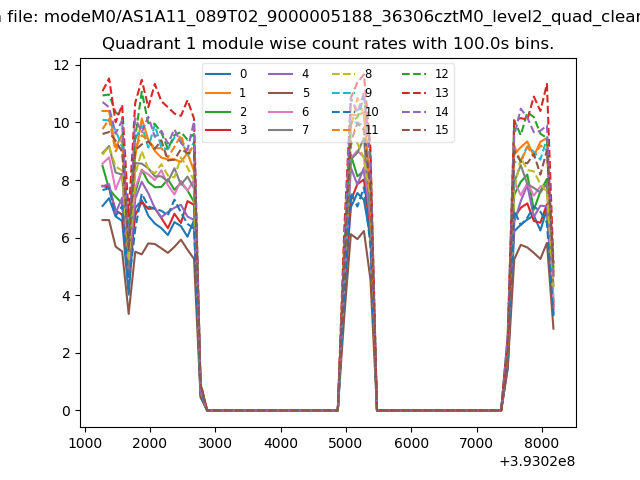
| Module-wise count rates for Quadrant A Data is divided into 100 sec bins |
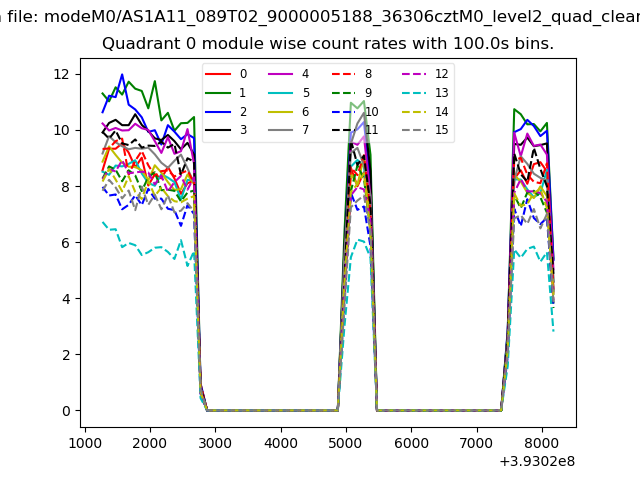 |
 |
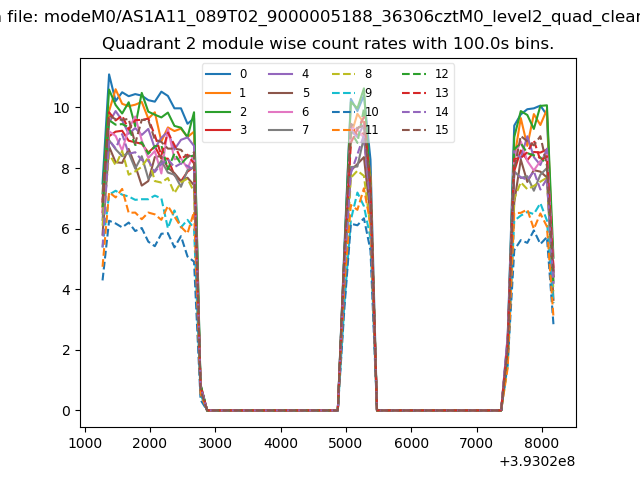
| Module-wise count rates for Quadrant B Data is divided into 100 sec bins |
 |
 |
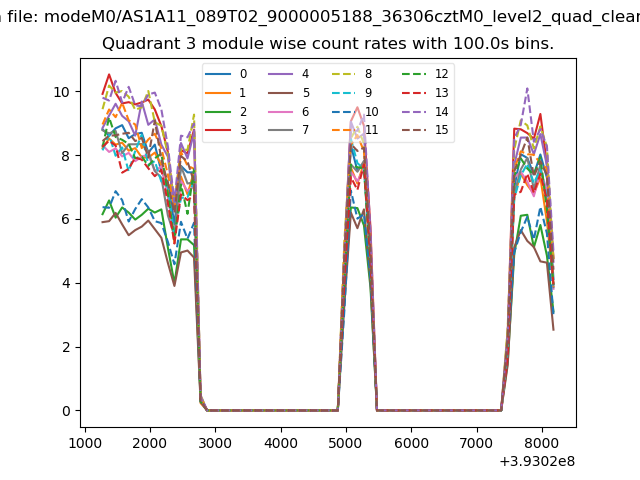
| Module-wise count rates for Quadrant C Data is divided into 100 sec bins |
 |
 |
| Module-wise count rates for Quadrant D Data is divided into 100 sec bins |
 |
 |
| Parameter | Plot |
|---|---|
| CZT HV Monitor | 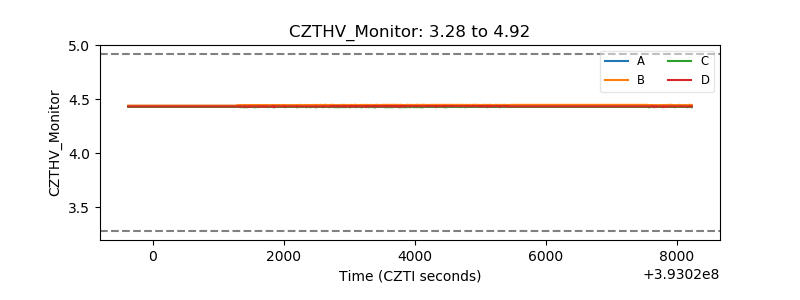 |
| D_VDD | 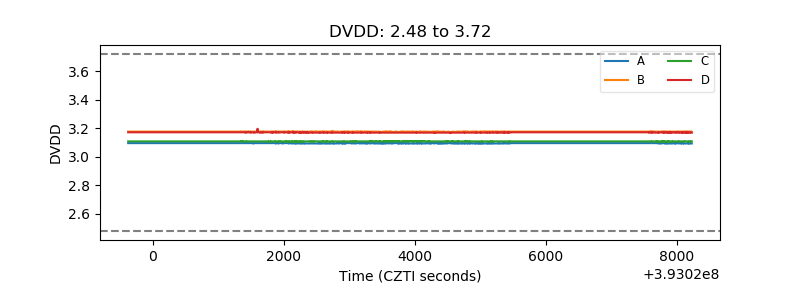 |
| Temperature 1 | 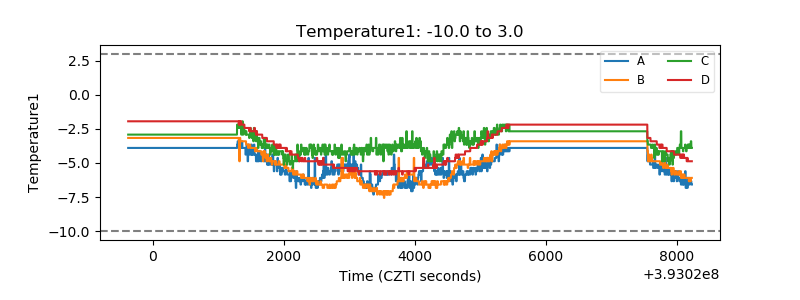 |
| Veto HV Monitor | 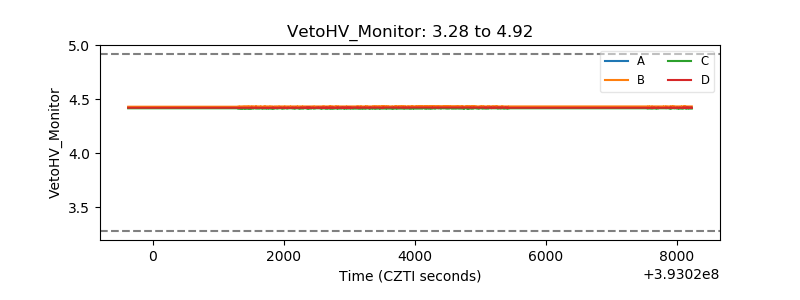 |
| Veto LLD | 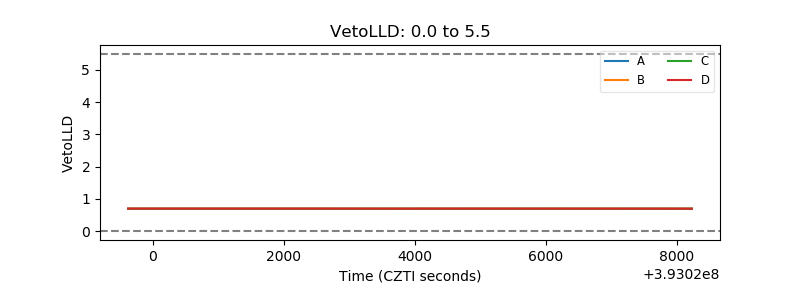 |
| Alpha Counter | 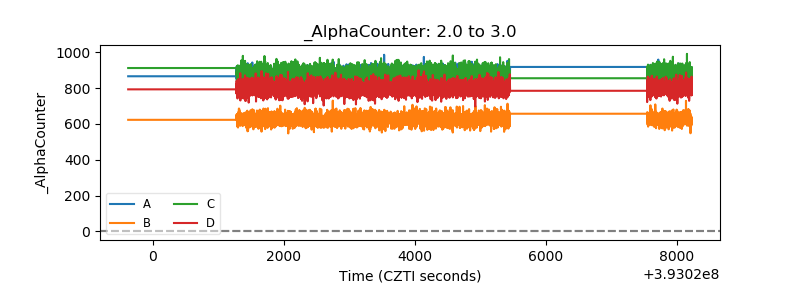 |
| _CPM_Rate | 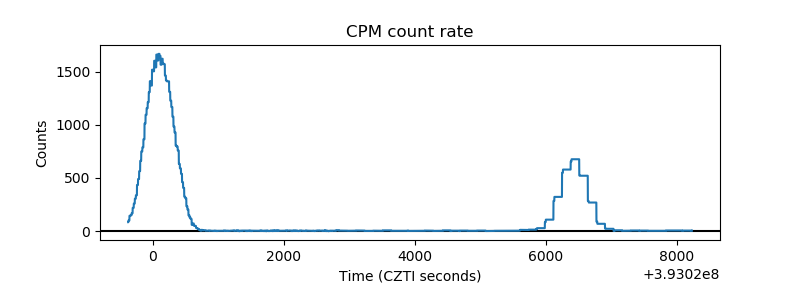 |
| CZT Counter | 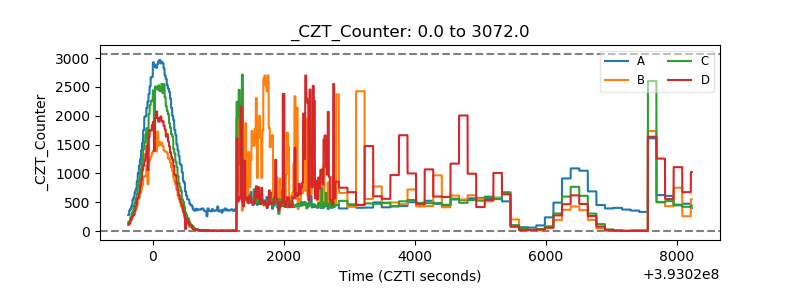 |
| +2.5 Volts monitor | 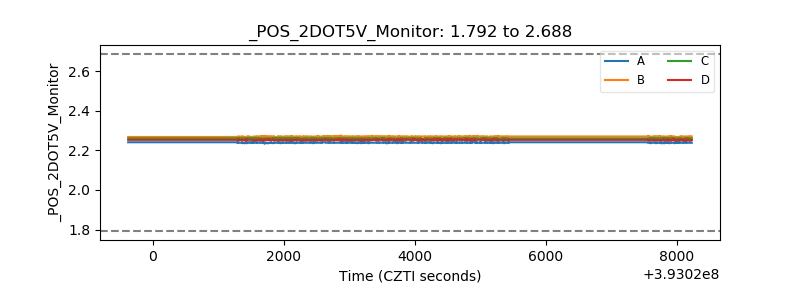 |
| +5 Volts monitor | 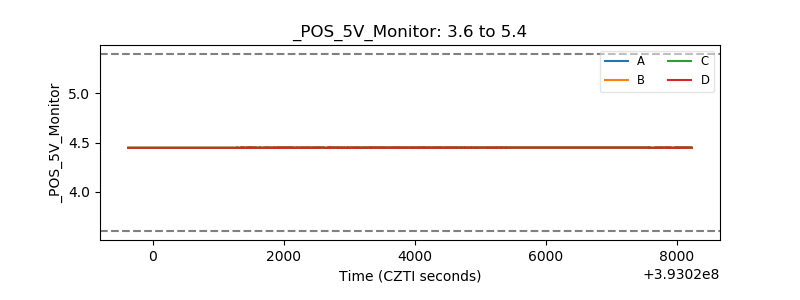 |
| _ROLL_ROT | 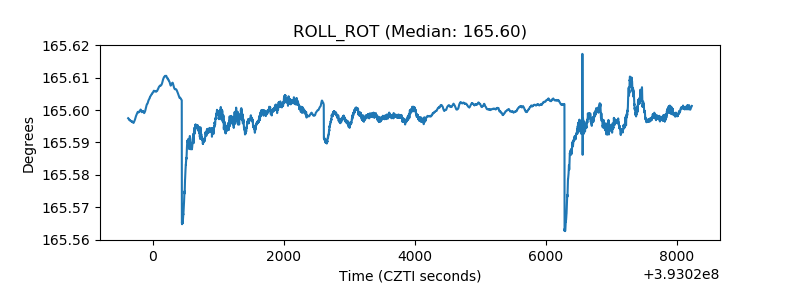 |
| _Roll_DEC | 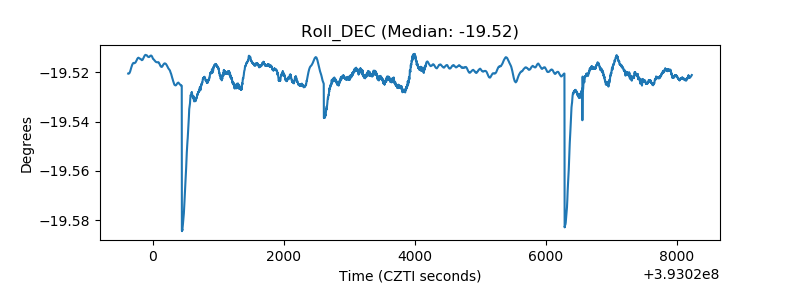 |
| _Roll_RA | 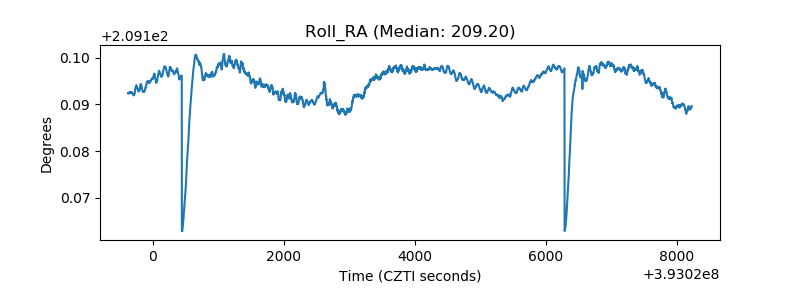 |
| Veto Counter | 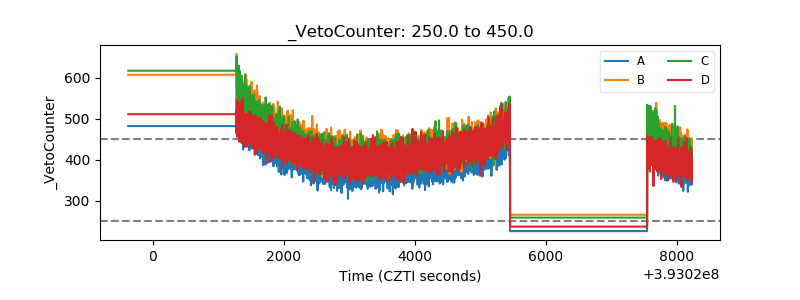 |