| Param | Original file | Final file |
|---|---|---|
| Filename | modeM0/AS1A11_089T02_9000005188_36304cztM0_level2.evt | modeM0/AS1A11_089T02_9000005188_36304cztM0_level2_quad_clean.evt |
| Size (bytes) | 521,366,400 | 72,538,560 |
| Size | 497.2 MB | 69.2 MB |
| Events in quadrant A | 2,737,686 | 499,417 |
| Events in quadrant B | 5,126,616 | 430,874 |
| Events in quadrant C | 3,002,383 | 468,994 |
| Events in quadrant D | 4,572,630 | 434,443 |
| Mode M9 | |||
|---|---|---|---|
| Quadrant | BADHDUFLAG | Total packets | Discarded packets |
| A | 0 | 22 | 0 |
| B | 0 | 22 | 0 |
| C | 0 | 22 | 0 |
| D | 0 | 23 | 0 |
| Mode M0 | |||
|---|---|---|---|
| Quadrant | BADHDUFLAG | Total packets | Discarded packets |
| A | 0 | 11333 | 3 |
| B | 0 | 18672 | 2 |
| C | 0 | 11999 | 2 |
| D | 0 | 16999 | 2 |
| Mode SS | |||
|---|---|---|---|
| Quadrant | BADHDUFLAG | Total packets | Discarded packets |
| A | 0 | 106 | 0 |
| B | 0 | 106 | 0 |
| C | 0 | 106 | 0 |
| D | 0 | 106 | 0 |
| Quadrant | Total seconds | Saturated seconds | Saturation percentage |
|---|---|---|---|
| A | 5170 | 10 | 0.193424% |
| B | 5170 | 771 | 14.912959% |
| C | 5170 | 100 | 1.934236% |
| D | 5170 | 396 | 7.659574% |
Noise dominated data is calculated using 1-second bins in cleaned event files. If a bin has >2000 counts, and if more than 50% of those come from <1% of pixels, then it is considered to be noise-dominated and hence unusable.
| Quadrant | # 1 sec bins | Bins with >0 counts | Bins with >2000 counts | High rate bins dominated by noise | Noise dominated (total time) | Noise dominated (detector-on time) | Marked lightcurve |
|---|---|---|---|---|---|---|---|
| A | 7232 | 5171 | 5 | 5 | 0.07% | 0.10% | 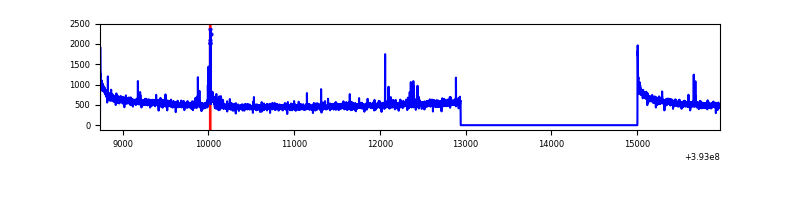 |
| B | 7232 | 5171 | 692 | 692 | 9.57% | 13.38% |  |
| C | 7232 | 5171 | 74 | 74 | 1.02% | 1.43% | 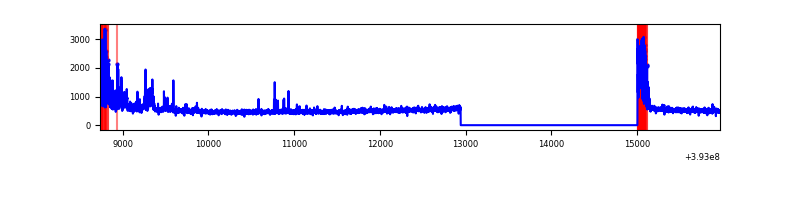 |
| D | 7232 | 5171 | 432 | 432 | 5.97% | 8.35% | 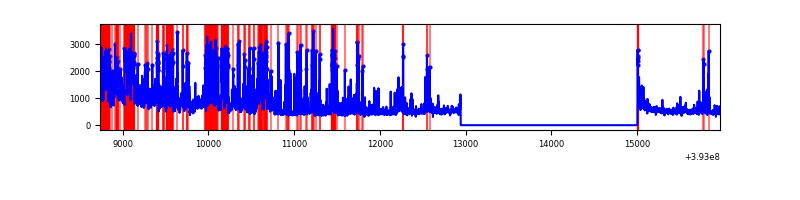 |
Top three noisy pixels from each quadrant. If the there are fewer than three noisy pixels in the level2.evt file, extra rows are filled as -1
| Pixel properties | Quadrant properties | ||||||
|---|---|---|---|---|---|---|---|
| Quadrant | DetID | PixID | Counts | Sigma | Mean | Median | Sigma |
| A | 10 | 83 | 190008 | 1482.9 | 640 | 628 | 127.7 |
| A | 15 | 223 | 45487 | 351.25 | 640 | 628 | 127.7 |
| A | 9 | 143 | 20018 | 151.83 | 640 | 628 | 127.7 |
| B | 5 | 172 | 1667704 | 15078.02 | 584 | 570 | 110.6 |
| B | 0 | 213 | 372430 | 3363.2 | 584 | 570 | 110.6 |
| B | 15 | 35 | 247618 | 2234.37 | 584 | 570 | 110.6 |
| C | 0 | 10 | 311285 | 2220.53 | 603 | 611 | 139.9 |
| C | 15 | 214 | 219480 | 1564.36 | 603 | 611 | 139.9 |
| C | 0 | 207 | 111364 | 791.6 | 603 | 611 | 139.9 |
| D | 7 | 223 | 1461916 | 10058.8 | 595 | 579 | 145.3 |
| D | 12 | 6 | 291796 | 2004.53 | 595 | 579 | 145.3 |
| D | 12 | 233 | 89231 | 610.22 | 595 | 579 | 145.3 |
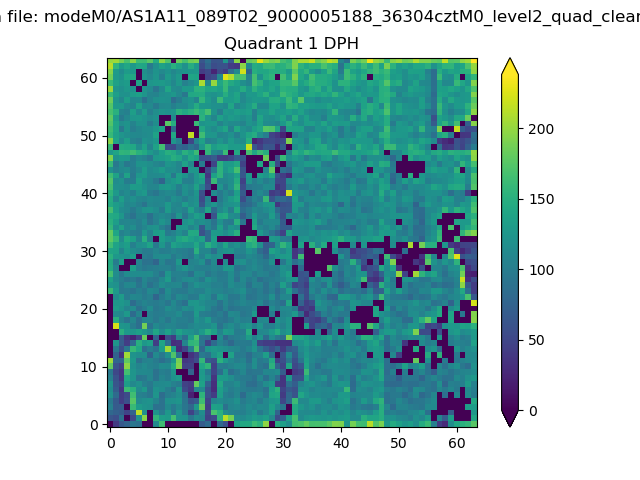
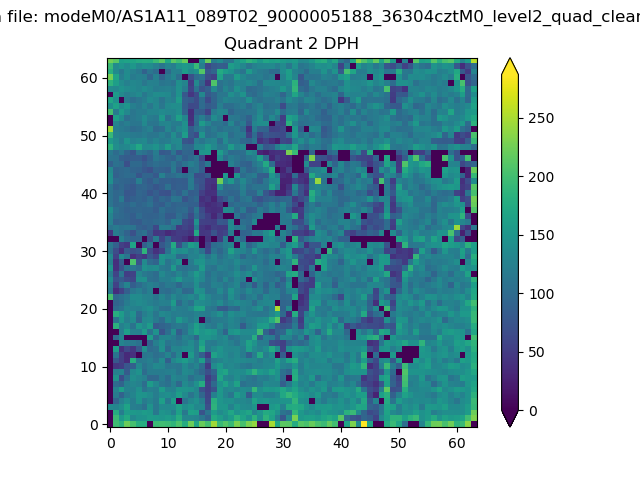
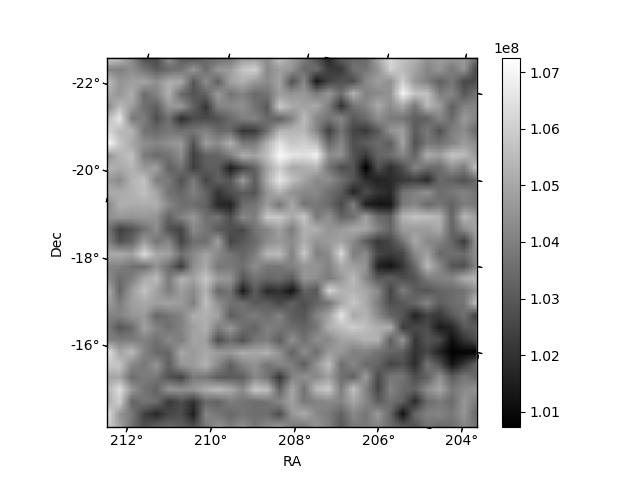
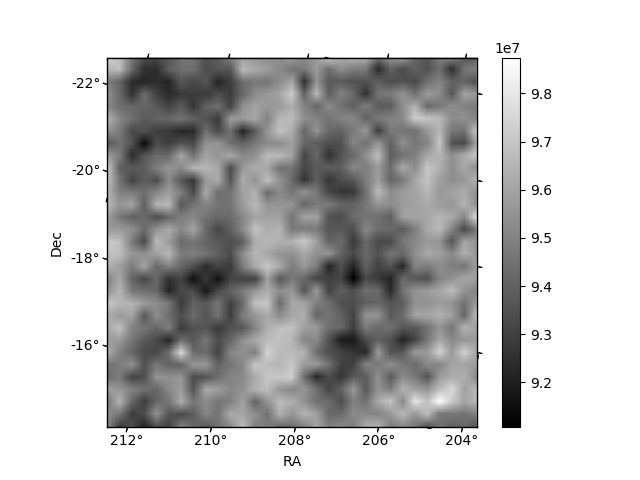
Histogram calculated using DETX and DETY for each event in the final _common_clean file
| Quadrant A | 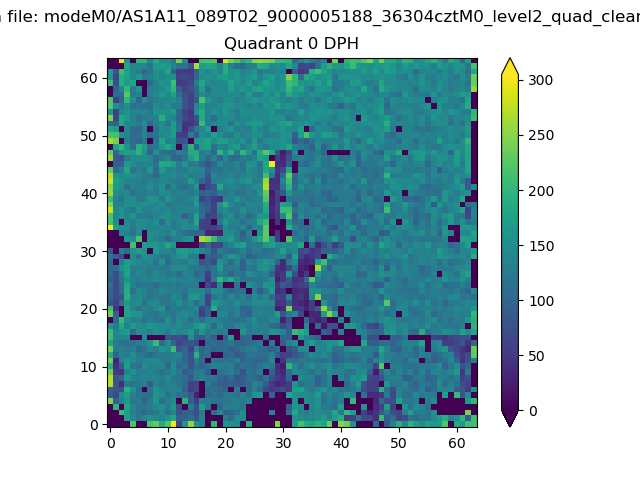 |
 |
Quadrant B |
|---|---|---|---|
| Quadrant D | 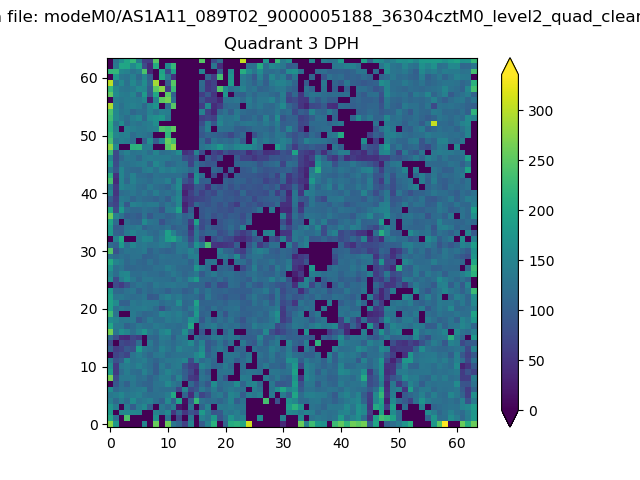 |
 |
Quadrant C |
| Plot type | Count rate plots | Images |
|---|---|---|
| Comparison with Poisson distribution Blue bars denote a histogram of data divided into 1 sec bins. Red curve is a Poisson curve with rate = median count rate of data. |
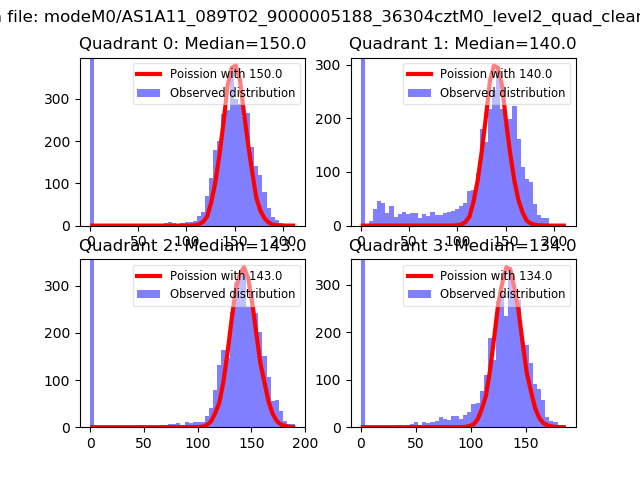 |
 |
| Quadrant-wise count rates Data is divided into 100 sec bins |
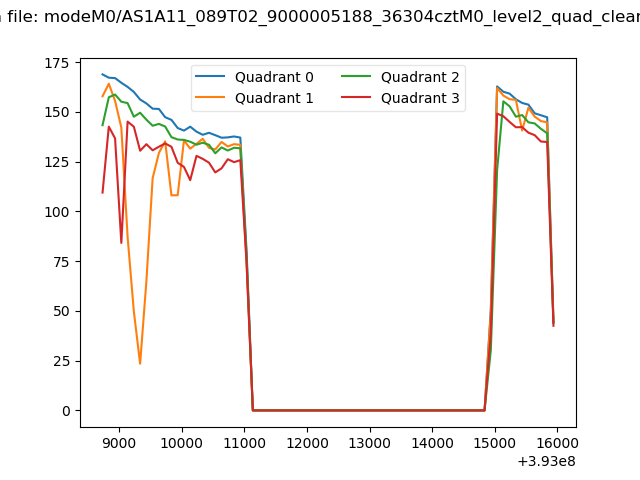 |
|
| Module-wise count rates for Quadrant A Data is divided into 100 sec bins |
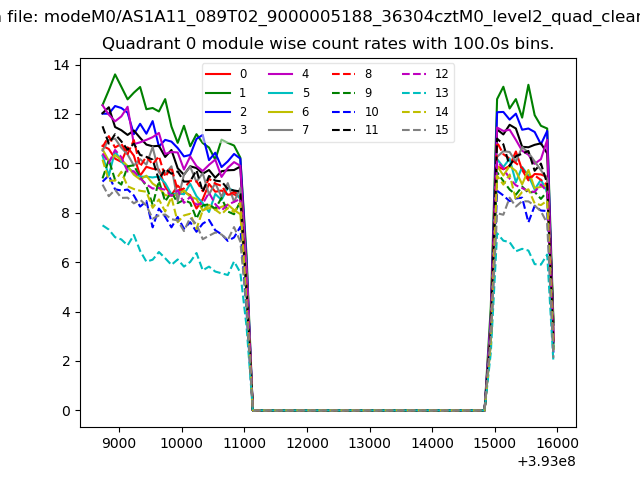 |
 |
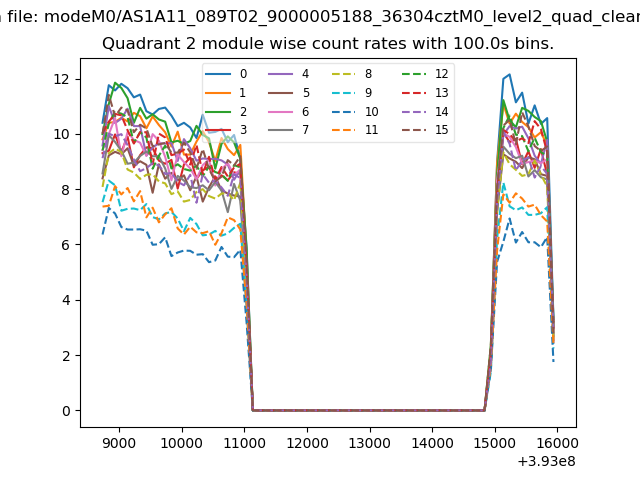
| Module-wise count rates for Quadrant B Data is divided into 100 sec bins |
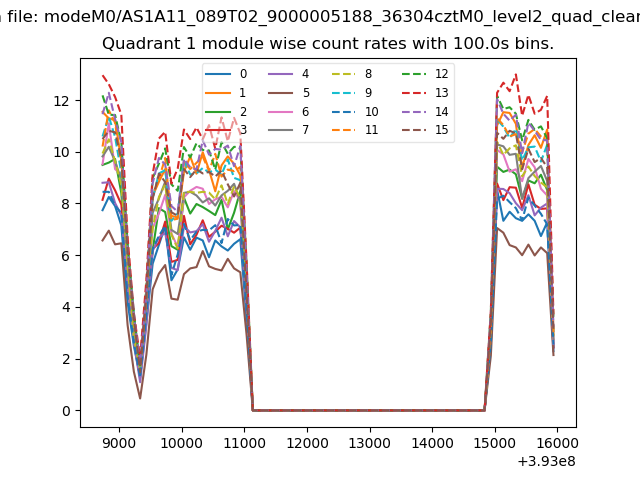 |
 |
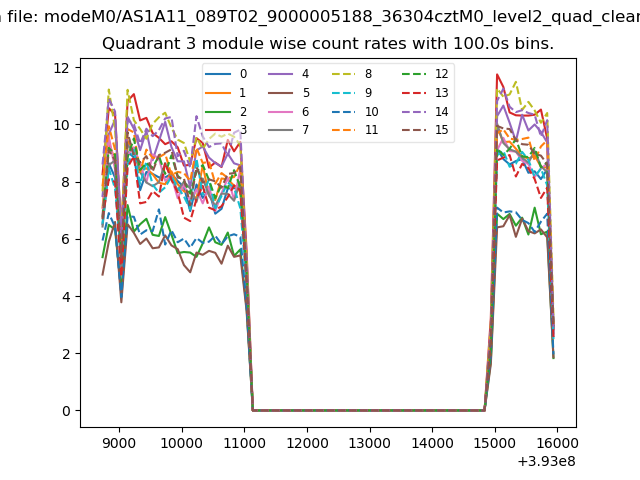
| Module-wise count rates for Quadrant C Data is divided into 100 sec bins |
 |
 |
| Module-wise count rates for Quadrant D Data is divided into 100 sec bins |
 |
 |
| Parameter | Plot |
|---|---|
| CZT HV Monitor | 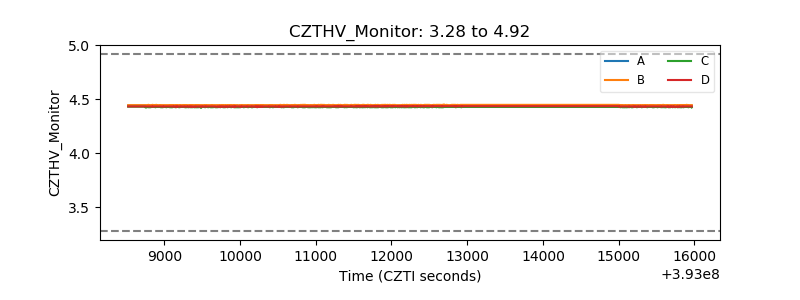 |
| D_VDD | 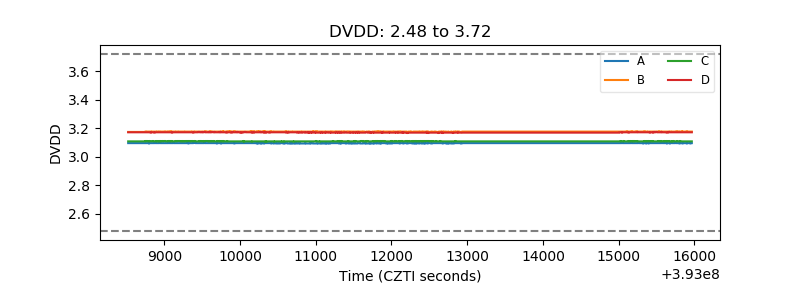 |
| Temperature 1 | 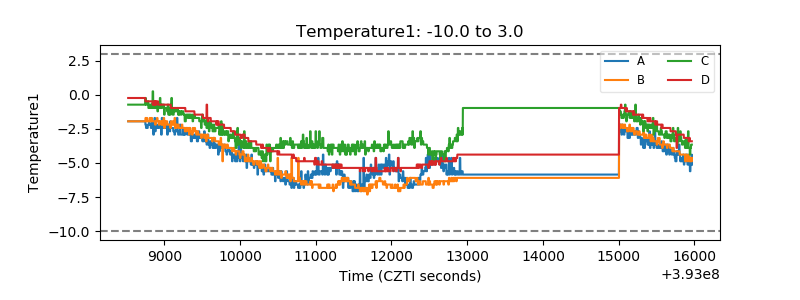 |
| Veto HV Monitor | 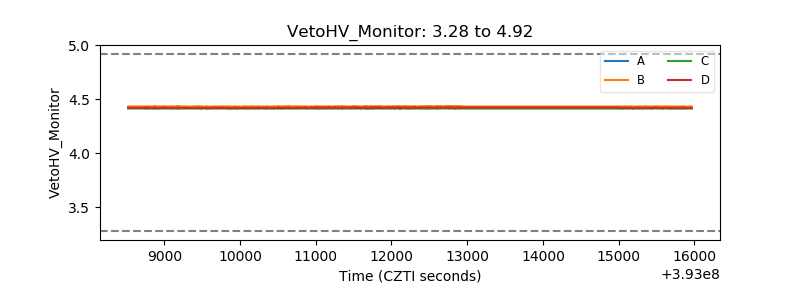 |
| Veto LLD |  |
| Alpha Counter | 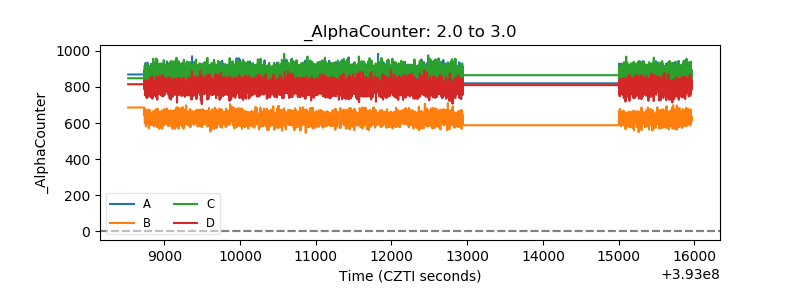 |
| _CPM_Rate | 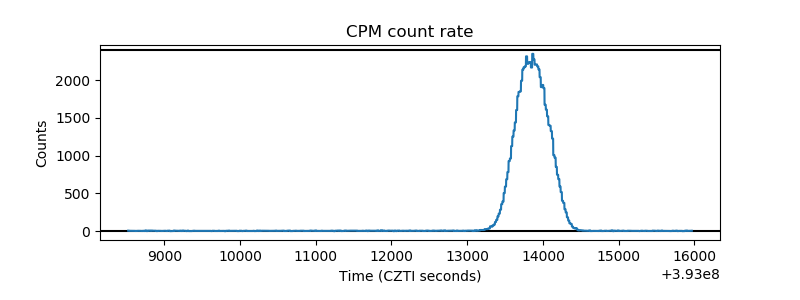 |
| CZT Counter | 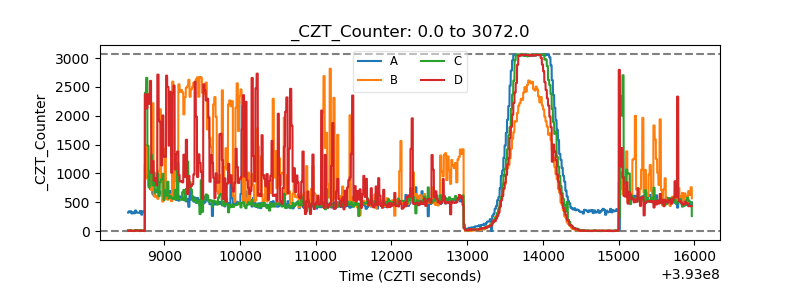 |
| +2.5 Volts monitor | 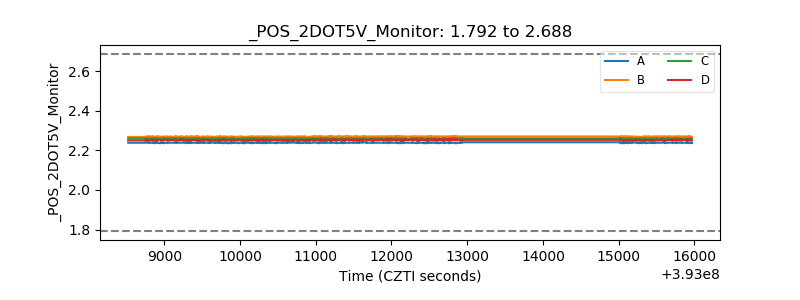 |
| +5 Volts monitor | 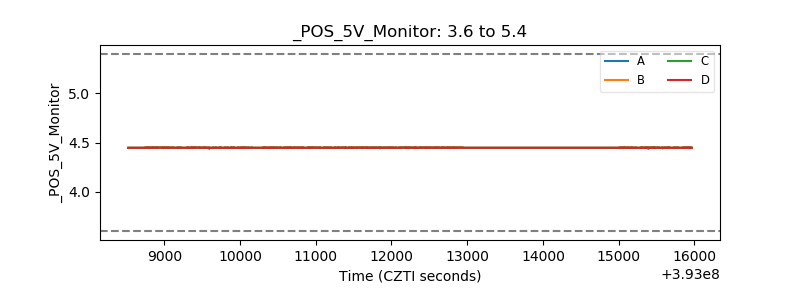 |
| _ROLL_ROT | 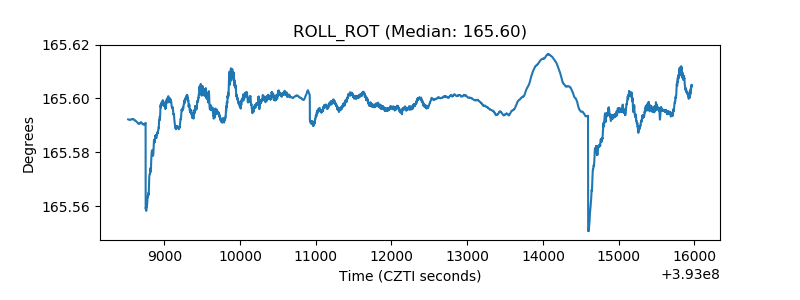 |
| _Roll_DEC | 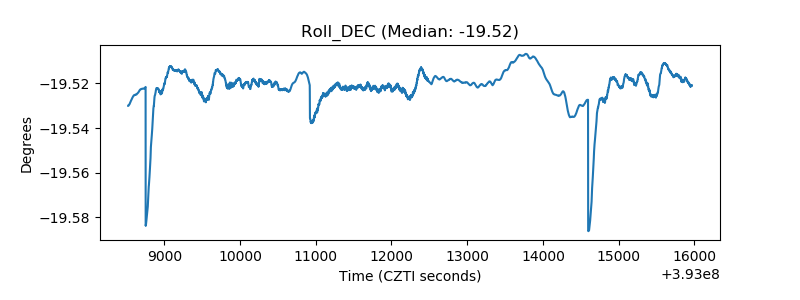 |
| _Roll_RA | 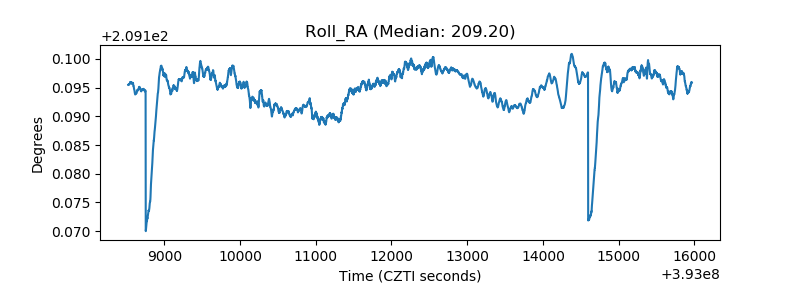 |
| Veto Counter | 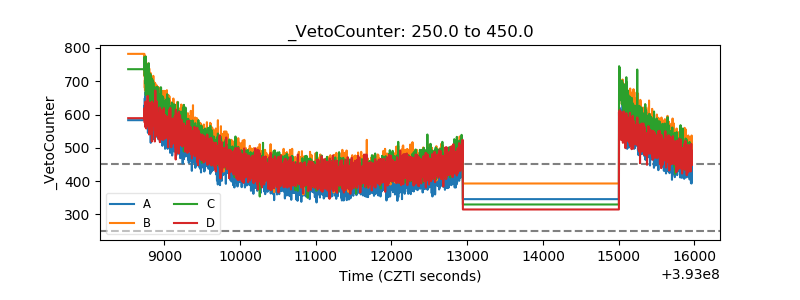 |