| Param | Original file | Final file |
|---|---|---|
| Filename | modeM0/AS1A11_089T02_9000005188_36303cztM0_level2.evt | modeM0/AS1A11_089T02_9000005188_36303cztM0_level2_quad_clean.evt |
| Size (bytes) | 583,246,080 | 79,326,720 |
| Size | 556.2 MB | 75.7 MB |
| Events in quadrant A | 2,818,150 | 571,462 |
| Events in quadrant B | 7,063,219 | 406,266 |
| Events in quadrant C | 3,112,266 | 542,692 |
| Events in quadrant D | 4,306,621 | 505,076 |
| Mode M9 | |||
|---|---|---|---|
| Quadrant | BADHDUFLAG | Total packets | Discarded packets |
| A | 0 | 20 | 0 |
| B | 0 | 20 | 0 |
| C | 0 | 20 | 0 |
| D | 0 | 21 | 0 |
| Mode M0 | |||
|---|---|---|---|
| Quadrant | BADHDUFLAG | Total packets | Discarded packets |
| A | 0 | 11681 | 3 |
| B | 0 | 24620 | 2 |
| C | 0 | 12588 | 2 |
| D | 0 | 16355 | 2 |
| Mode SS | |||
|---|---|---|---|
| Quadrant | BADHDUFLAG | Total packets | Discarded packets |
| A | 0 | 108 | 0 |
| B | 0 | 108 | 0 |
| C | 0 | 108 | 0 |
| D | 0 | 108 | 0 |
| Quadrant | Total seconds | Saturated seconds | Saturation percentage |
|---|---|---|---|
| A | 5370 | 13 | 0.242086% |
| B | 5370 | 1820 | 33.891993% |
| C | 5370 | 51 | 0.949721% |
| D | 5370 | 396 | 7.374302% |
Noise dominated data is calculated using 1-second bins in cleaned event files. If a bin has >2000 counts, and if more than 50% of those come from <1% of pixels, then it is considered to be noise-dominated and hence unusable.
| Quadrant | # 1 sec bins | Bins with >0 counts | Bins with >2000 counts | High rate bins dominated by noise | Noise dominated (total time) | Noise dominated (detector-on time) | Marked lightcurve |
|---|---|---|---|---|---|---|---|
| A | 7343 | 5371 | 2 | 2 | 0.03% | 0.04% | 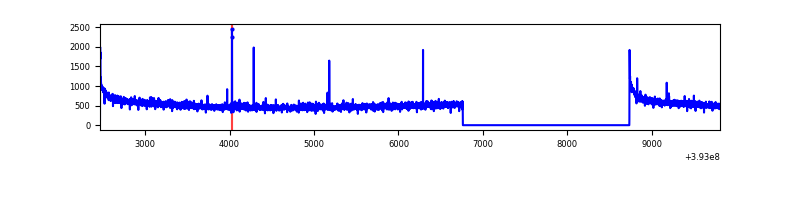 |
| B | 7343 | 5370 | 1673 | 1673 | 22.78% | 31.15% | 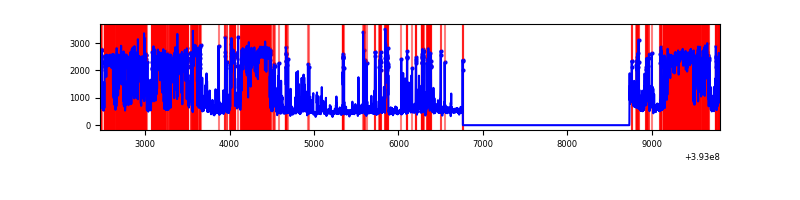 |
| C | 7343 | 5371 | 41 | 41 | 0.56% | 0.76% | 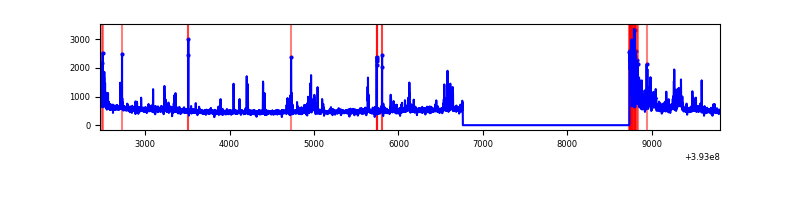 |
| D | 7343 | 5371 | 388 | 388 | 5.28% | 7.22% | 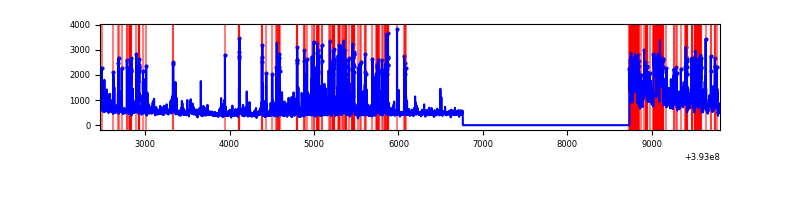 |
Top three noisy pixels from each quadrant. If the there are fewer than three noisy pixels in the level2.evt file, extra rows are filled as -1
| Pixel properties | Quadrant properties | ||||||
|---|---|---|---|---|---|---|---|
| Quadrant | DetID | PixID | Counts | Sigma | Mean | Median | Sigma |
| A | 10 | 83 | 194484 | 1434.2 | 670 | 658 | 135.1 |
| A | 9 | 143 | 11277 | 78.57 | 670 | 658 | 135.1 |
| A | 13 | 6 | 10971 | 76.31 | 670 | 658 | 135.1 |
| B | 5 | 172 | 3736534 | 37021.95 | 533 | 522 | 100.9 |
| B | 4 | 171 | 708204 | 7012.76 | 533 | 522 | 100.9 |
| B | 5 | 236 | 205597 | 2032.19 | 533 | 522 | 100.9 |
| C | 15 | 214 | 226735 | 1558.62 | 629 | 636 | 145.1 |
| C | 0 | 207 | 209229 | 1437.95 | 629 | 636 | 145.1 |
| C | 0 | 10 | 201266 | 1383.05 | 629 | 636 | 145.1 |
| D | 7 | 223 | 851025 | 5622.84 | 622 | 607 | 151.2 |
| D | 12 | 6 | 464302 | 3065.88 | 622 | 607 | 151.2 |
| D | 13 | 249 | 189710 | 1250.32 | 622 | 607 | 151.2 |
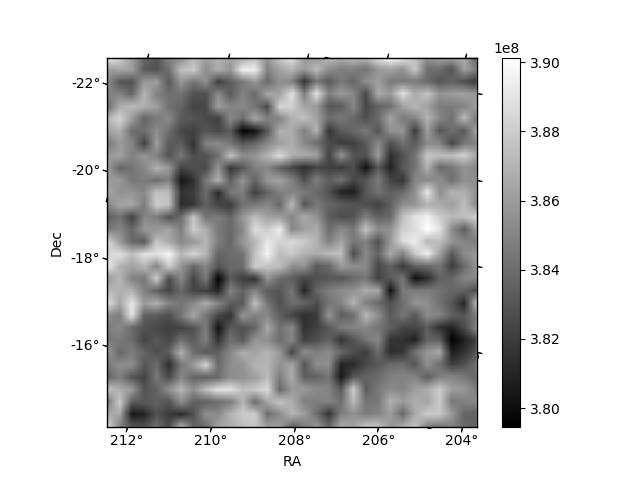
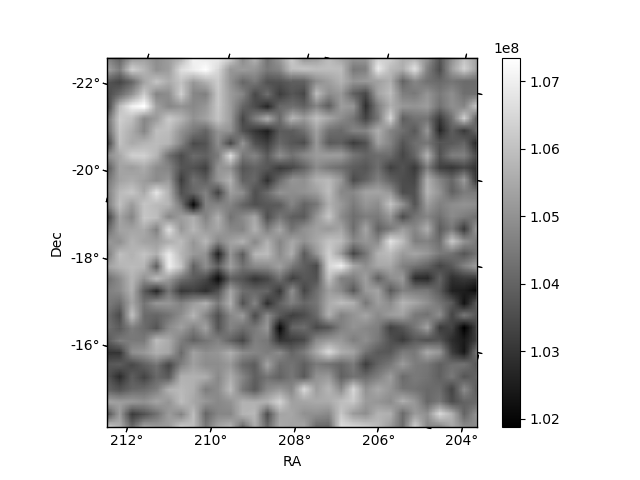
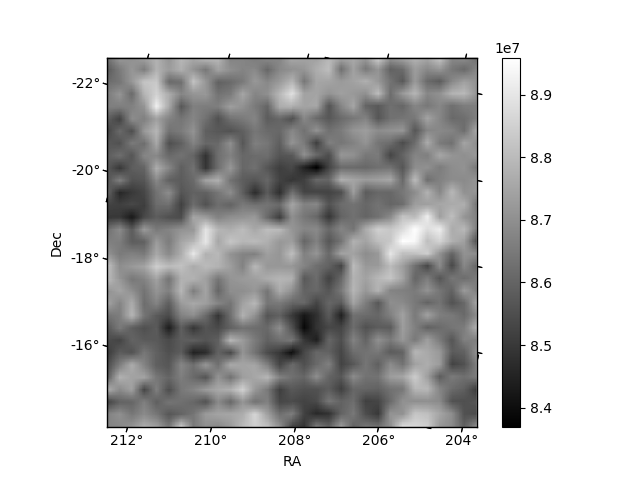
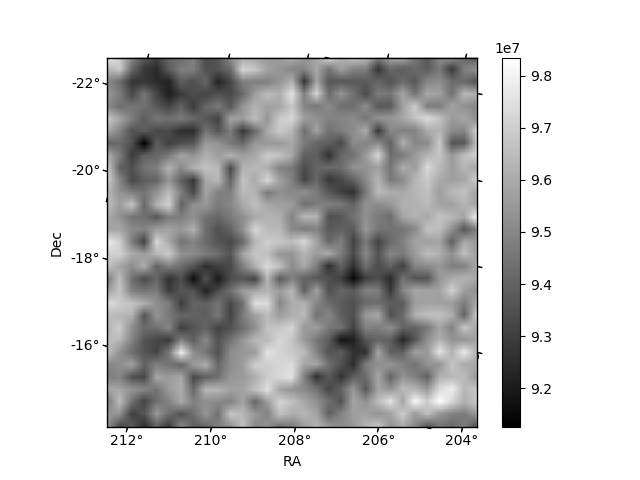
Histogram calculated using DETX and DETY for each event in the final _common_clean file
| Quadrant A | 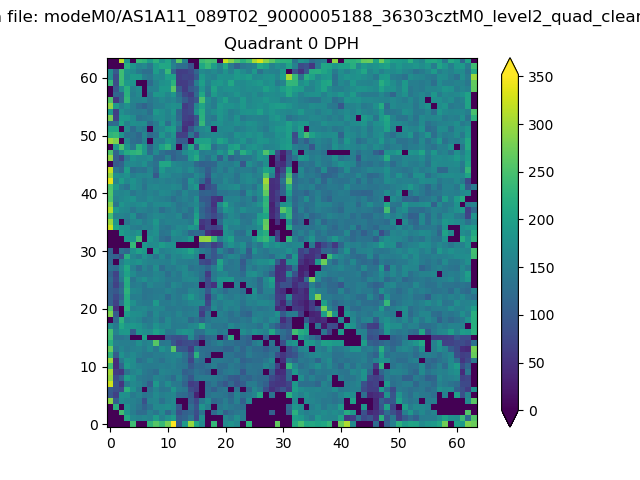 |
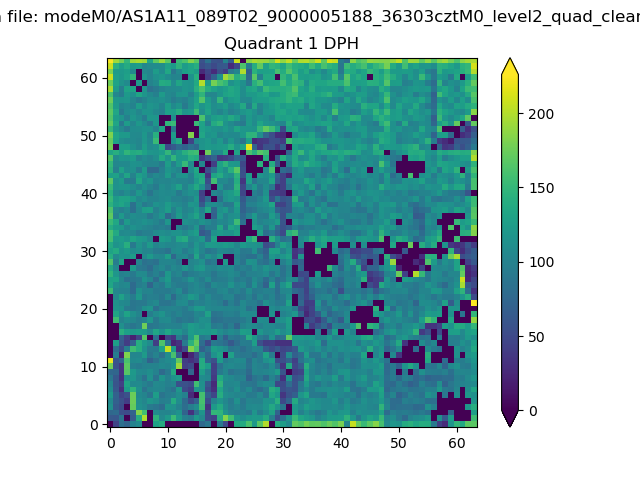 |
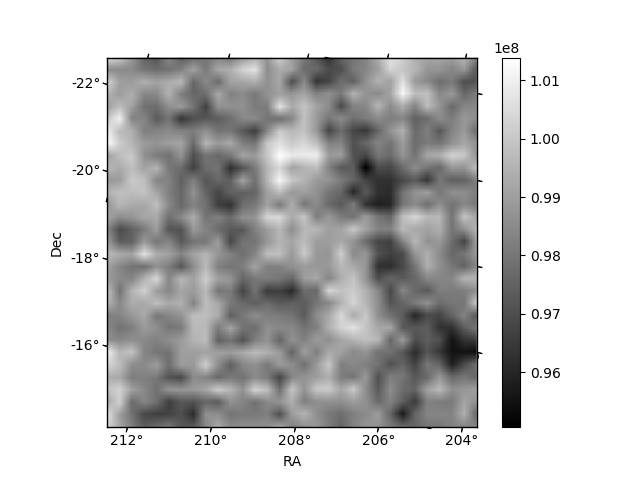
Quadrant B |
|---|---|---|---|
| Quadrant D | 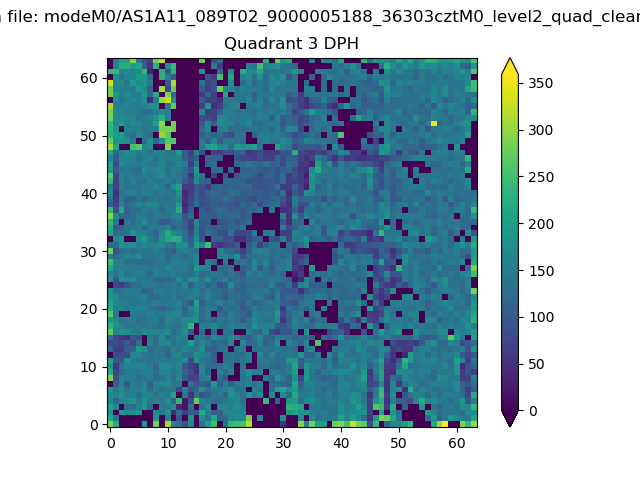 |
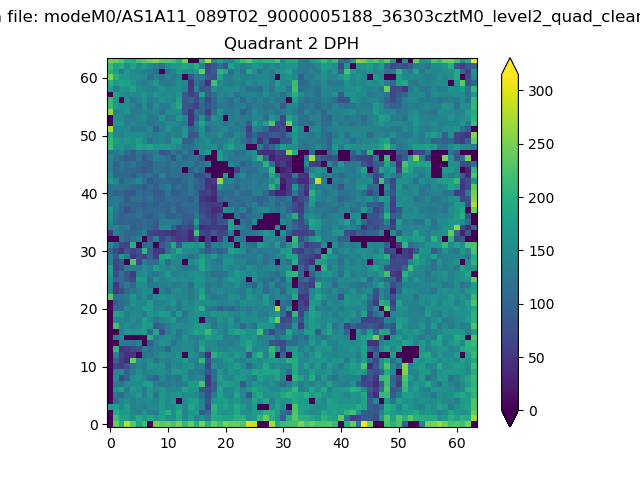 |
Quadrant C |
| Plot type | Count rate plots | Images |
|---|---|---|
| Comparison with Poisson distribution Blue bars denote a histogram of data divided into 1 sec bins. Red curve is a Poisson curve with rate = median count rate of data. |
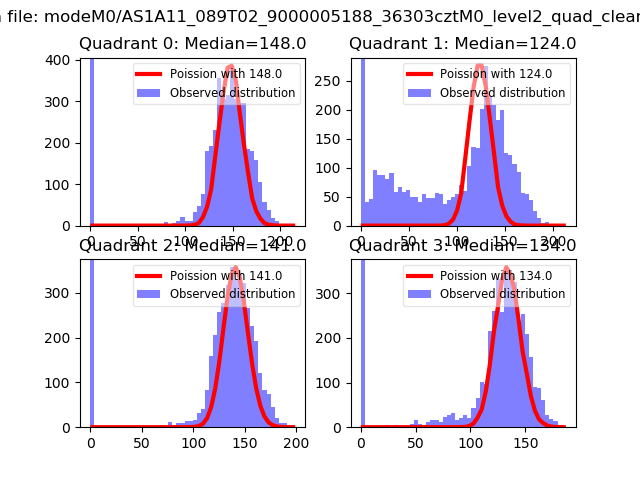 |
 |
| Quadrant-wise count rates Data is divided into 100 sec bins |
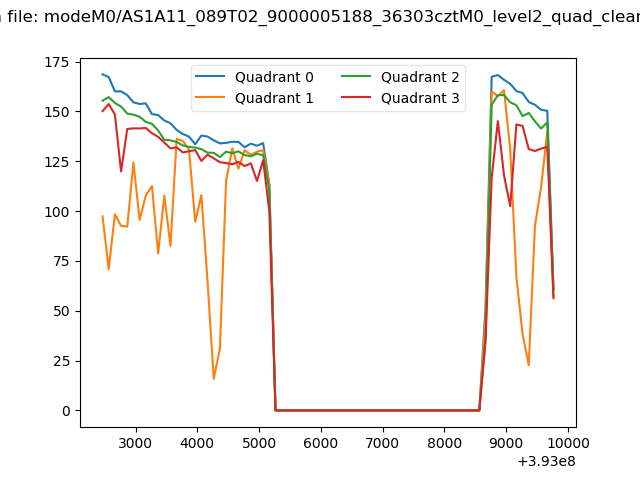 |
|
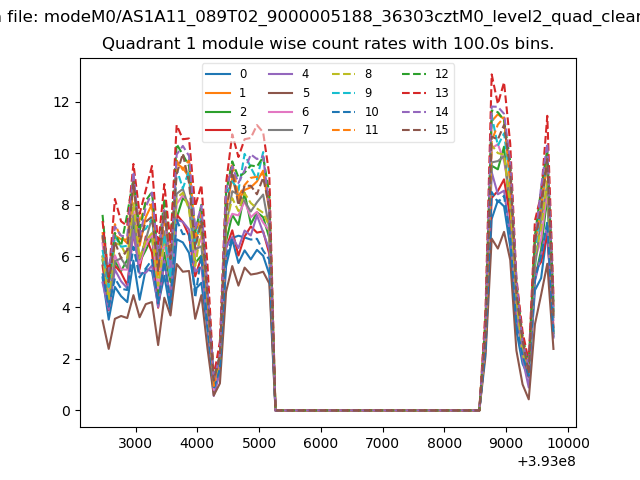
| Module-wise count rates for Quadrant A Data is divided into 100 sec bins |
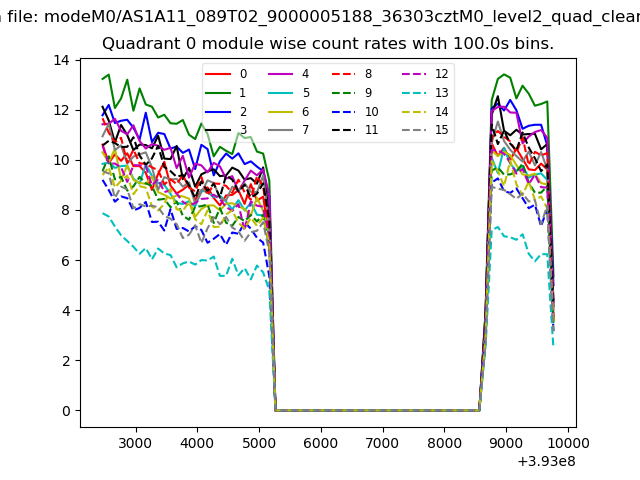 |
 |
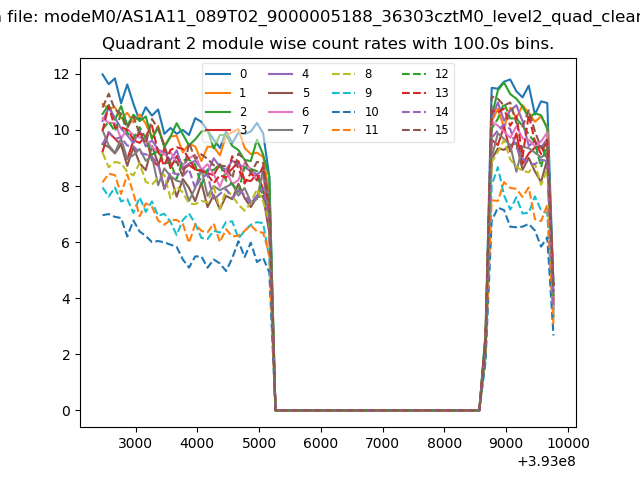
| Module-wise count rates for Quadrant B Data is divided into 100 sec bins |
 |
 |
| Module-wise count rates for Quadrant C Data is divided into 100 sec bins |
 |
 |
| Module-wise count rates for Quadrant D Data is divided into 100 sec bins |
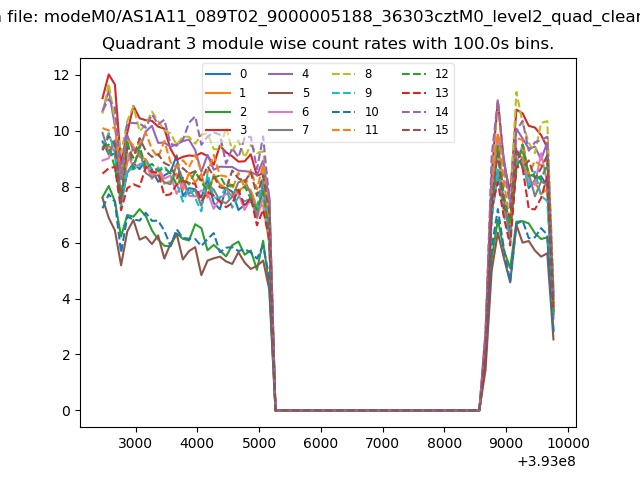 |
 |
| Parameter | Plot |
|---|---|
| CZT HV Monitor | 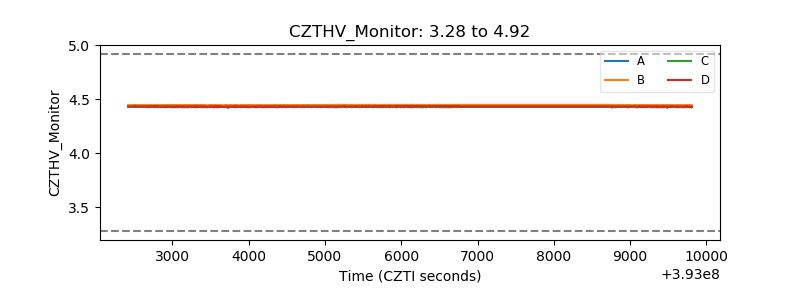 |
| D_VDD | 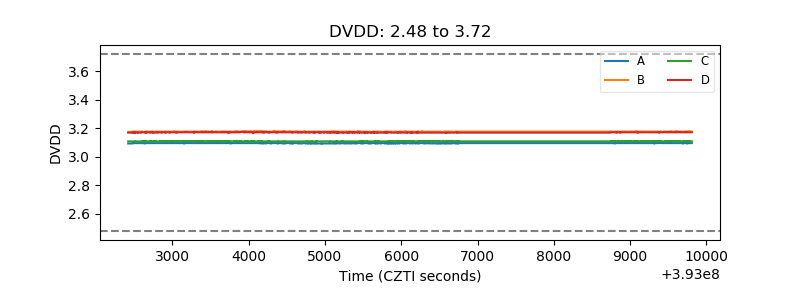 |
| Temperature 1 | 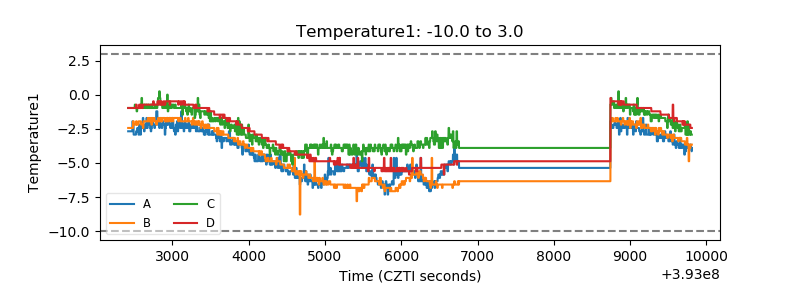 |
| Veto HV Monitor | 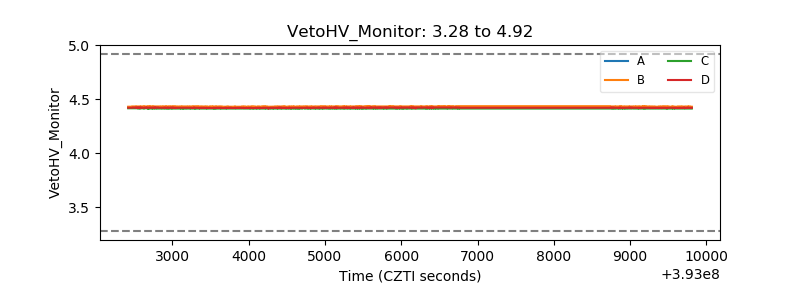 |
| Veto LLD | 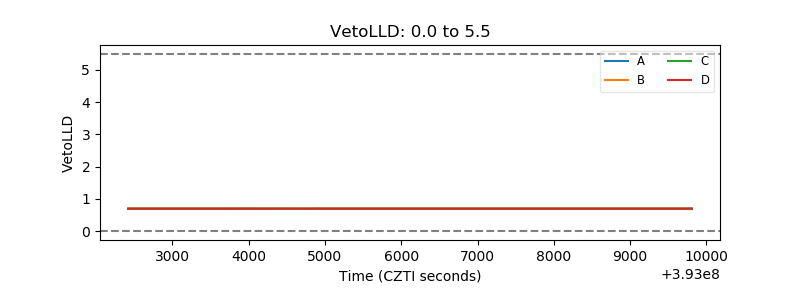 |
| Alpha Counter | 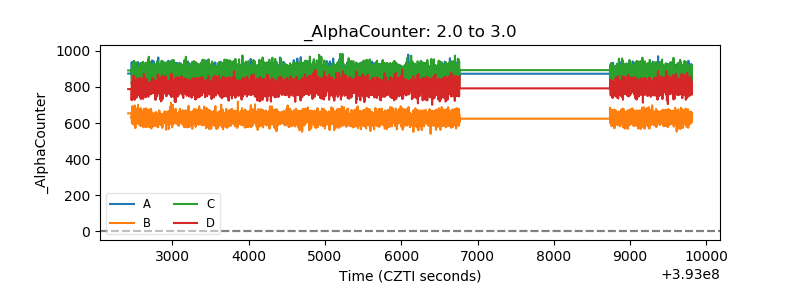 |
| _CPM_Rate | 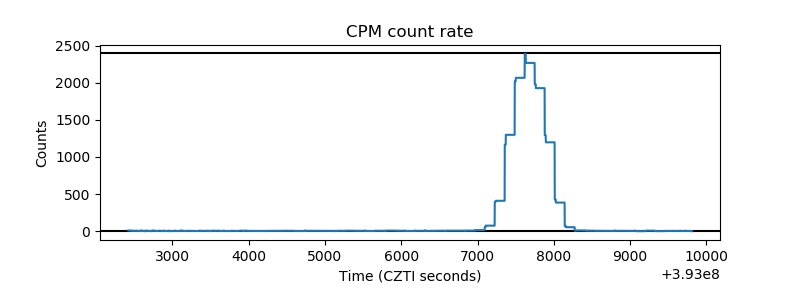 |
| CZT Counter | 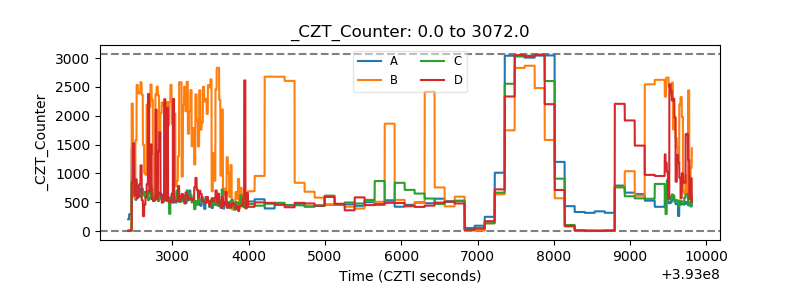 |
| +2.5 Volts monitor | 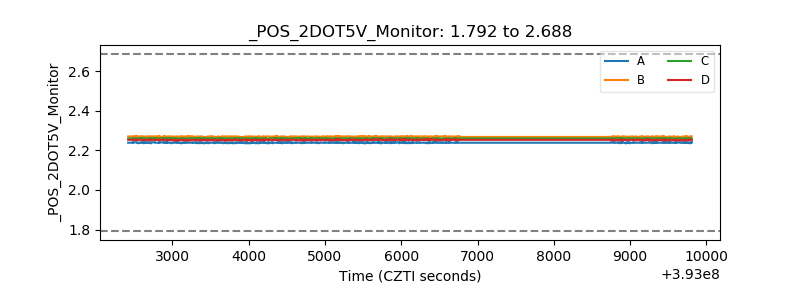 |
| +5 Volts monitor | 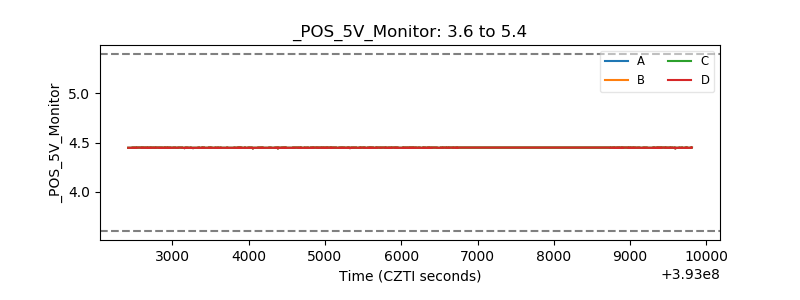 |
| _ROLL_ROT | 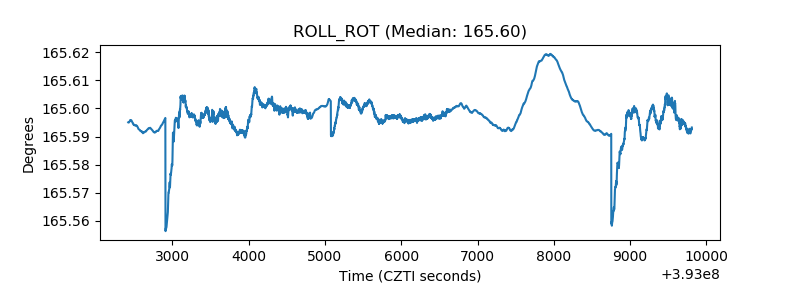 |
| _Roll_DEC | 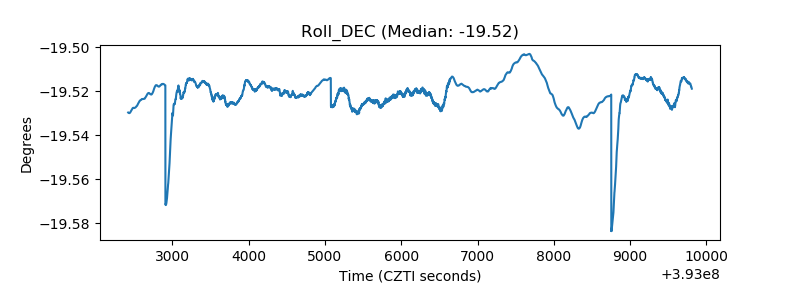 |
| _Roll_RA | 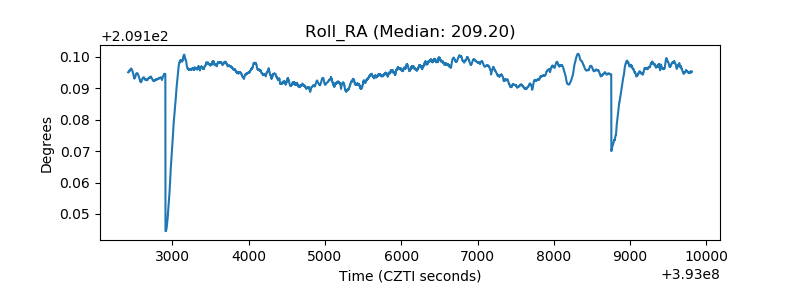 |
| Veto Counter | 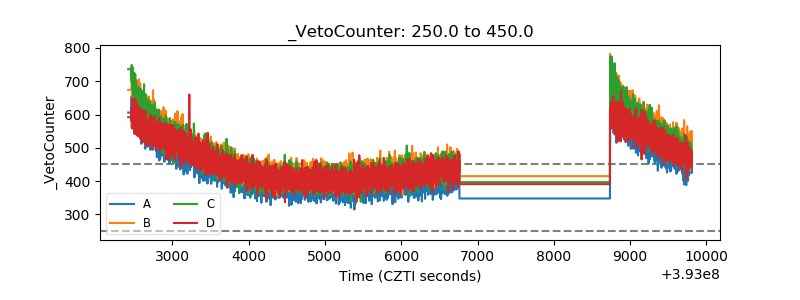 |