| Param | Original file | Final file |
|---|---|---|
| Filename | modeM0/AS1A11_089T02_9000005188_36299cztM0_level2.evt | modeM0/AS1A11_089T02_9000005188_36299cztM0_level2_quad_clean.evt |
| Size (bytes) | 468,115,200 | 84,294,720 |
| Size | 446.4 MB | 80.4 MB |
| Events in quadrant A | 2,770,575 | 564,271 |
| Events in quadrant B | 3,950,341 | 524,211 |
| Events in quadrant C | 2,964,573 | 552,670 |
| Events in quadrant D | 4,111,469 | 520,064 |
| Mode M9 | |||
|---|---|---|---|
| Quadrant | BADHDUFLAG | Total packets | Discarded packets |
| A | 0 | 22 | 0 |
| B | 0 | 22 | 0 |
| C | 0 | 22 | 0 |
| D | 0 | 23 | 0 |
| Mode M0 | |||
|---|---|---|---|
| Quadrant | BADHDUFLAG | Total packets | Discarded packets |
| A | 0 | 11793 | 3 |
| B | 0 | 15264 | 2 |
| C | 0 | 12200 | 2 |
| D | 0 | 16002 | 2 |
| Mode SS | |||
|---|---|---|---|
| Quadrant | BADHDUFLAG | Total packets | Discarded packets |
| A | 0 | 114 | 0 |
| B | 0 | 114 | 0 |
| C | 0 | 114 | 0 |
| D | 0 | 114 | 0 |
| Quadrant | Total seconds | Saturated seconds | Saturation percentage |
|---|---|---|---|
| A | 5591 | 15 | 0.268288% |
| B | 5591 | 534 | 9.551064% |
| C | 5591 | 45 | 0.804865% |
| D | 5591 | 316 | 5.651941% |
Noise dominated data is calculated using 1-second bins in cleaned event files. If a bin has >2000 counts, and if more than 50% of those come from <1% of pixels, then it is considered to be noise-dominated and hence unusable.
| Quadrant | # 1 sec bins | Bins with >0 counts | Bins with >2000 counts | High rate bins dominated by noise | Noise dominated (total time) | Noise dominated (detector-on time) | Marked lightcurve |
|---|---|---|---|---|---|---|---|
| A | 7204 | 5592 | 4 | 4 | 0.06% | 0.07% | 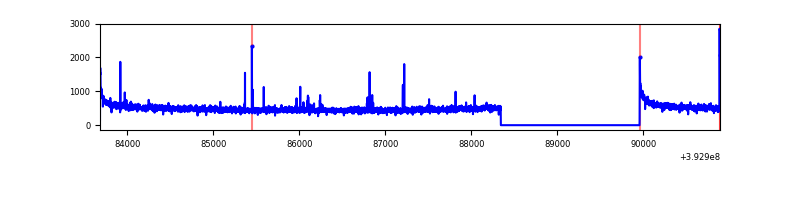 |
| B | 7204 | 5592 | 319 | 319 | 4.43% | 5.70% | 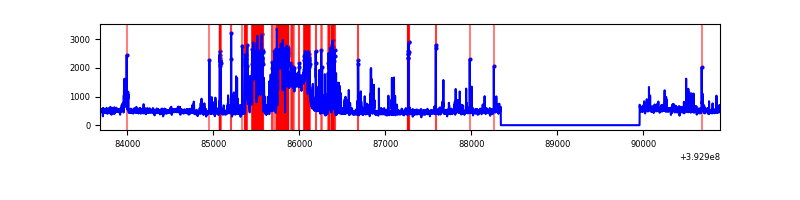 |
| C | 7204 | 5592 | 30 | 30 | 0.42% | 0.54% | 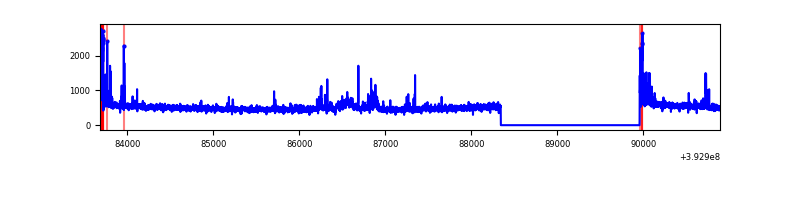 |
| D | 7204 | 5592 | 299 | 299 | 4.15% | 5.35% | 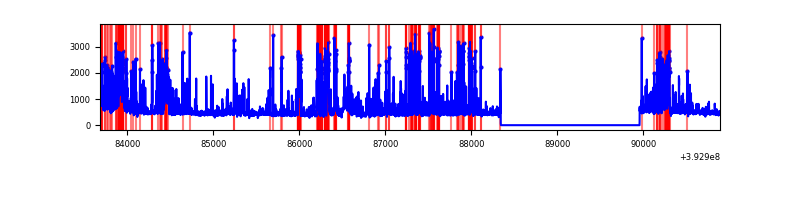 |
Top three noisy pixels from each quadrant. If the there are fewer than three noisy pixels in the level2.evt file, extra rows are filled as -1
| Pixel properties | Quadrant properties | ||||||
|---|---|---|---|---|---|---|---|
| Quadrant | DetID | PixID | Counts | Sigma | Mean | Median | Sigma |
| A | 10 | 83 | 187385 | 1417.13 | 652 | 640 | 131.8 |
| A | 9 | 143 | 33677 | 250.7 | 652 | 640 | 131.8 |
| A | 13 | 6 | 10249 | 72.92 | 652 | 640 | 131.8 |
| B | 5 | 172 | 1330574 | 11215.24 | 607 | 591 | 118.6 |
| B | 15 | 85 | 55429 | 462.43 | 607 | 591 | 118.6 |
| B | 5 | 236 | 50460 | 420.53 | 607 | 591 | 118.6 |
| C | 15 | 214 | 237988 | 1624.85 | 624 | 629 | 146.1 |
| C | 0 | 10 | 159785 | 1089.51 | 624 | 629 | 146.1 |
| C | 4 | 254 | 87713 | 596.14 | 624 | 629 | 146.1 |
| D | 12 | 6 | 650847 | 4309.77 | 619 | 602 | 150.9 |
| D | 12 | 227 | 490505 | 3247.04 | 619 | 602 | 150.9 |
| D | 13 | 171 | 260768 | 1724.36 | 619 | 602 | 150.9 |
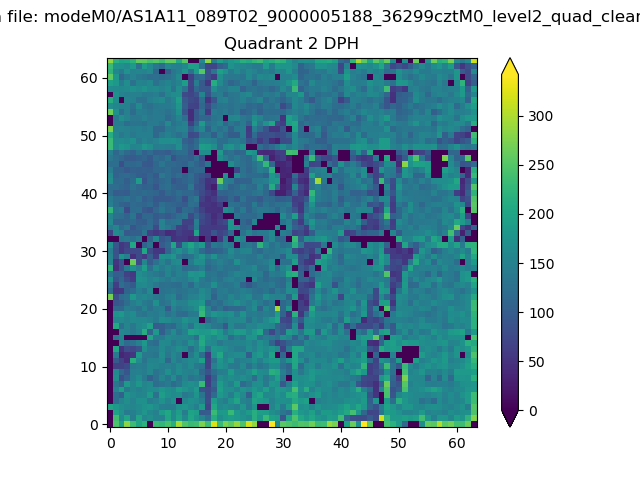
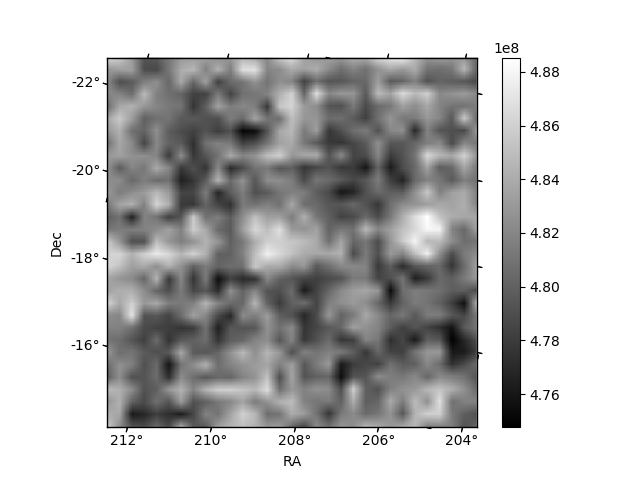
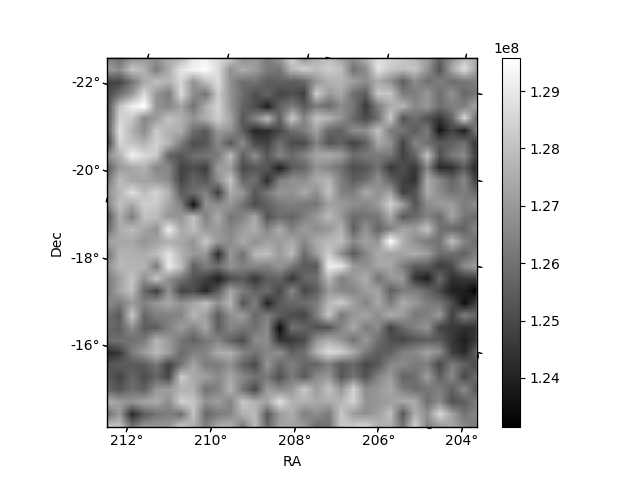
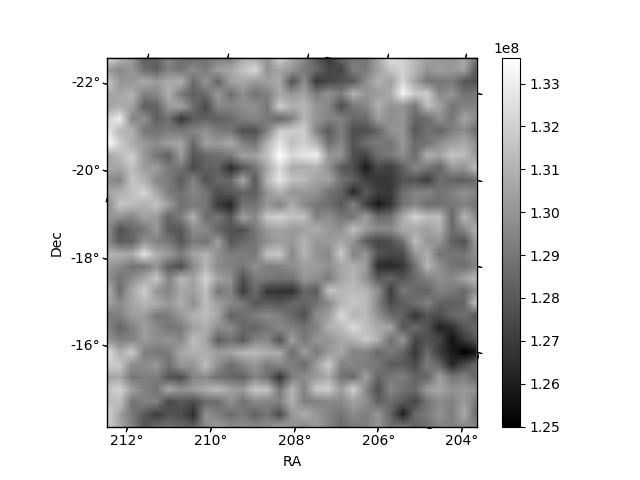
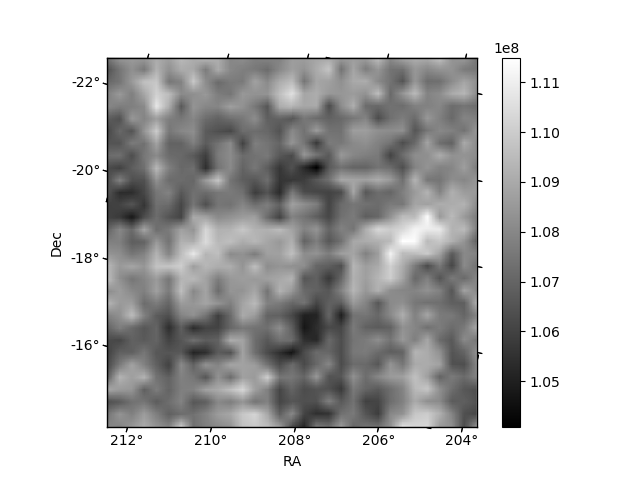
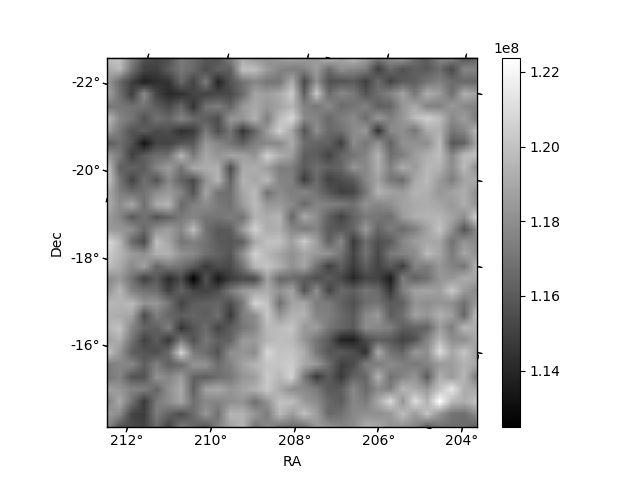
Histogram calculated using DETX and DETY for each event in the final _common_clean file
| Quadrant A | 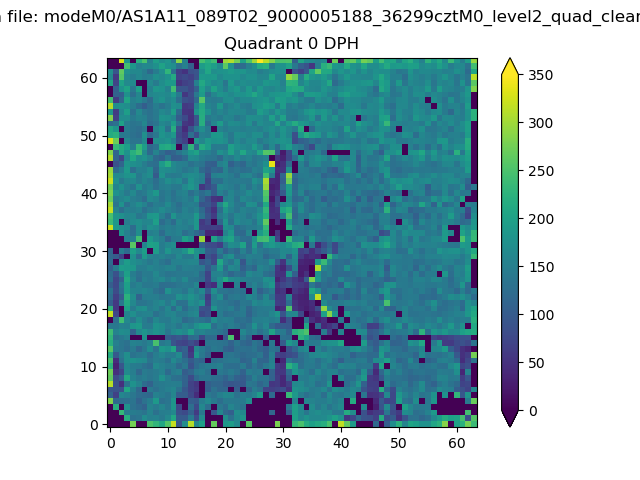 |
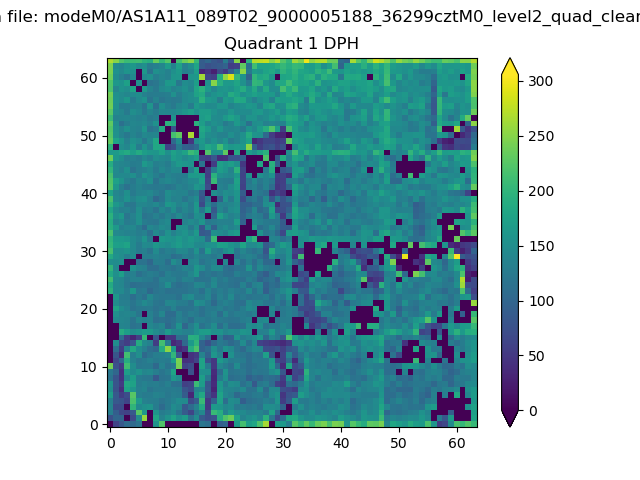 |
Quadrant B |
|---|---|---|---|
| Quadrant D | 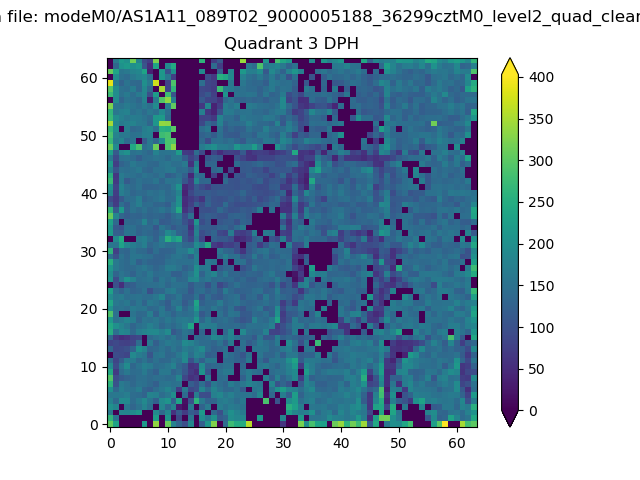 |
 |
Quadrant C |
| Plot type | Count rate plots | Images |
|---|---|---|
| Comparison with Poisson distribution Blue bars denote a histogram of data divided into 1 sec bins. Red curve is a Poisson curve with rate = median count rate of data. |
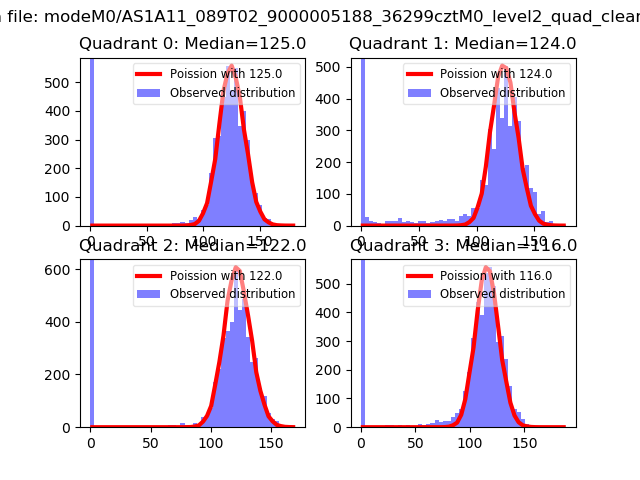 |
 |
| Quadrant-wise count rates Data is divided into 100 sec bins |
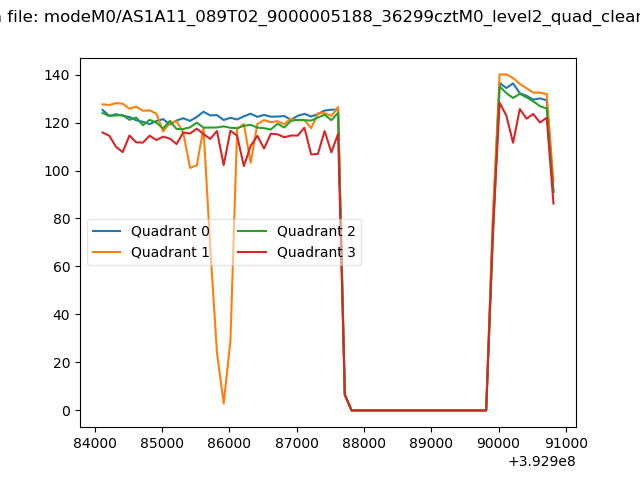 |
|
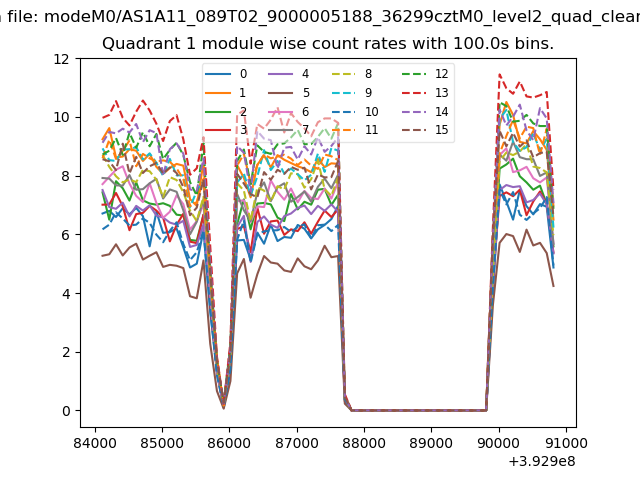
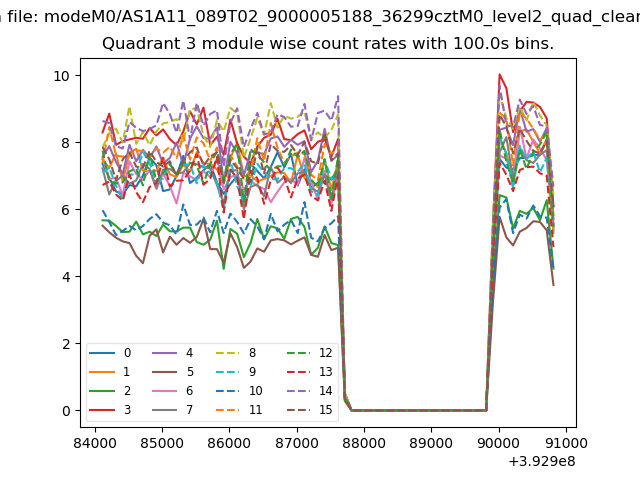
| Module-wise count rates for Quadrant A Data is divided into 100 sec bins |
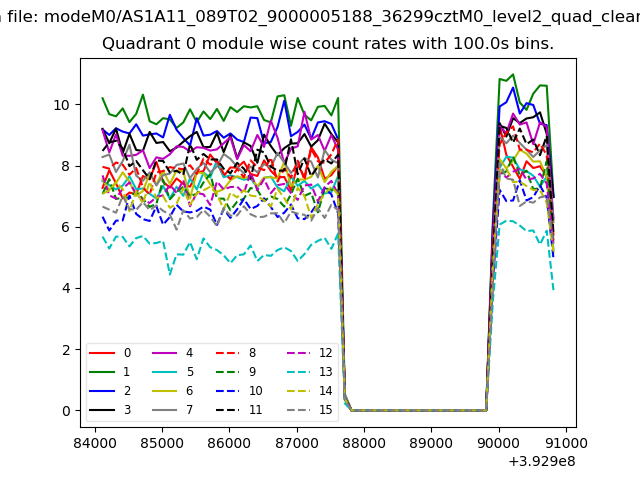 |
 |
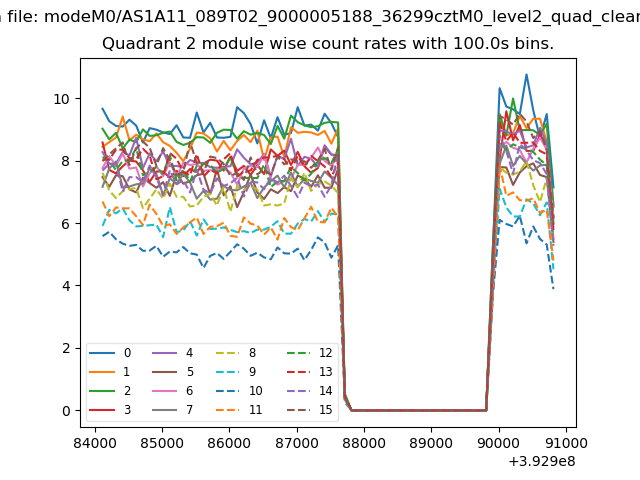
| Module-wise count rates for Quadrant B Data is divided into 100 sec bins |
 |
 |
| Module-wise count rates for Quadrant C Data is divided into 100 sec bins |
 |
 |
| Module-wise count rates for Quadrant D Data is divided into 100 sec bins |
 |
 |
| Parameter | Plot |
|---|---|
| CZT HV Monitor | 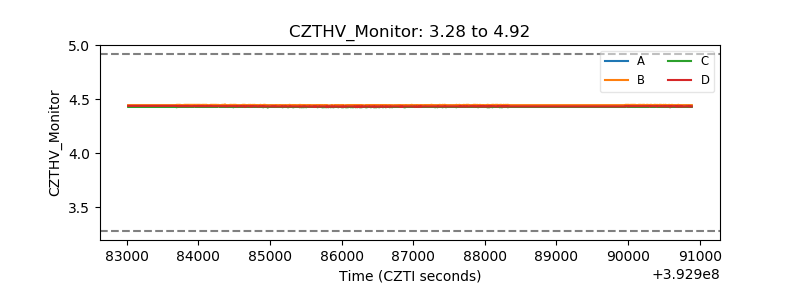 |
| D_VDD | 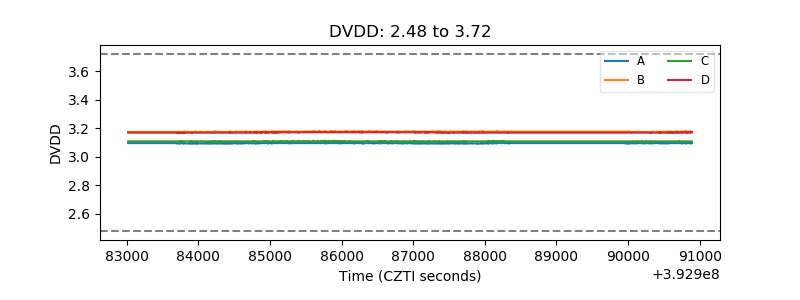 |
| Temperature 1 | 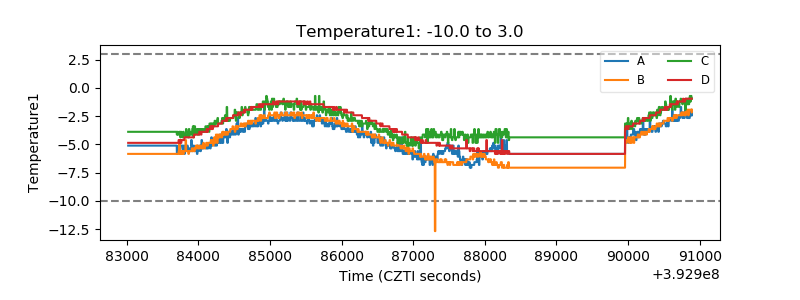 |
| Veto HV Monitor | 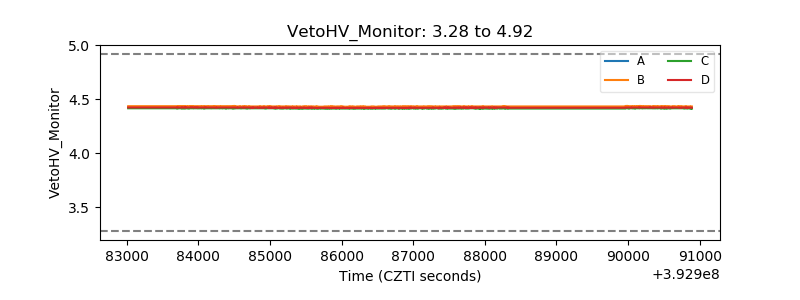 |
| Veto LLD | 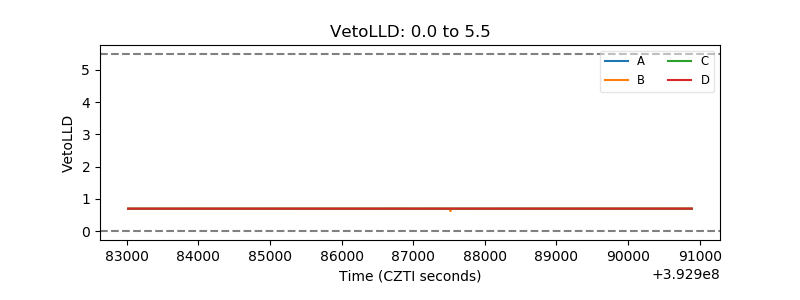 |
| Alpha Counter | 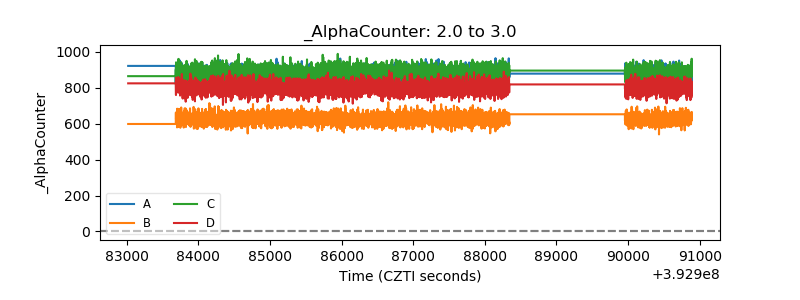 |
| _CPM_Rate | 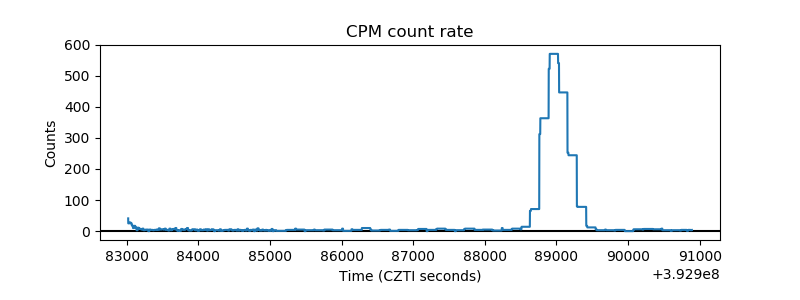 |
| CZT Counter | 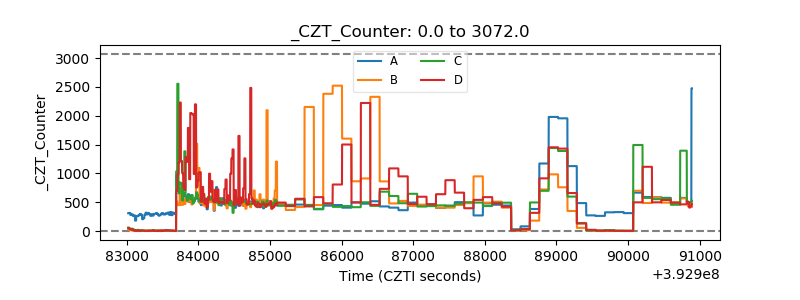 |
| +2.5 Volts monitor | 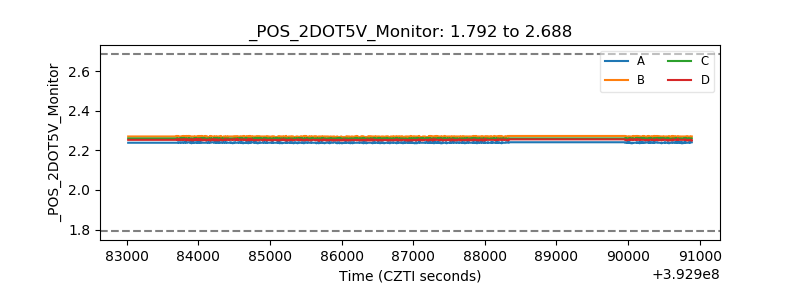 |
| +5 Volts monitor | 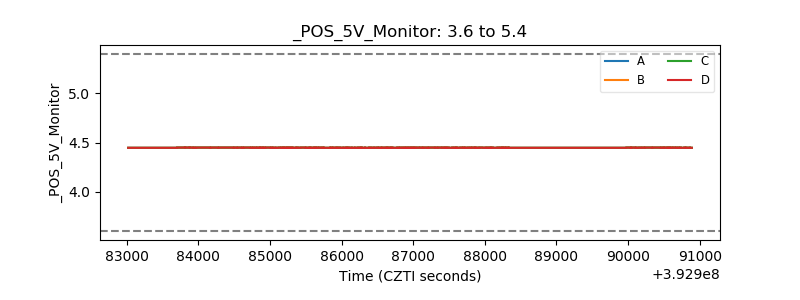 |
| _ROLL_ROT | 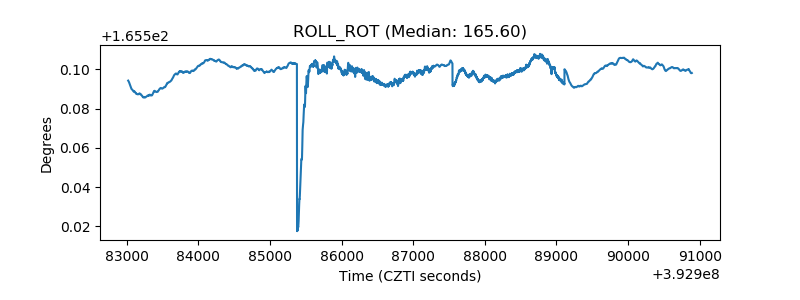 |
| _Roll_DEC | 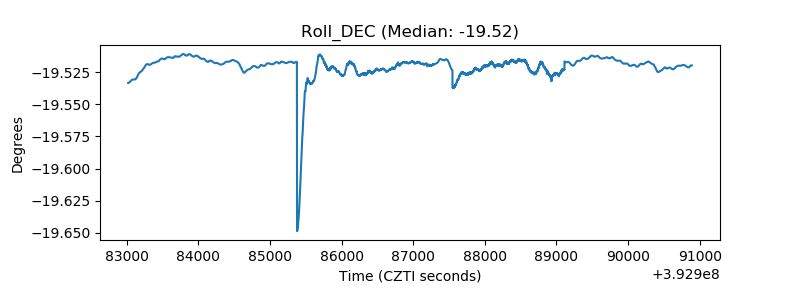 |
| _Roll_RA | 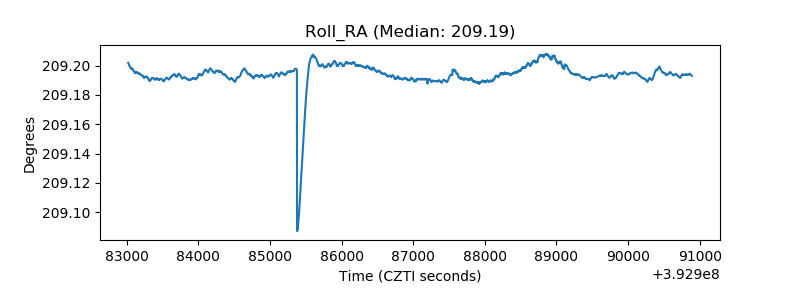 |
| Veto Counter | 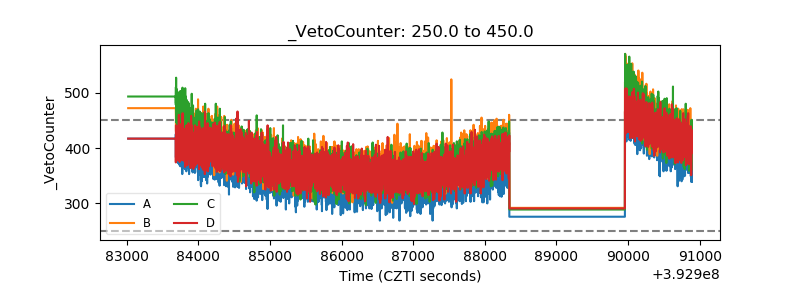 |