| Param | Original file | Final file |
|---|---|---|
| Filename | modeM0/AS1A10_071T33_9000005186_36298cztM0_level2.evt | modeM0/AS1A10_071T33_9000005186_36298cztM0_level2_quad_clean.evt |
| Size (bytes) | 1,348,712,640 | 187,634,880 |
| Size | 1.3 GB | 178.9 MB |
| Events in quadrant A | 6,595,375 | 1,265,068 |
| Events in quadrant B | 10,068,991 | 1,231,422 |
| Events in quadrant C | 7,002,361 | 1,256,818 |
| Events in quadrant D | 16,251,335 | 977,411 |
| Mode M0 | |||
|---|---|---|---|
| Quadrant | BADHDUFLAG | Total packets | Discarded packets |
| A | 0 | 28287 | 3 |
| B | 0 | 38787 | 3 |
| C | 0 | 28917 | 3 |
| D | 0 | 57648 | 3 |
| Mode SS | |||
|---|---|---|---|
| Quadrant | BADHDUFLAG | Total packets | Discarded packets |
| A | 0 | 282 | 0 |
| B | 0 | 282 | 0 |
| C | 0 | 282 | 0 |
| D | 0 | 282 | 0 |
| Mode M9 | |||
|---|---|---|---|
| Quadrant | BADHDUFLAG | Total packets | Discarded packets |
| A | 0 | 39 | 0 |
| B | 0 | 39 | 0 |
| C | 0 | 39 | 0 |
| D | 0 | 39 | 0 |
| Quadrant | Total seconds | Saturated seconds | Saturation percentage |
|---|---|---|---|
| A | 13760 | 24 | 0.174419% |
| B | 13760 | 905 | 6.577035% |
| C | 13760 | 128 | 0.930233% |
| D | 13760 | 3285 | 23.873547% |
Noise dominated data is calculated using 1-second bins in cleaned event files. If a bin has >2000 counts, and if more than 50% of those come from <1% of pixels, then it is considered to be noise-dominated and hence unusable.
| Quadrant | # 1 sec bins | Bins with >0 counts | Bins with >2000 counts | High rate bins dominated by noise | Noise dominated (total time) | Noise dominated (detector-on time) | Marked lightcurve |
|---|---|---|---|---|---|---|---|
| A | 17760 | 13763 | 8 | 8 | 0.05% | 0.06% | 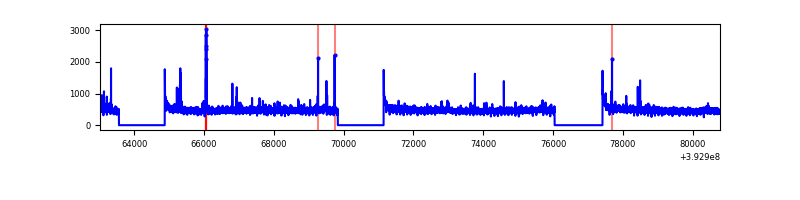 |
| B | 17760 | 13763 | 777 | 777 | 4.38% | 5.65% | 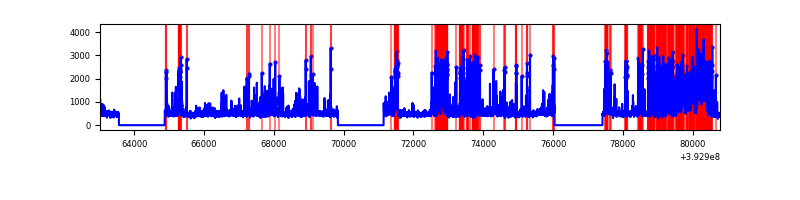 |
| C | 17760 | 13763 | 94 | 94 | 0.53% | 0.68% | 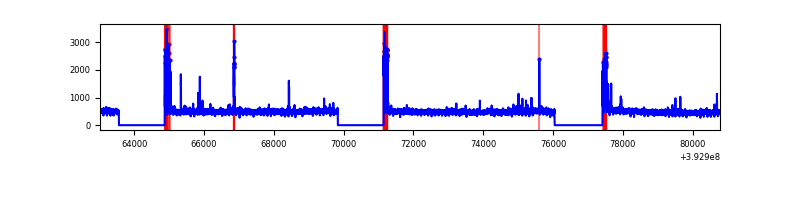 |
| D | 17760 | 13763 | 3308 | 3308 | 18.63% | 24.04% | 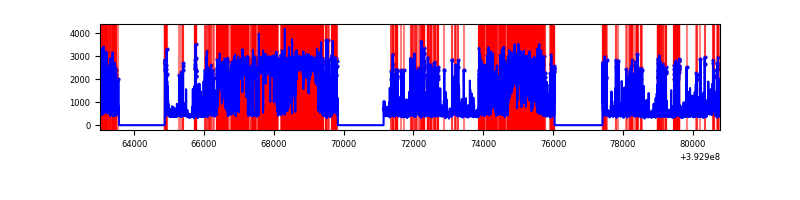 |
Top three noisy pixels from each quadrant. If the there are fewer than three noisy pixels in the level2.evt file, extra rows are filled as -1
| Pixel properties | Quadrant properties | ||||||
|---|---|---|---|---|---|---|---|
| Quadrant | DetID | PixID | Counts | Sigma | Mean | Median | Sigma |
| A | 10 | 83 | 360890 | 1130.89 | 1575 | 1544 | 317.8 |
| A | 9 | 143 | 83840 | 258.99 | 1575 | 1544 | 317.8 |
| A | 12 | 189 | 36762 | 110.83 | 1575 | 1544 | 317.8 |
| B | 5 | 172 | 2140272 | 7274.71 | 1523 | 1480 | 294.0 |
| B | 5 | 236 | 1080176 | 3668.99 | 1523 | 1480 | 294.0 |
| B | 0 | 155 | 354731 | 1201.52 | 1523 | 1480 | 294.0 |
| C | 15 | 214 | 572724 | 1598.92 | 1527 | 1535 | 357.2 |
| C | 0 | 10 | 393386 | 1096.9 | 1527 | 1535 | 357.2 |
| C | 0 | 207 | 55196 | 150.21 | 1527 | 1535 | 357.2 |
| D | 12 | 227 | 5622542 | 16717.02 | 1361 | 1322 | 336.3 |
| D | 7 | 223 | 2854158 | 8484.09 | 1361 | 1322 | 336.3 |
| D | 12 | 6 | 1492818 | 4435.58 | 1361 | 1322 | 336.3 |
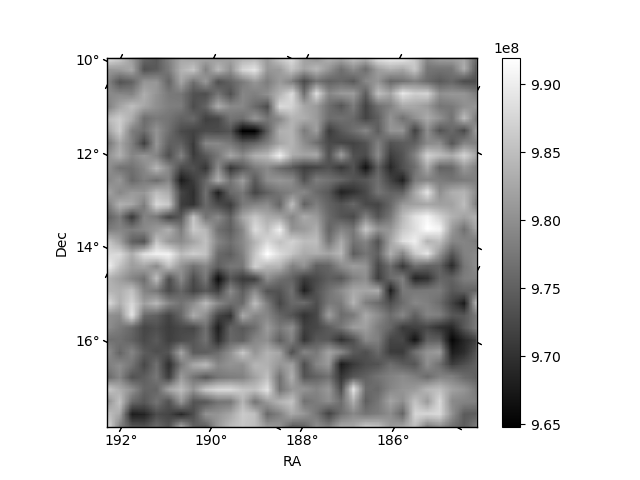
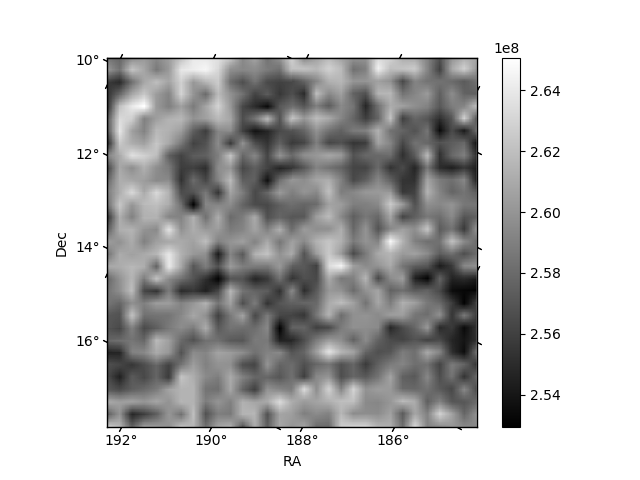
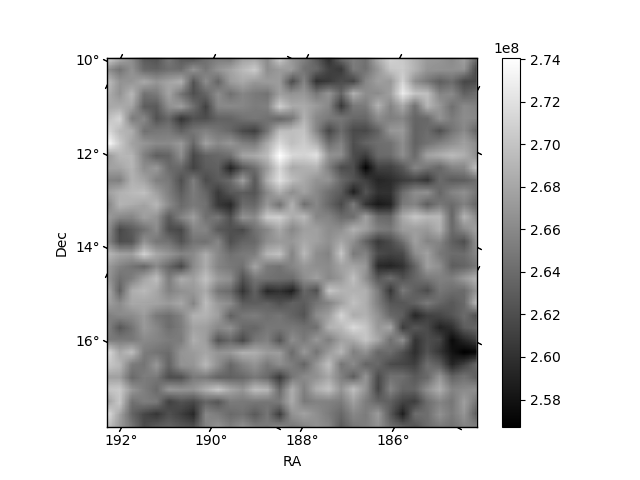
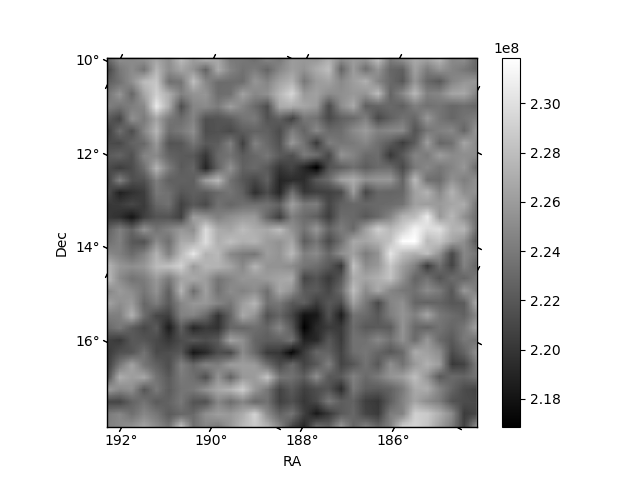
Histogram calculated using DETX and DETY for each event in the final _common_clean file
| Quadrant A | 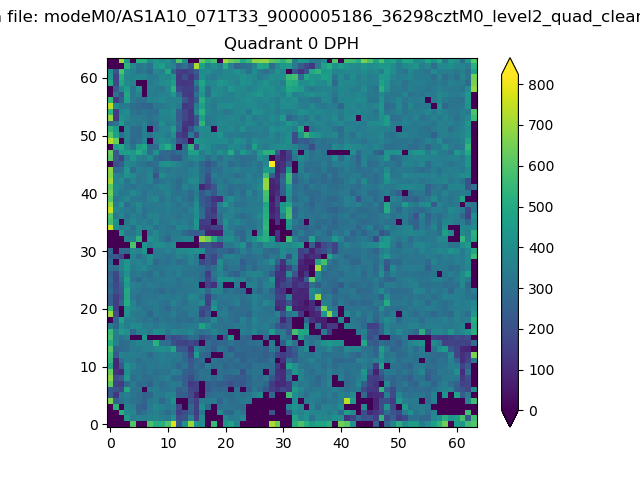 |
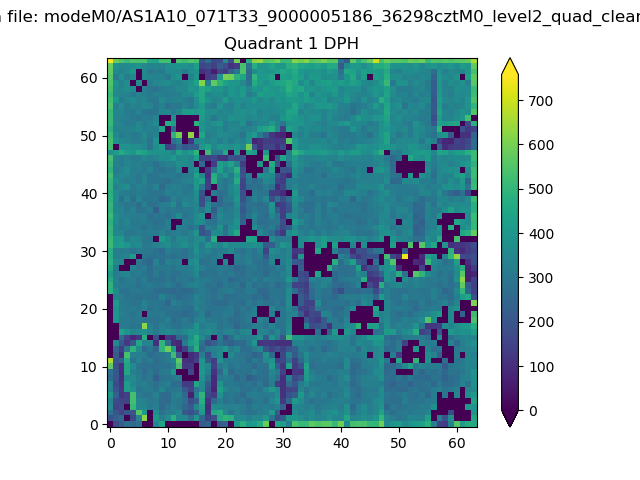 |
Quadrant B |
|---|---|---|---|
| Quadrant D | 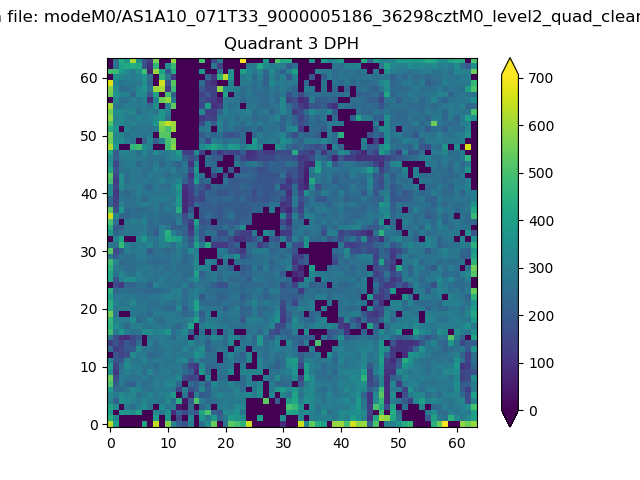 |
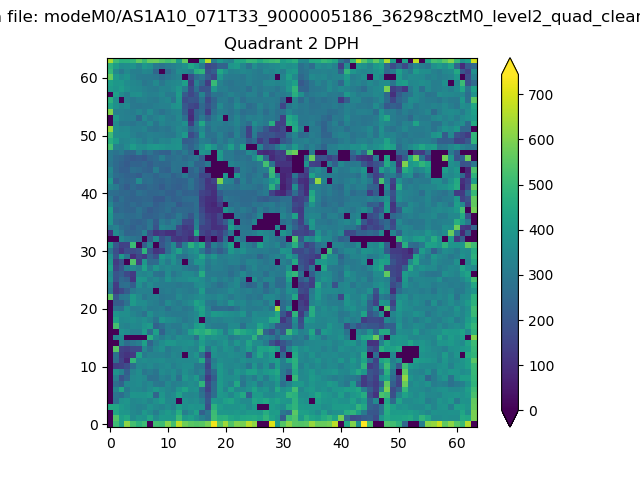 |
Quadrant C |
| Plot type | Count rate plots | Images |
|---|---|---|
| Comparison with Poisson distribution Blue bars denote a histogram of data divided into 1 sec bins. Red curve is a Poisson curve with rate = median count rate of data. |
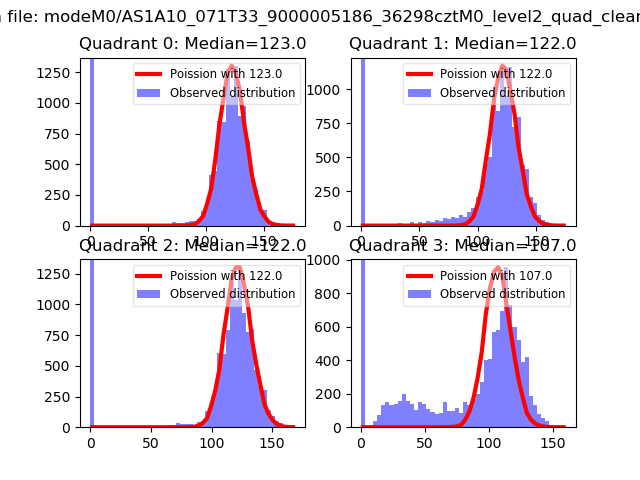 |
 |
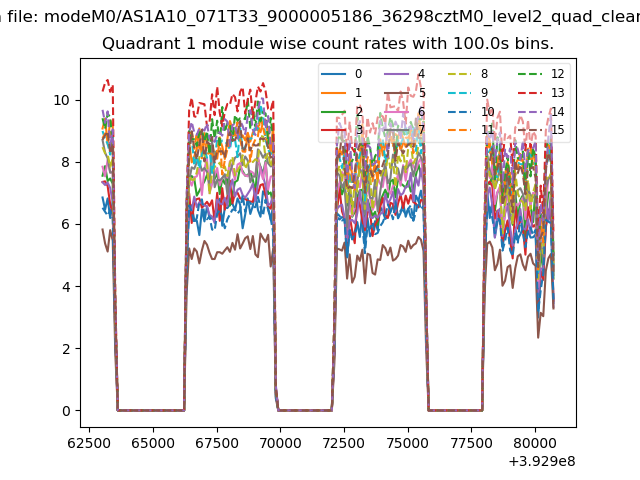
| Quadrant-wise count rates Data is divided into 100 sec bins |
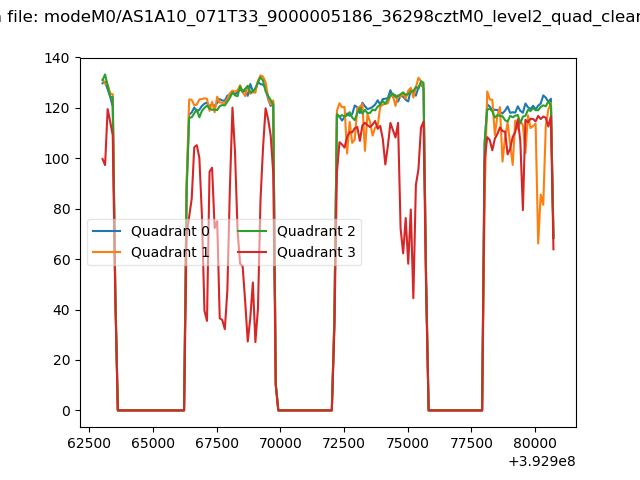 |
|
| Module-wise count rates for Quadrant A Data is divided into 100 sec bins |
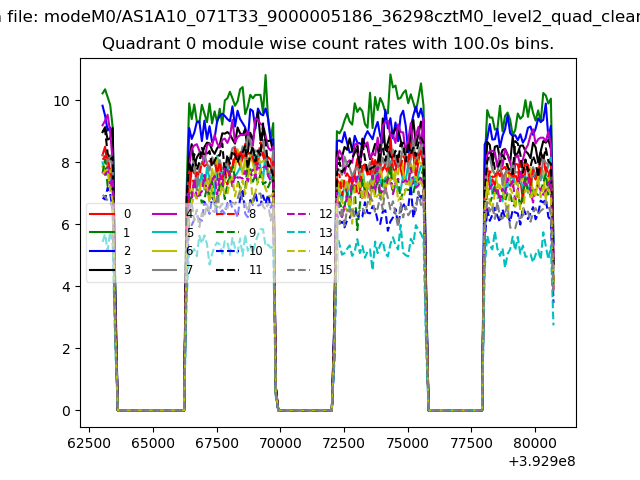 |
 |
| Module-wise count rates for Quadrant B Data is divided into 100 sec bins |
 |
 |
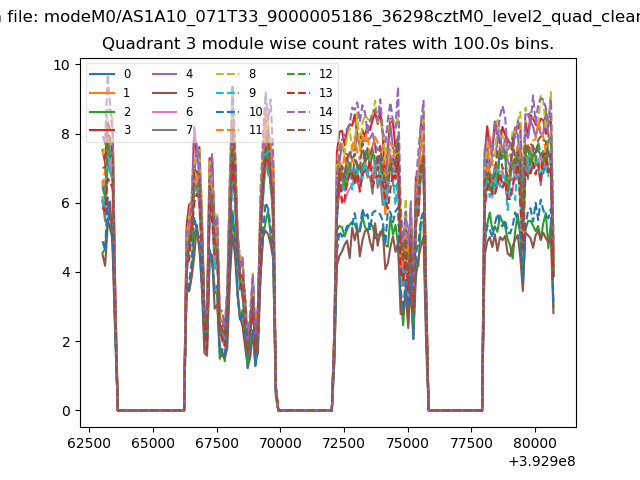
| Module-wise count rates for Quadrant C Data is divided into 100 sec bins |
 |
 |
| Module-wise count rates for Quadrant D Data is divided into 100 sec bins |
 |
 |
| Parameter | Plot |
|---|---|
| CZT HV Monitor | 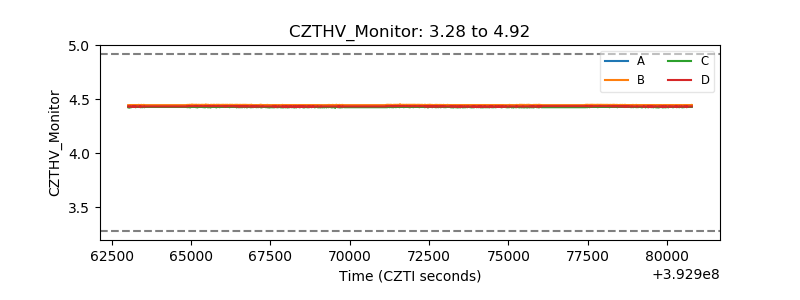 |
| D_VDD | 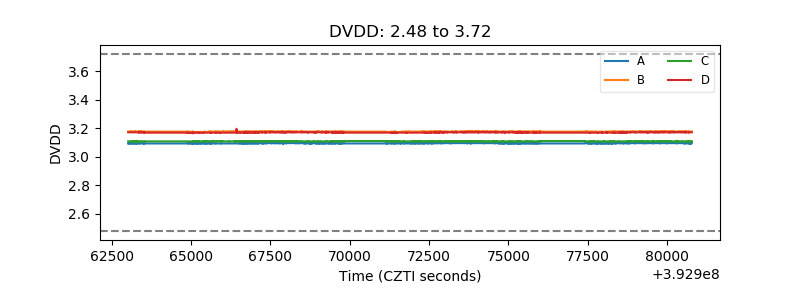 |
| Temperature 1 | 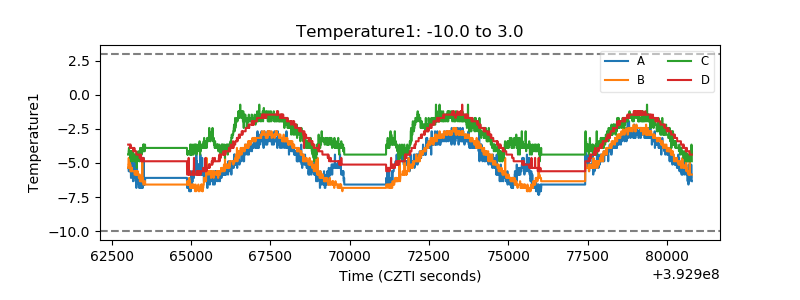 |
| Veto HV Monitor | 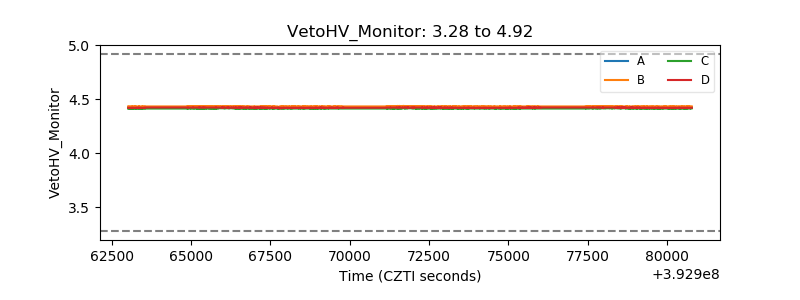 |
| Veto LLD | 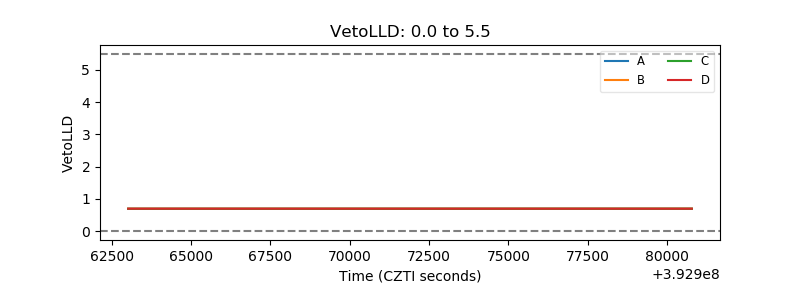 |
| Alpha Counter | 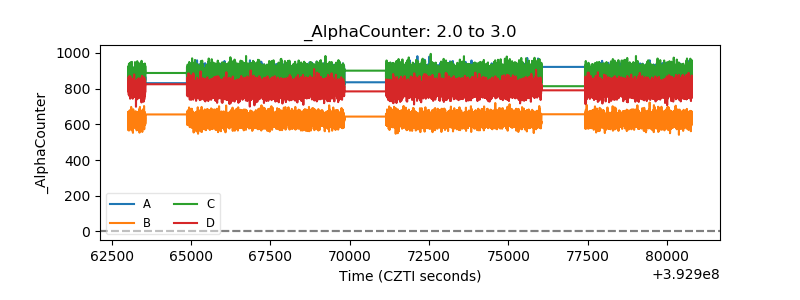 |
| _CPM_Rate | 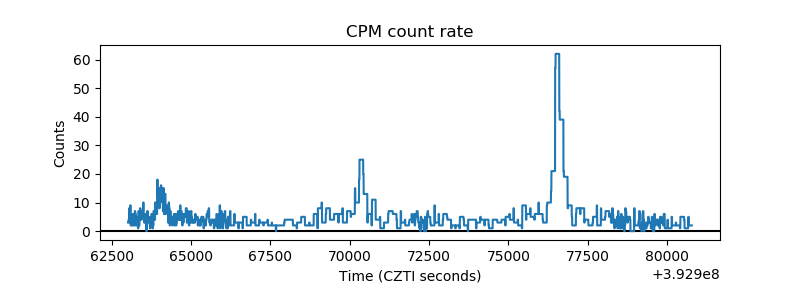 |
| CZT Counter | 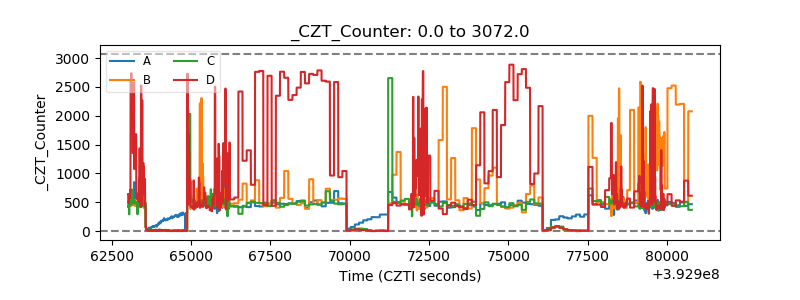 |
| +2.5 Volts monitor | 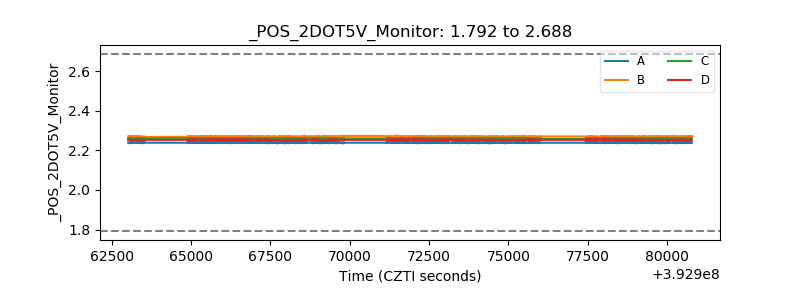 |
| +5 Volts monitor | 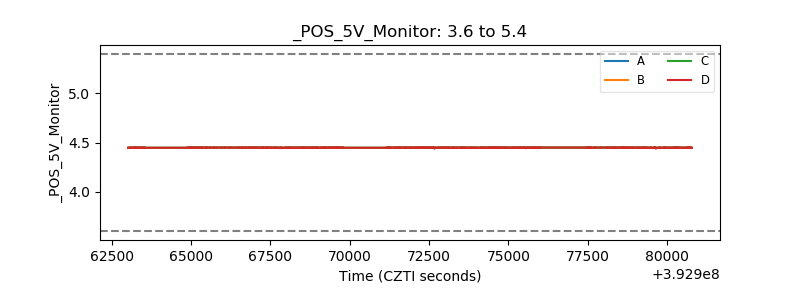 |
| _ROLL_ROT | 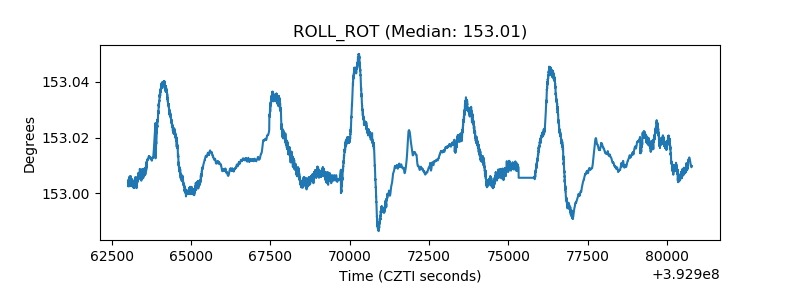 |
| _Roll_DEC | 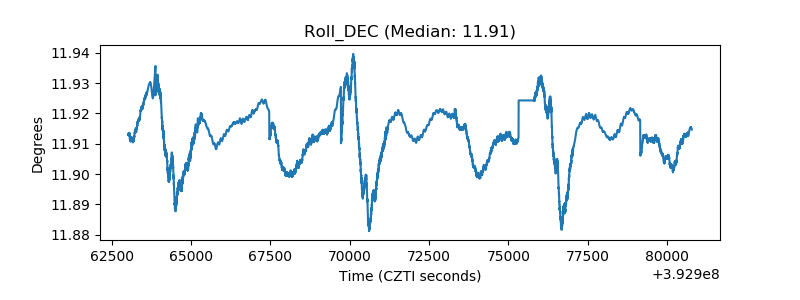 |
| _Roll_RA | 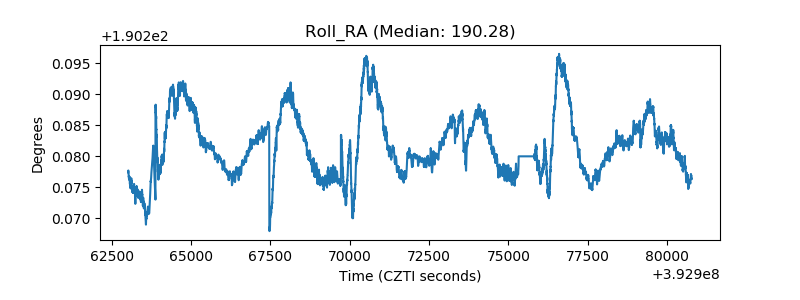 |
| Veto Counter | 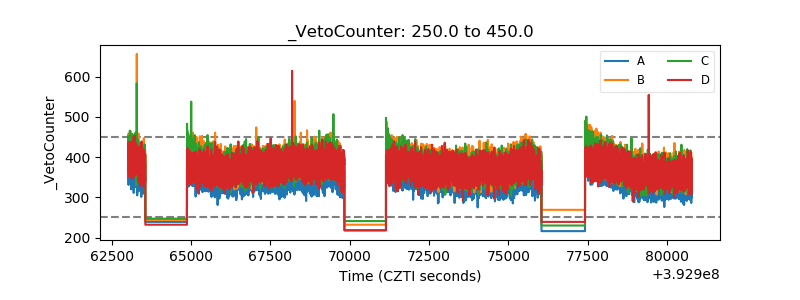 |