| Param | Original file | Final file |
|---|---|---|
| Filename | modeM0/AS1A10_071T33_9000005186_36292cztM0_level2.evt | modeM0/AS1A10_071T33_9000005186_36292cztM0_level2_quad_clean.evt |
| Size (bytes) | 383,803,200 | 53,726,400 |
| Size | 366.0 MB | 51.2 MB |
| Events in quadrant A | 2,471,858 | 325,180 |
| Events in quadrant B | 3,387,985 | 325,898 |
| Events in quadrant C | 2,637,682 | 321,335 |
| Events in quadrant D | 2,789,260 | 306,786 |
| Mode M0 | |||
|---|---|---|---|
| Quadrant | BADHDUFLAG | Total packets | Discarded packets |
| A | 0 | 10393 | 3 |
| B | 0 | 13316 | 2 |
| C | 0 | 10699 | 2 |
| D | 0 | 11578 | 2 |
| Mode SS | |||
|---|---|---|---|
| Quadrant | BADHDUFLAG | Total packets | Discarded packets |
| A | 0 | 100 | 0 |
| B | 0 | 100 | 0 |
| C | 0 | 100 | 0 |
| D | 0 | 100 | 0 |
| Mode M9 | |||
|---|---|---|---|
| Quadrant | BADHDUFLAG | Total packets | Discarded packets |
| A | 0 | 33 | 0 |
| B | 0 | 33 | 0 |
| C | 0 | 33 | 0 |
| D | 0 | 34 | 0 |
| Quadrant | Total seconds | Saturated seconds | Saturation percentage |
|---|---|---|---|
| A | 4954 | 12 | 0.242229% |
| B | 4954 | 155 | 3.128785% |
| C | 4954 | 45 | 0.908357% |
| D | 4954 | 28 | 0.565200% |
Noise dominated data is calculated using 1-second bins in cleaned event files. If a bin has >2000 counts, and if more than 50% of those come from <1% of pixels, then it is considered to be noise-dominated and hence unusable.
| Quadrant | # 1 sec bins | Bins with >0 counts | Bins with >2000 counts | High rate bins dominated by noise | Noise dominated (total time) | Noise dominated (detector-on time) | Marked lightcurve |
|---|---|---|---|---|---|---|---|
| A | 7017 | 4955 | 3 | 3 | 0.04% | 0.06% | 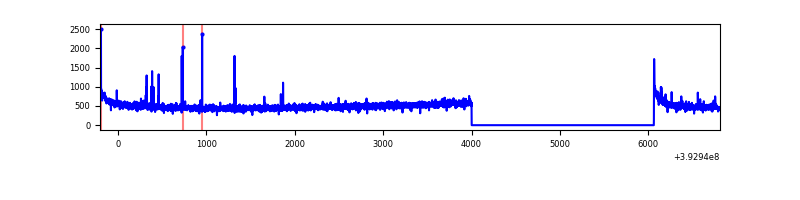 |
| B | 7017 | 4955 | 76 | 76 | 1.08% | 1.53% | 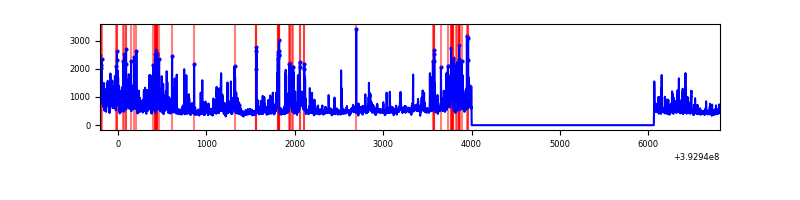 |
| C | 7017 | 4955 | 35 | 35 | 0.50% | 0.71% | 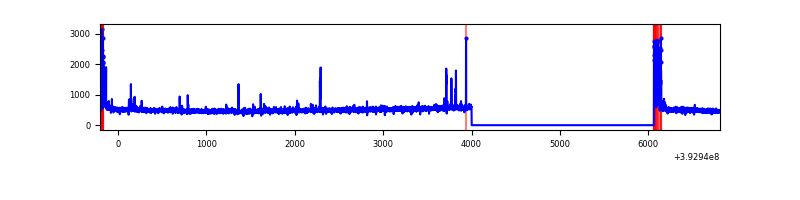 |
| D | 7017 | 4955 | 25 | 25 | 0.36% | 0.50% | 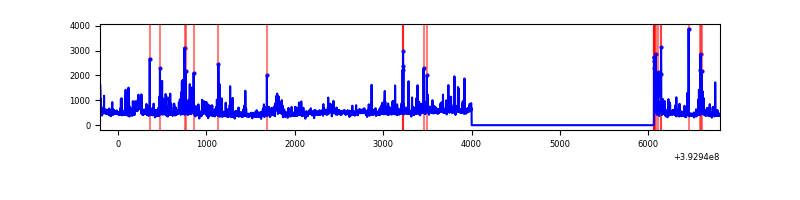 |
Top three noisy pixels from each quadrant. If the there are fewer than three noisy pixels in the level2.evt file, extra rows are filled as -1
| Pixel properties | Quadrant properties | ||||||
|---|---|---|---|---|---|---|---|
| Quadrant | DetID | PixID | Counts | Sigma | Mean | Median | Sigma |
| A | 10 | 83 | 168727 | 1425.83 | 583 | 573 | 117.9 |
| A | 9 | 143 | 17349 | 142.25 | 583 | 573 | 117.9 |
| A | 13 | 6 | 11413 | 91.92 | 583 | 573 | 117.9 |
| B | 4 | 171 | 604930 | 5405.52 | 577 | 561 | 111.8 |
| B | 5 | 172 | 157720 | 1405.64 | 577 | 561 | 111.8 |
| B | 5 | 236 | 127238 | 1133.01 | 577 | 561 | 111.8 |
| C | 15 | 214 | 209295 | 1568.22 | 567 | 572 | 133.1 |
| C | 0 | 10 | 168608 | 1262.52 | 567 | 572 | 133.1 |
| C | 0 | 207 | 30590 | 225.54 | 567 | 572 | 133.1 |
| D | 7 | 223 | 214070 | 1528.95 | 561 | 546 | 139.7 |
| D | 13 | 171 | 80780 | 574.52 | 561 | 546 | 139.7 |
| D | 1 | 20 | 80503 | 572.54 | 561 | 546 | 139.7 |
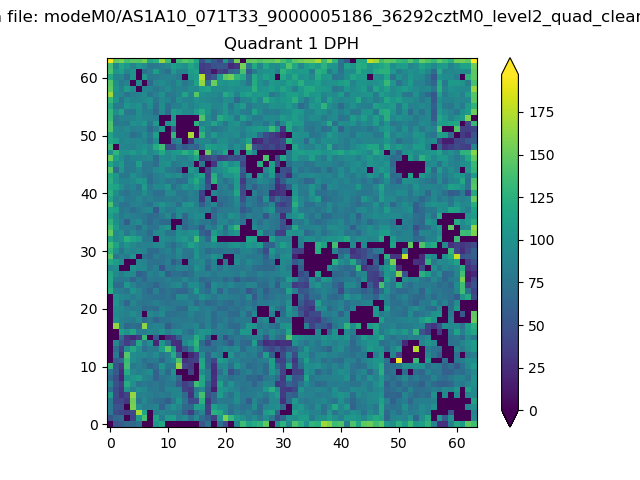
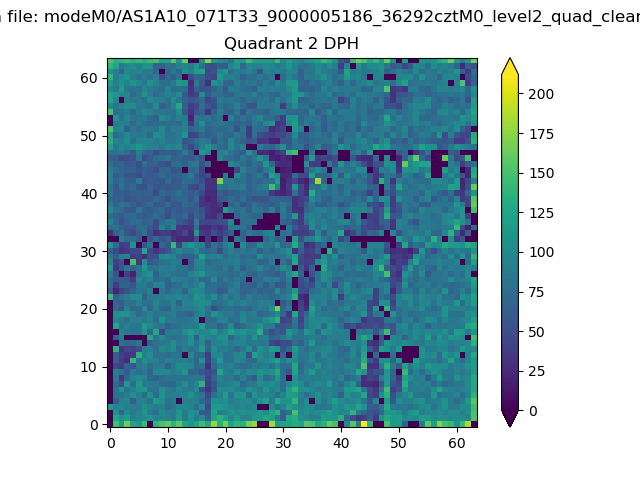
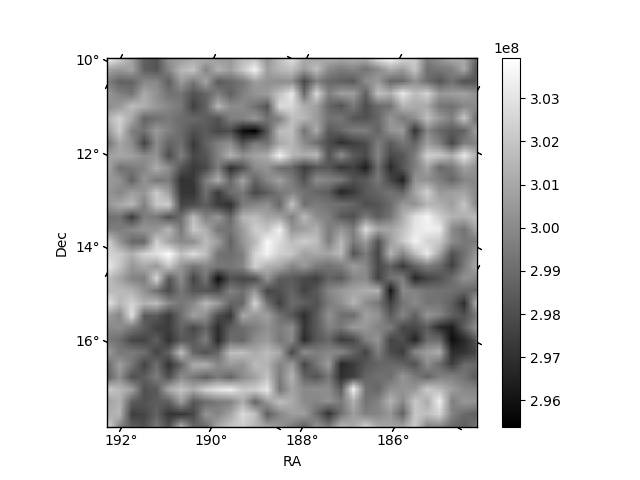
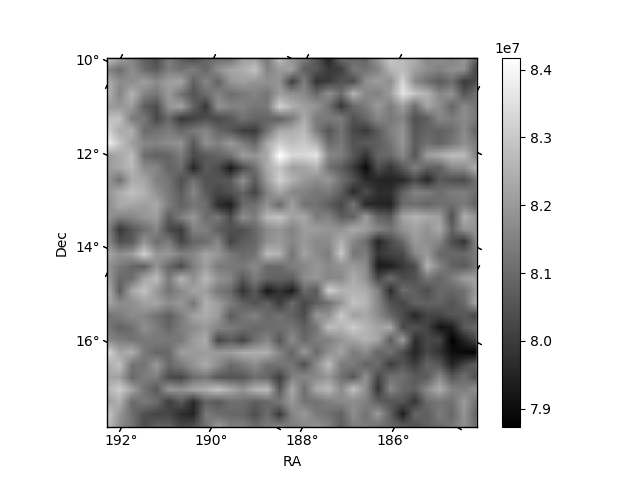
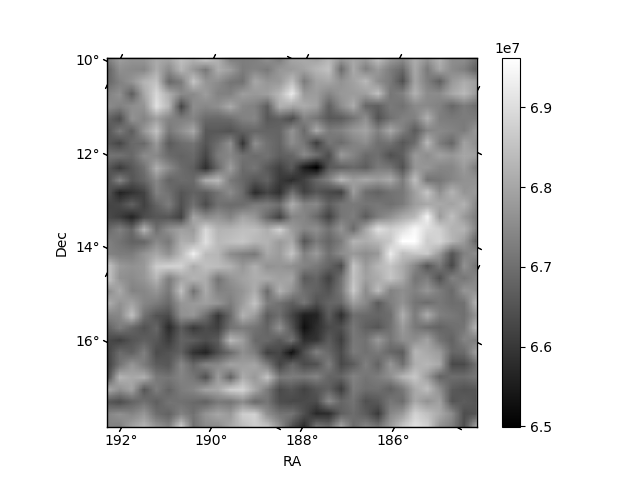
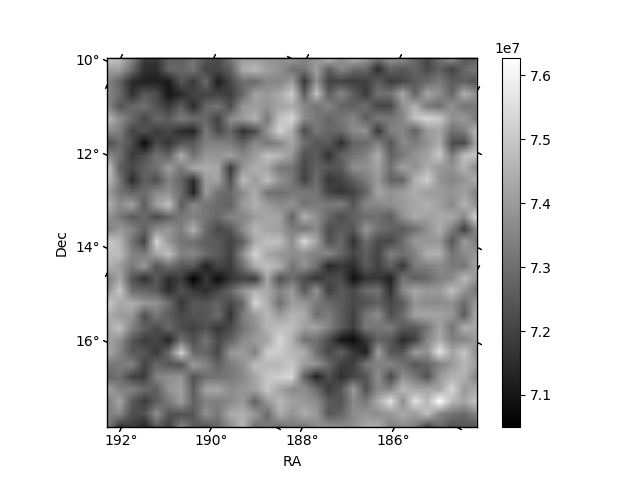
Histogram calculated using DETX and DETY for each event in the final _common_clean file
| Quadrant A |  |
 |
Quadrant B |
|---|---|---|---|
| Quadrant D | 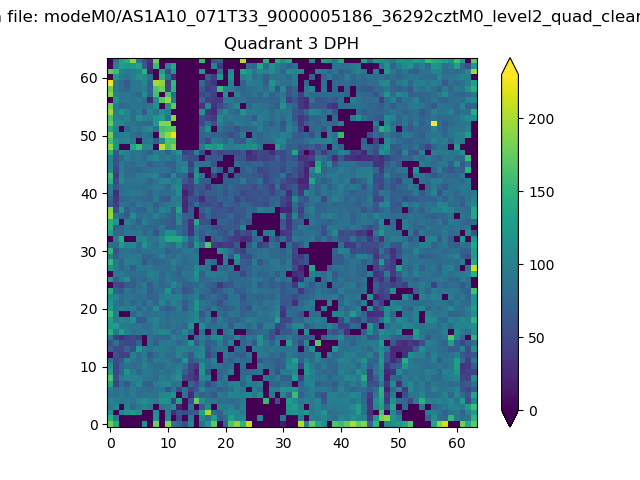 |
 |
Quadrant C |
| Plot type | Count rate plots | Images |
|---|---|---|
| Comparison with Poisson distribution Blue bars denote a histogram of data divided into 1 sec bins. Red curve is a Poisson curve with rate = median count rate of data. |
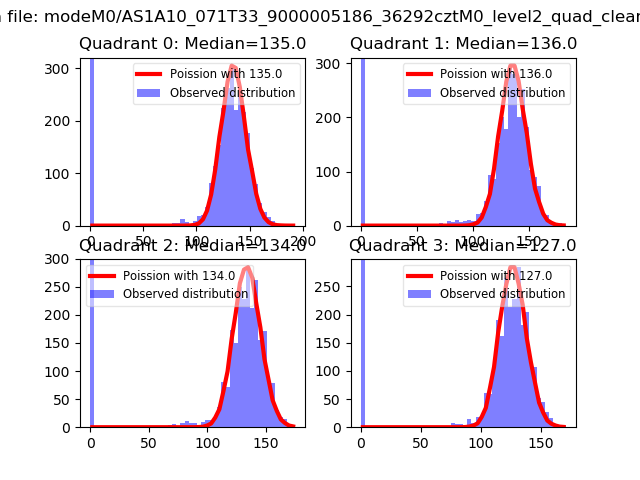 |
 |
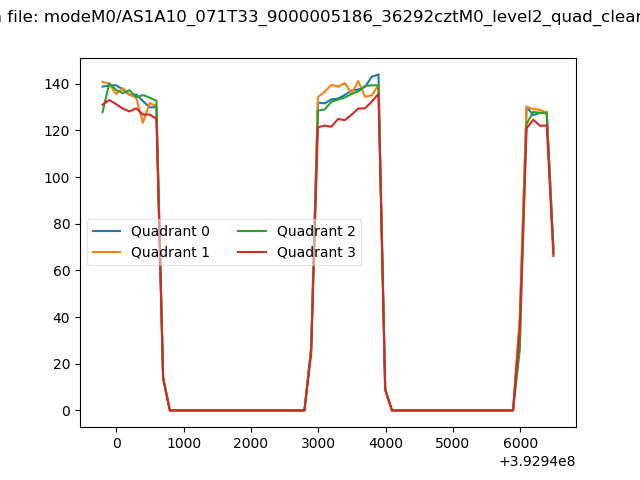
| Quadrant-wise count rates Data is divided into 100 sec bins |
 |
|
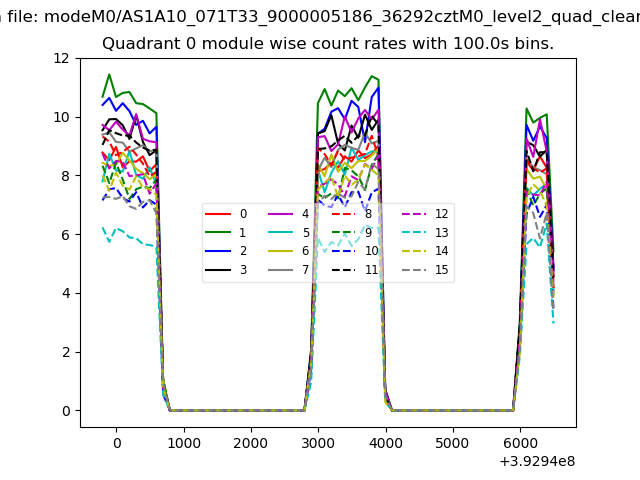
| Module-wise count rates for Quadrant A Data is divided into 100 sec bins |
 |
 |
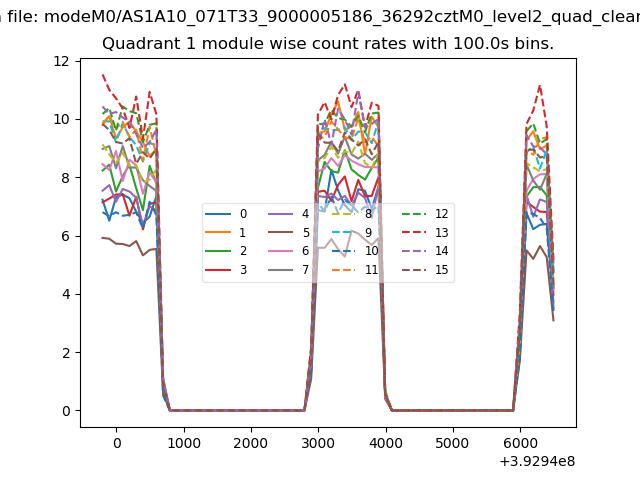
| Module-wise count rates for Quadrant B Data is divided into 100 sec bins |
 |
 |
| Module-wise count rates for Quadrant C Data is divided into 100 sec bins |
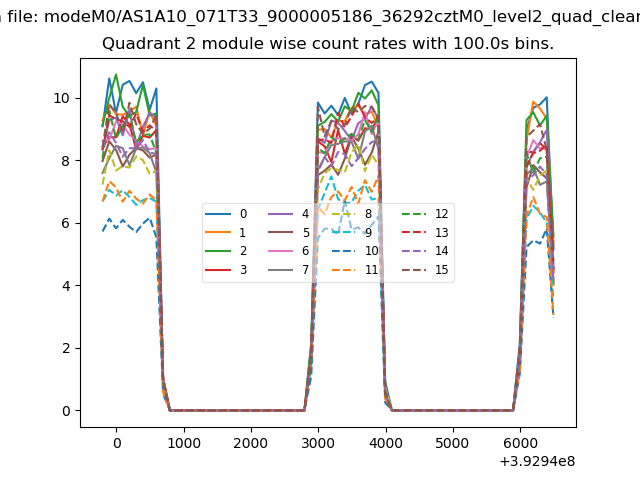 |
 |
| Module-wise count rates for Quadrant D Data is divided into 100 sec bins |
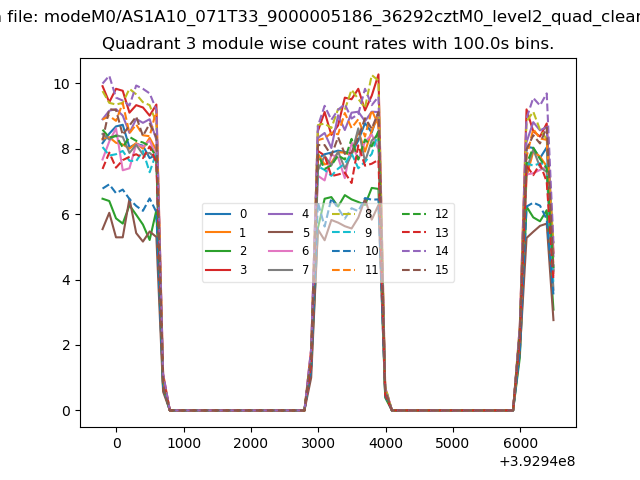 |
 |
| Parameter | Plot |
|---|---|
| CZT HV Monitor | 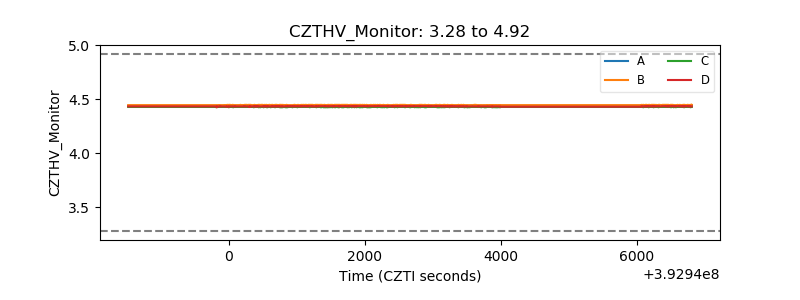 |
| D_VDD | 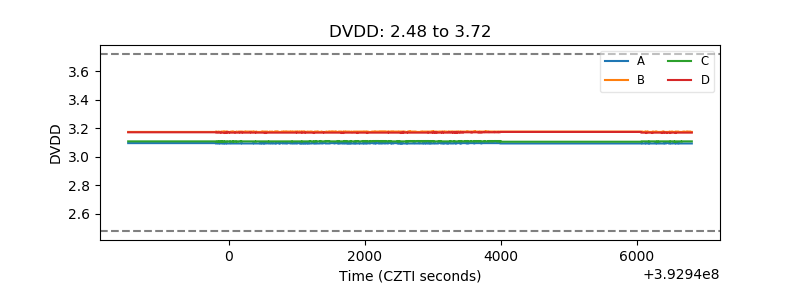 |
| Temperature 1 | 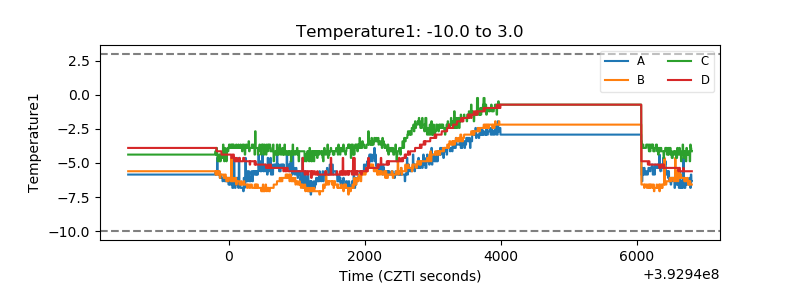 |
| Veto HV Monitor | 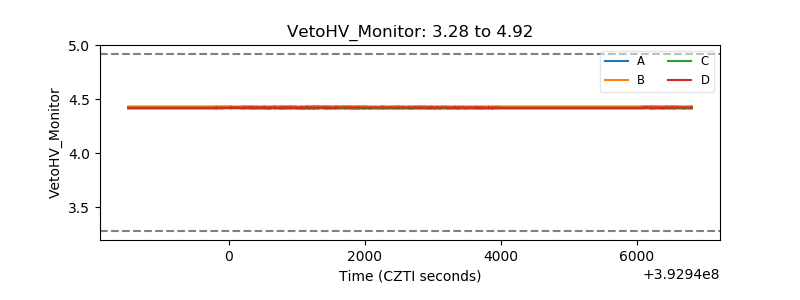 |
| Veto LLD | 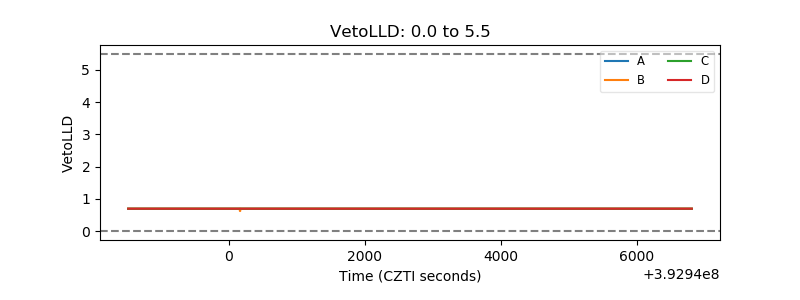 |
| Alpha Counter | 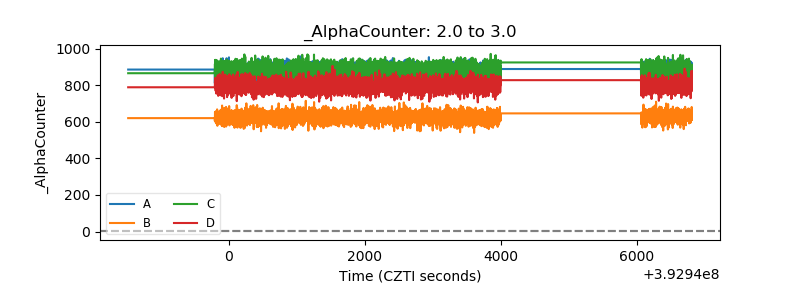 |
| _CPM_Rate | 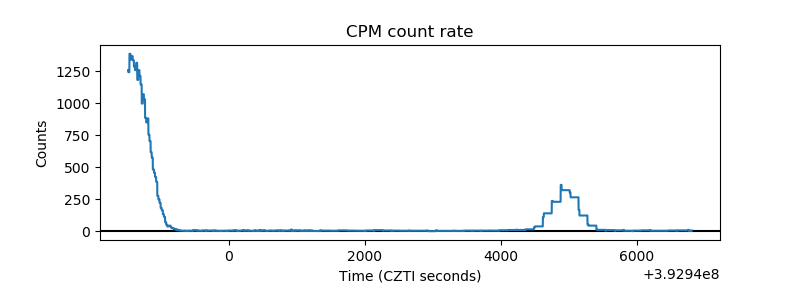 |
| CZT Counter | 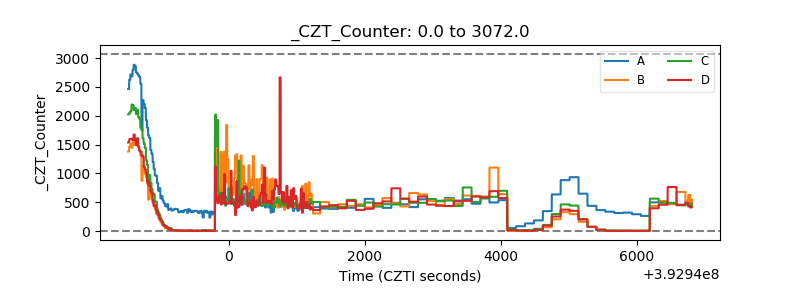 |
| +2.5 Volts monitor | 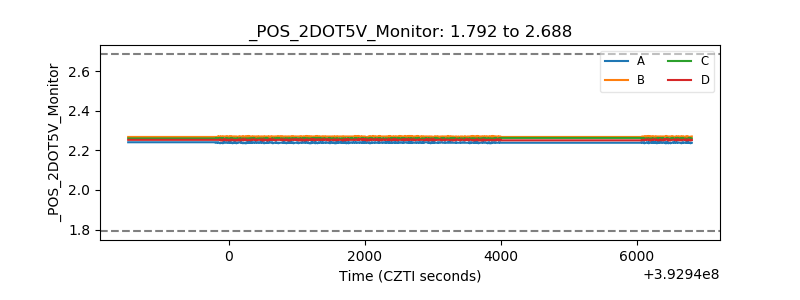 |
| +5 Volts monitor | 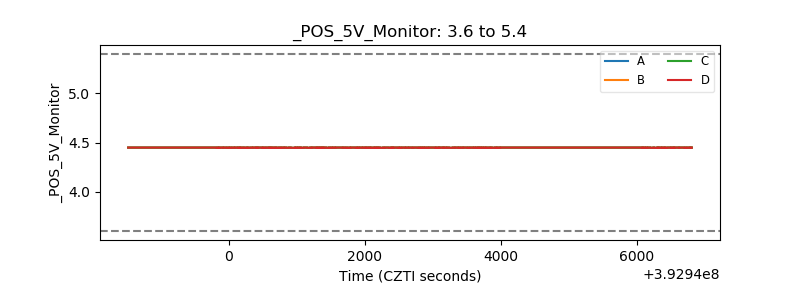 |
| _ROLL_ROT | 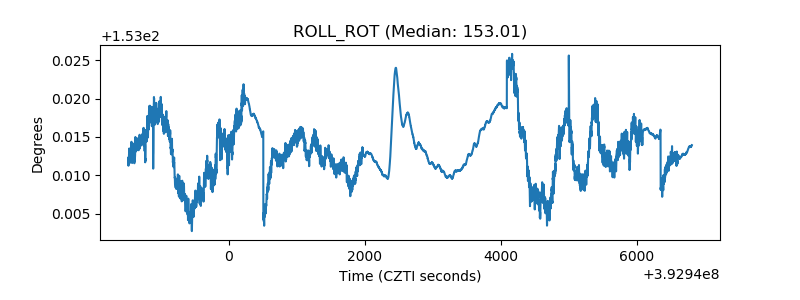 |
| _Roll_DEC | 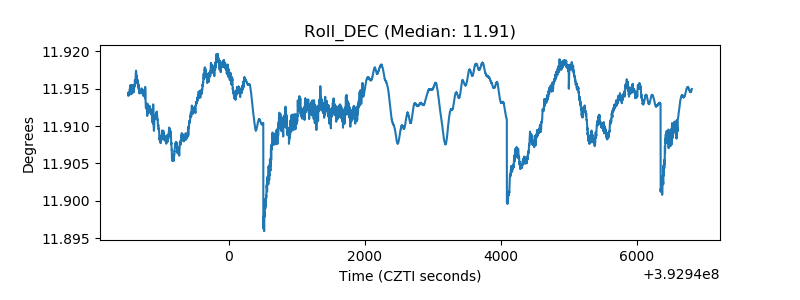 |
| _Roll_RA | 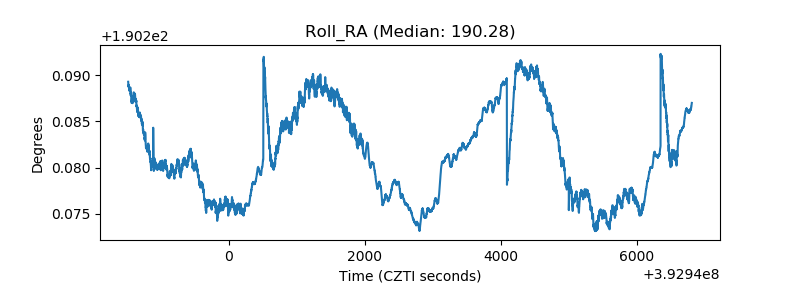 |
| Veto Counter | 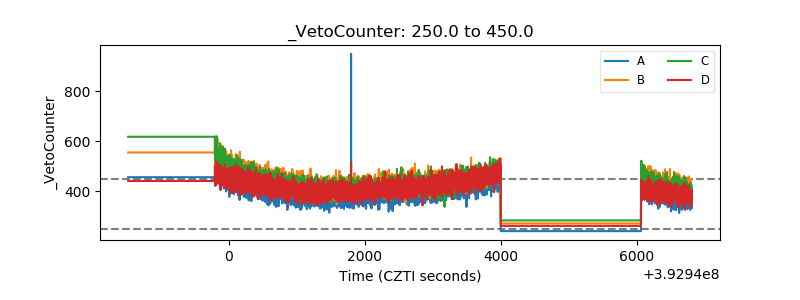 |