| Param | Original file | Final file |
|---|---|---|
| Filename | modeM0/AS1A10_071T33_9000005186_36290cztM0_level2.evt | modeM0/AS1A10_071T33_9000005186_36290cztM0_level2_quad_clean.evt |
| Size (bytes) | 504,371,520 | 61,983,360 |
| Size | 481.0 MB | 59.1 MB |
| Events in quadrant A | 2,602,842 | 403,798 |
| Events in quadrant B | 3,876,964 | 404,168 |
| Events in quadrant C | 3,295,191 | 388,663 |
| Events in quadrant D | 5,164,027 | 331,952 |
| Mode M0 | |||
|---|---|---|---|
| Quadrant | BADHDUFLAG | Total packets | Discarded packets |
| A | 0 | 10717 | 3 |
| B | 0 | 14793 | 2 |
| C | 0 | 12754 | 2 |
| D | 0 | 18875 | 2 |
| Mode SS | |||
|---|---|---|---|
| Quadrant | BADHDUFLAG | Total packets | Discarded packets |
| A | 0 | 100 | 0 |
| B | 0 | 100 | 0 |
| C | 0 | 100 | 0 |
| D | 0 | 100 | 0 |
| Mode M9 | |||
|---|---|---|---|
| Quadrant | BADHDUFLAG | Total packets | Discarded packets |
| A | 0 | 28 | 0 |
| B | 0 | 28 | 0 |
| C | 0 | 28 | 0 |
| D | 0 | 29 | 0 |
| Quadrant | Total seconds | Saturated seconds | Saturation percentage |
|---|---|---|---|
| A | 4963 | 8 | 0.161193% |
| B | 4963 | 245 | 4.936530% |
| C | 4963 | 93 | 1.873867% |
| D | 4963 | 716 | 14.426758% |
Noise dominated data is calculated using 1-second bins in cleaned event files. If a bin has >2000 counts, and if more than 50% of those come from <1% of pixels, then it is considered to be noise-dominated and hence unusable.
| Quadrant | # 1 sec bins | Bins with >0 counts | Bins with >2000 counts | High rate bins dominated by noise | Noise dominated (total time) | Noise dominated (detector-on time) | Marked lightcurve |
|---|---|---|---|---|---|---|---|
| A | 7087 | 4964 | 1 | 1 | 0.01% | 0.02% | 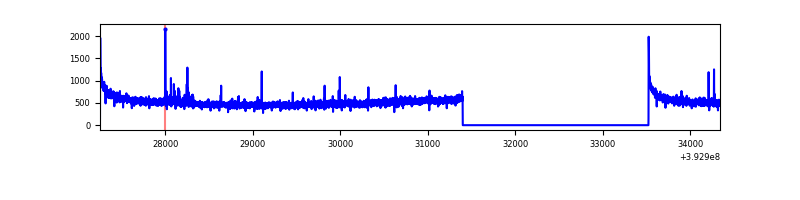 |
| B | 7087 | 4964 | 173 | 173 | 2.44% | 3.49% | 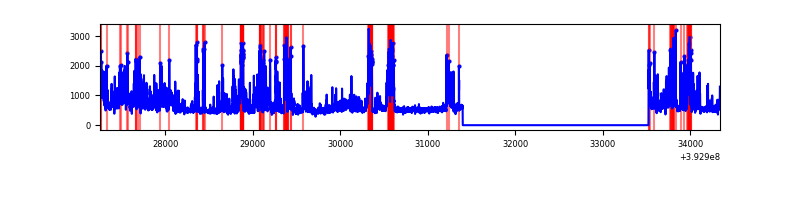 |
| C | 7087 | 4964 | 90 | 90 | 1.27% | 1.81% | 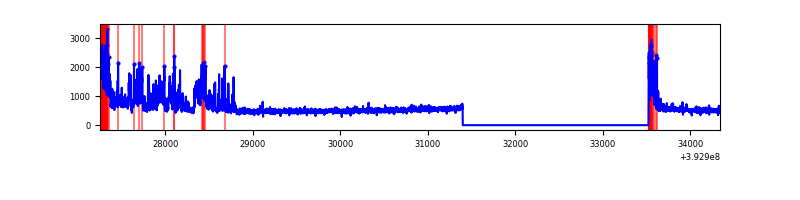 |
| D | 7087 | 4964 | 714 | 714 | 10.07% | 14.38% | 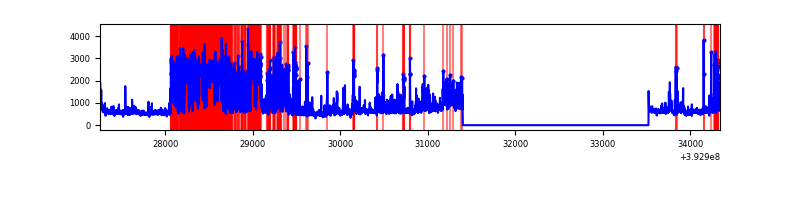 |
Top three noisy pixels from each quadrant. If the there are fewer than three noisy pixels in the level2.evt file, extra rows are filled as -1
| Pixel properties | Quadrant properties | ||||||
|---|---|---|---|---|---|---|---|
| Quadrant | DetID | PixID | Counts | Sigma | Mean | Median | Sigma |
| A | 10 | 83 | 176269 | 1434.68 | 612 | 603 | 122.4 |
| A | 15 | 223 | 30655 | 245.44 | 612 | 603 | 122.4 |
| A | 13 | 6 | 13507 | 105.39 | 612 | 603 | 122.4 |
| B | 4 | 171 | 424944 | 3701.62 | 604 | 588 | 114.6 |
| B | 5 | 236 | 399435 | 3479.11 | 604 | 588 | 114.6 |
| B | 0 | 155 | 239868 | 2087.22 | 604 | 588 | 114.6 |
| C | 0 | 207 | 493311 | 3574.94 | 593 | 599 | 137.8 |
| C | 0 | 10 | 276110 | 1999.01 | 593 | 599 | 137.8 |
| C | 15 | 214 | 209049 | 1512.44 | 593 | 599 | 137.8 |
| D | 12 | 6 | 1784180 | 13146.87 | 552 | 537 | 135.7 |
| D | 7 | 223 | 507598 | 3737.44 | 552 | 537 | 135.7 |
| D | 1 | 20 | 444179 | 3269.99 | 552 | 537 | 135.7 |
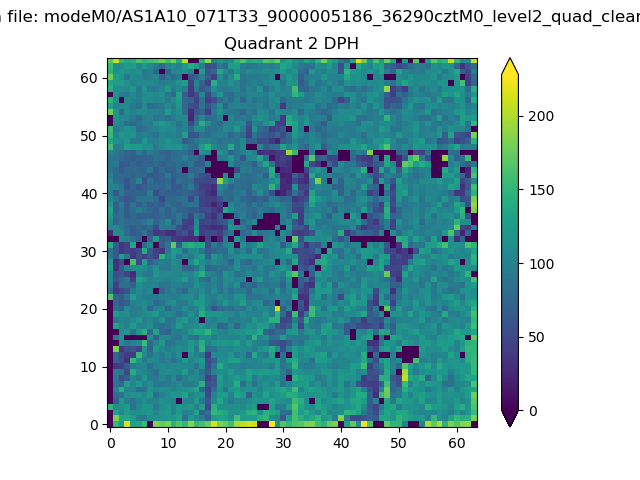
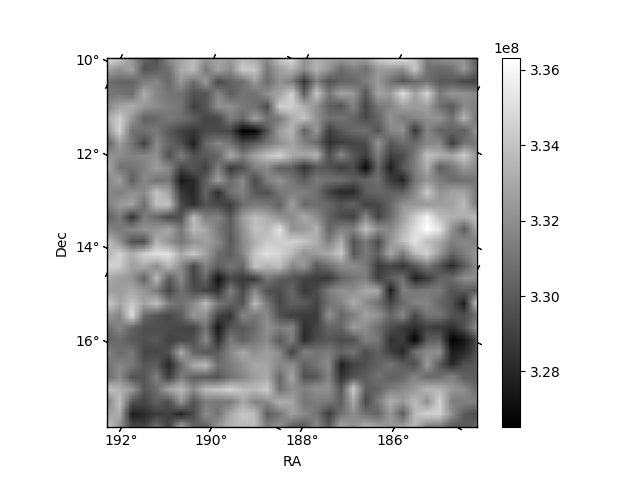
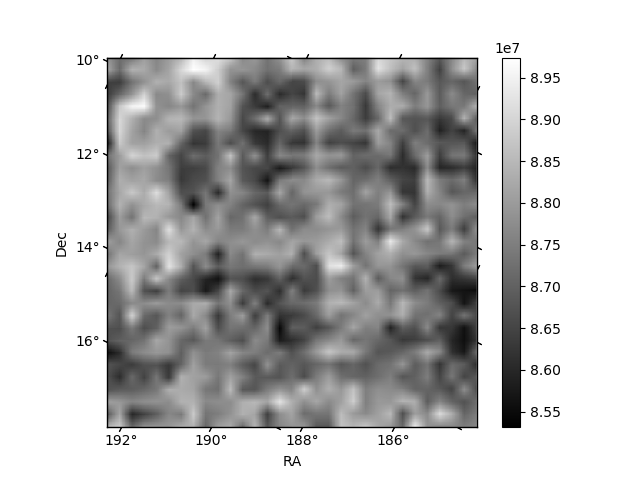
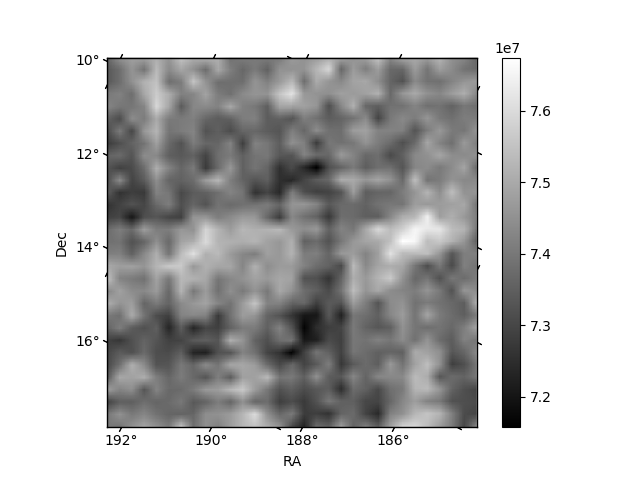
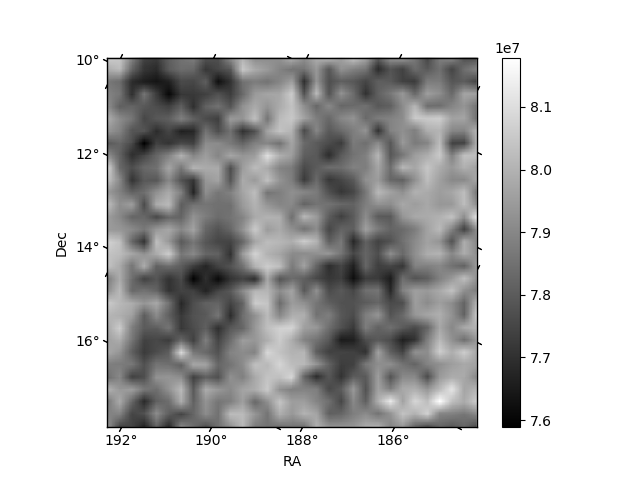
Histogram calculated using DETX and DETY for each event in the final _common_clean file
| Quadrant A | 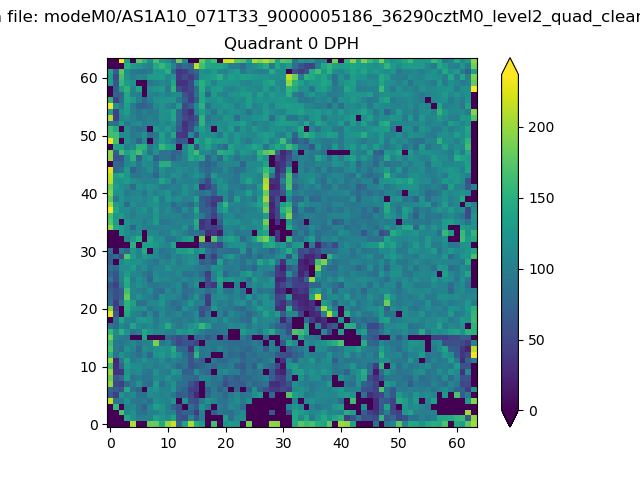 |
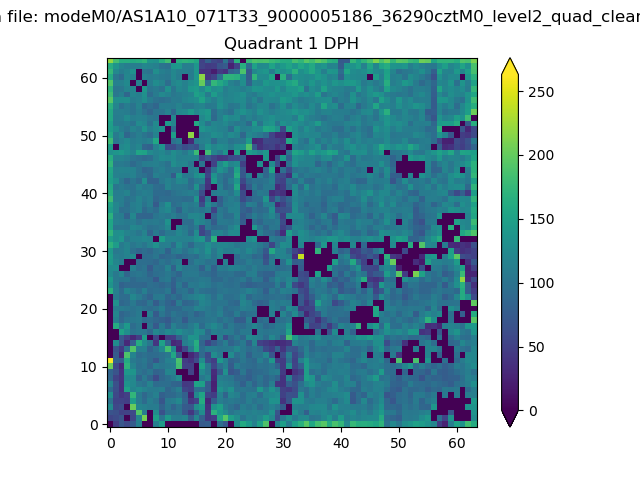 |
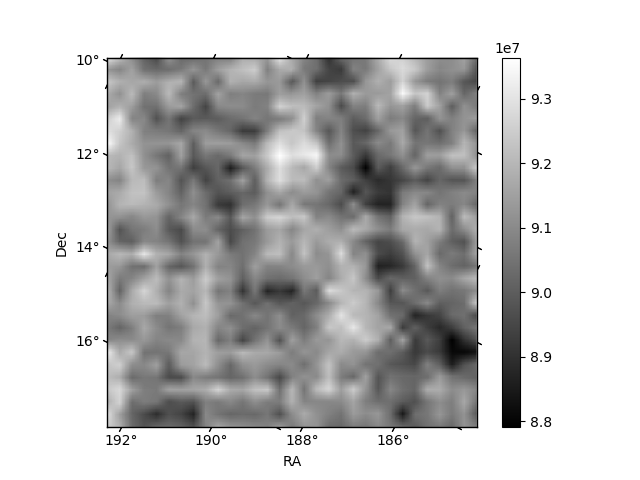
Quadrant B |
|---|---|---|---|
| Quadrant D | 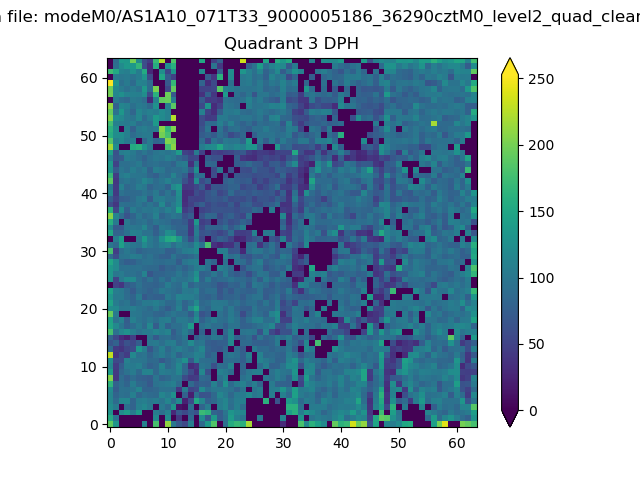 |
 |
Quadrant C |
| Plot type | Count rate plots | Images |
|---|---|---|
| Comparison with Poisson distribution Blue bars denote a histogram of data divided into 1 sec bins. Red curve is a Poisson curve with rate = median count rate of data. |
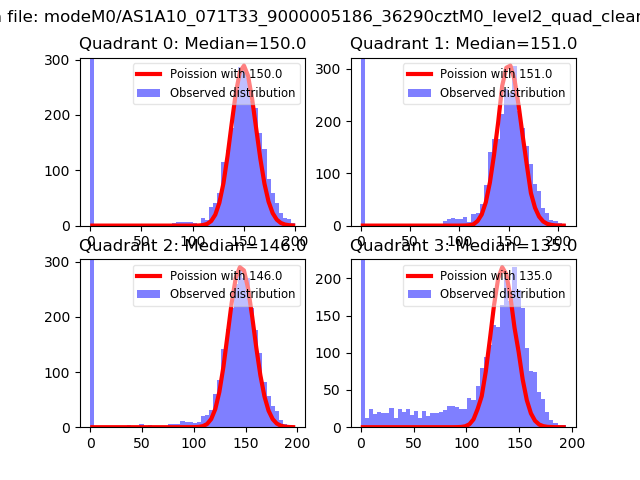 |
 |
| Quadrant-wise count rates Data is divided into 100 sec bins |
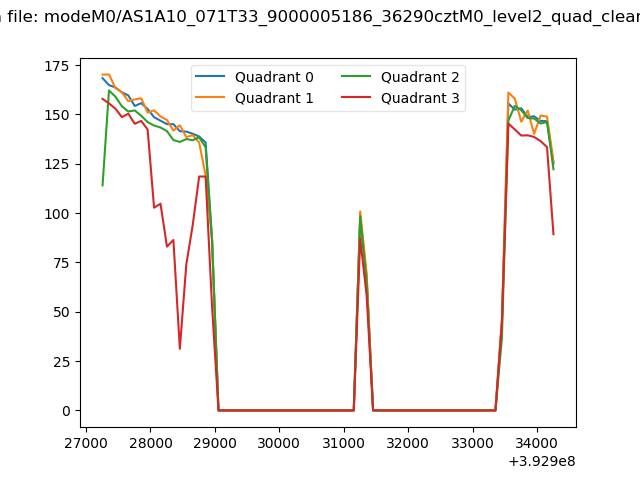 |
|
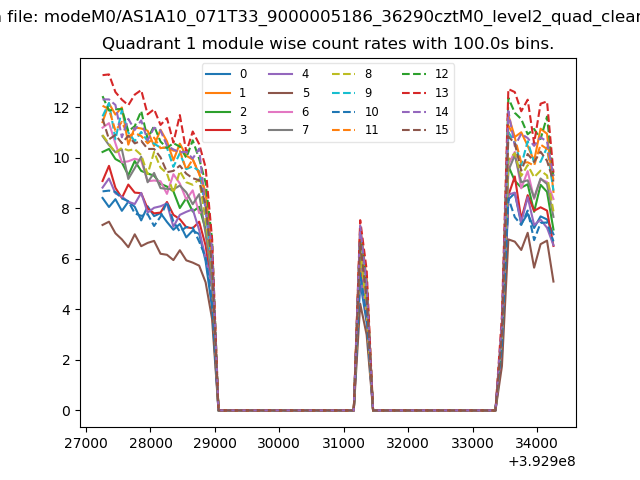
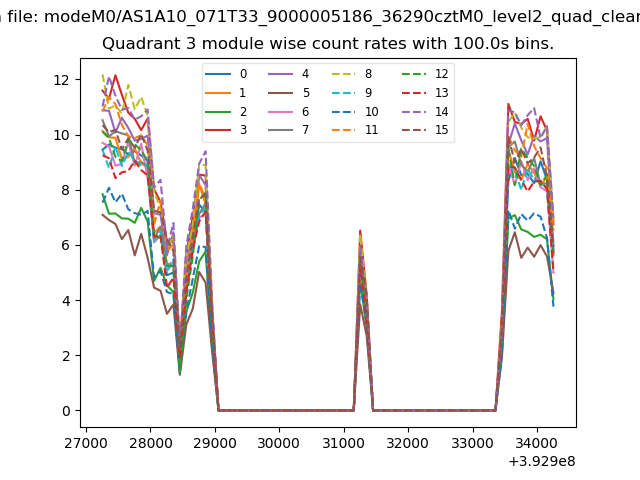
| Module-wise count rates for Quadrant A Data is divided into 100 sec bins |
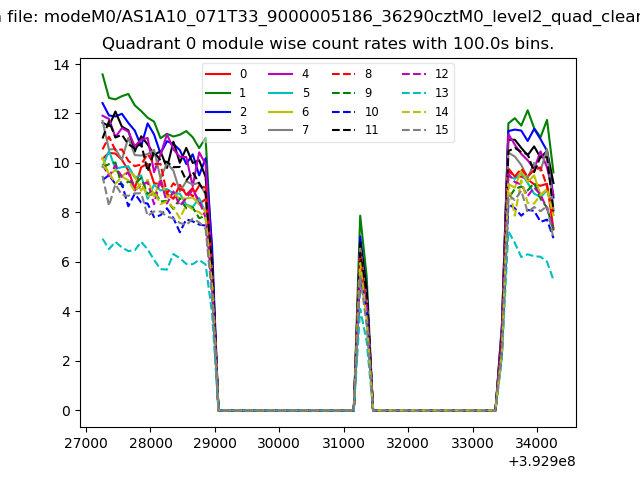 |
 |
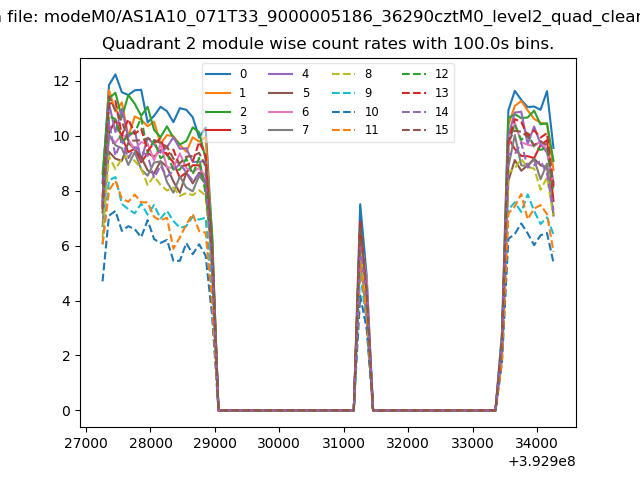
| Module-wise count rates for Quadrant B Data is divided into 100 sec bins |
 |
 |
| Module-wise count rates for Quadrant C Data is divided into 100 sec bins |
 |
 |
| Module-wise count rates for Quadrant D Data is divided into 100 sec bins |
 |
 |
| Parameter | Plot |
|---|---|
| CZT HV Monitor | 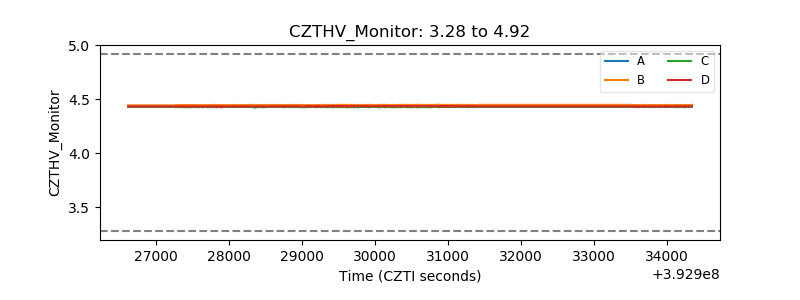 |
| D_VDD | 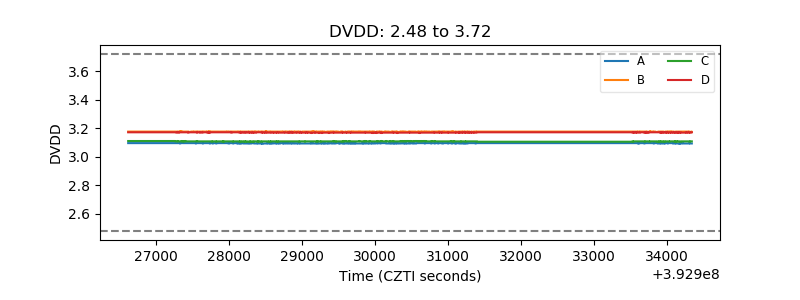 |
| Temperature 1 | 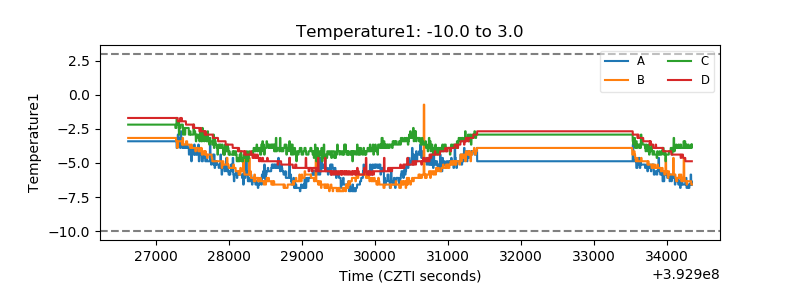 |
| Veto HV Monitor | 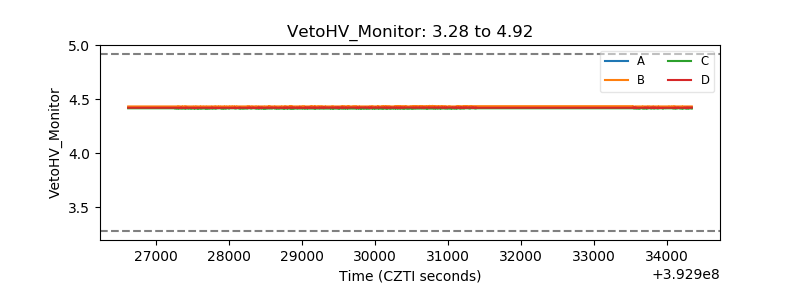 |
| Veto LLD | 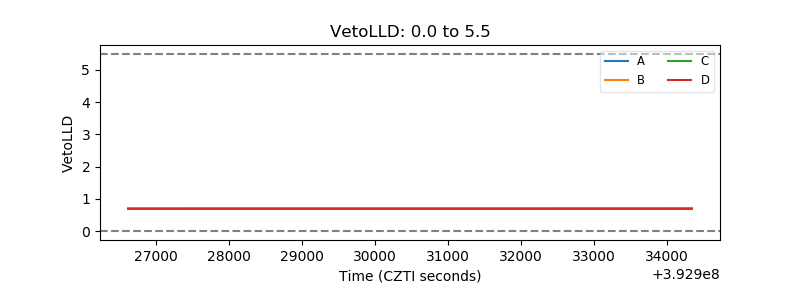 |
| Alpha Counter | 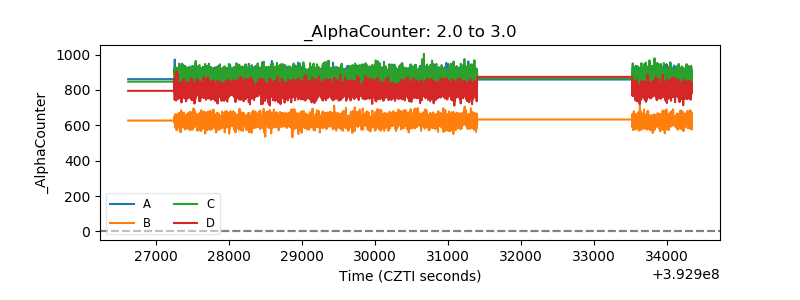 |
| _CPM_Rate | 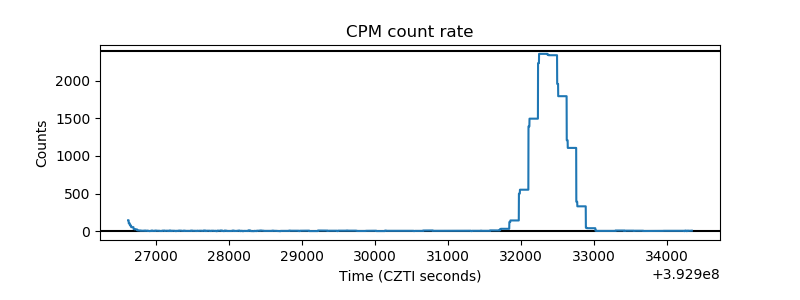 |
| CZT Counter | 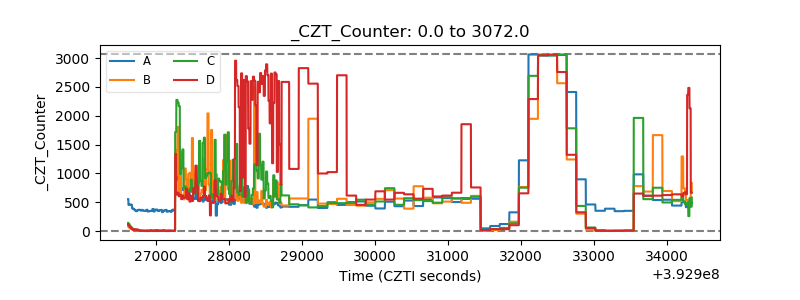 |
| +2.5 Volts monitor | 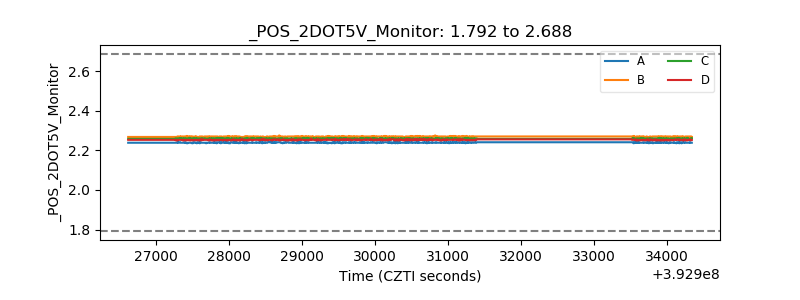 |
| +5 Volts monitor |  |
| _ROLL_ROT | 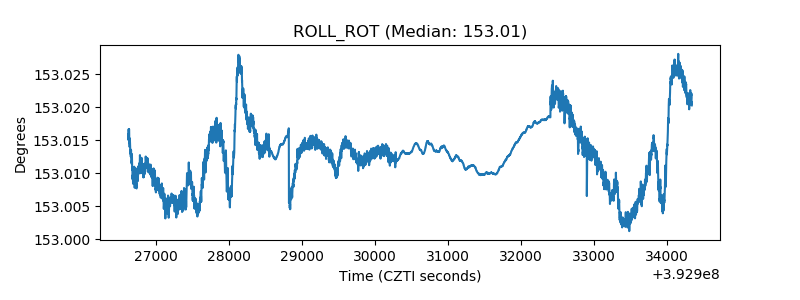 |
| _Roll_DEC | 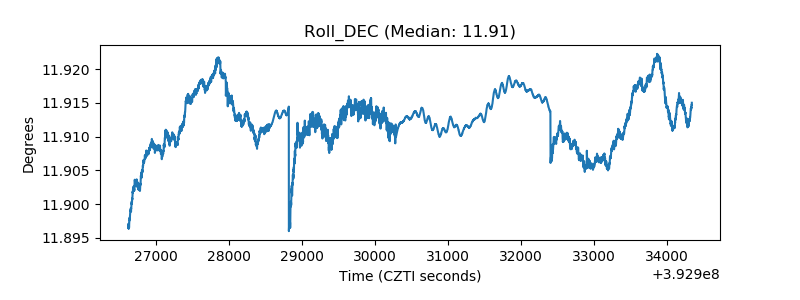 |
| _Roll_RA | 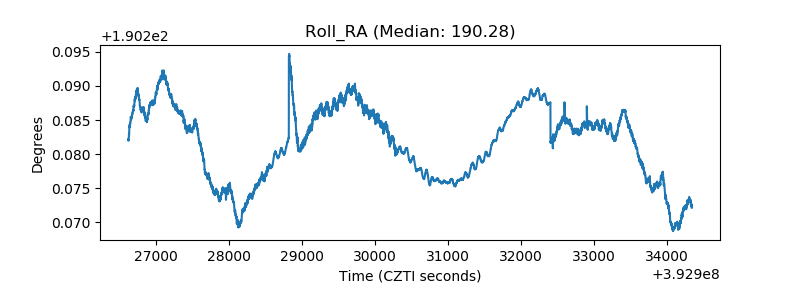 |
| Veto Counter | 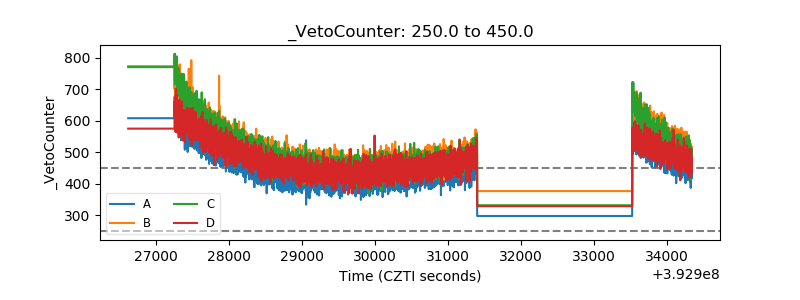 |