| Param | Original file | Final file |
|---|---|---|
| Filename | modeM0/AS1A10_071T33_9000005186_36287cztM0_level2.evt | modeM0/AS1A10_071T33_9000005186_36287cztM0_level2_quad_clean.evt |
| Size (bytes) | 488,128,320 | 78,405,120 |
| Size | 465.5 MB | 74.8 MB |
| Events in quadrant A | 2,846,210 | 520,736 |
| Events in quadrant B | 4,885,169 | 479,566 |
| Events in quadrant C | 2,900,983 | 511,920 |
| Events in quadrant D | 3,788,198 | 487,632 |
| Mode M0 | |||
|---|---|---|---|
| Quadrant | BADHDUFLAG | Total packets | Discarded packets |
| A | 0 | 11940 | 3 |
| B | 0 | 18085 | 2 |
| C | 0 | 11863 | 2 |
| D | 0 | 14815 | 2 |
| Mode SS | |||
|---|---|---|---|
| Quadrant | BADHDUFLAG | Total packets | Discarded packets |
| A | 0 | 110 | 0 |
| B | 0 | 110 | 0 |
| C | 0 | 110 | 0 |
| D | 0 | 110 | 0 |
| Mode M9 | |||
|---|---|---|---|
| Quadrant | BADHDUFLAG | Total packets | Discarded packets |
| A | 0 | 21 | 0 |
| B | 0 | 21 | 0 |
| C | 0 | 21 | 0 |
| D | 0 | 22 | 0 |
| Quadrant | Total seconds | Saturated seconds | Saturation percentage |
|---|---|---|---|
| A | 5337 | 62 | 1.161701% |
| B | 5337 | 758 | 14.202736% |
| C | 5337 | 68 | 1.274124% |
| D | 5337 | 276 | 5.171445% |
Noise dominated data is calculated using 1-second bins in cleaned event files. If a bin has >2000 counts, and if more than 50% of those come from <1% of pixels, then it is considered to be noise-dominated and hence unusable.
| Quadrant | # 1 sec bins | Bins with >0 counts | Bins with >2000 counts | High rate bins dominated by noise | Noise dominated (total time) | Noise dominated (detector-on time) | Marked lightcurve |
|---|---|---|---|---|---|---|---|
| A | 7129 | 5338 | 48 | 48 | 0.67% | 0.90% | 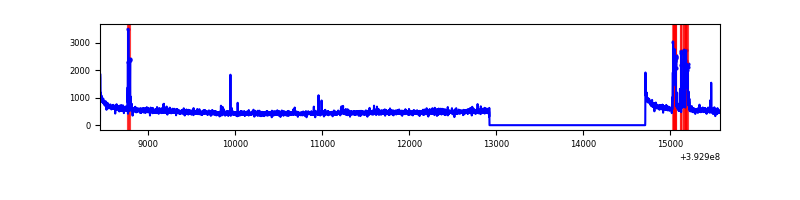 |
| B | 7129 | 5338 | 538 | 538 | 7.55% | 10.08% | 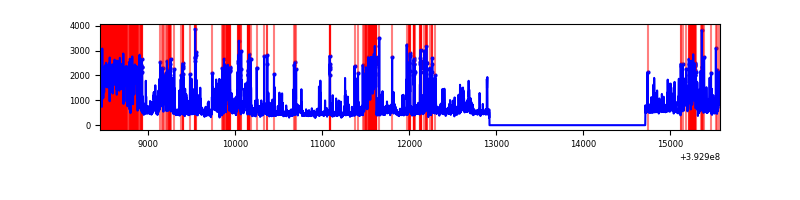 |
| C | 7129 | 5338 | 53 | 53 | 0.74% | 0.99% | 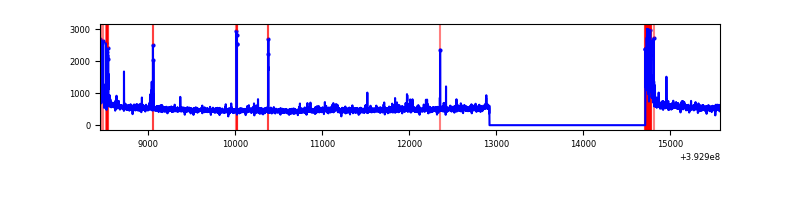 |
| D | 7129 | 5338 | 270 | 270 | 3.79% | 5.06% | 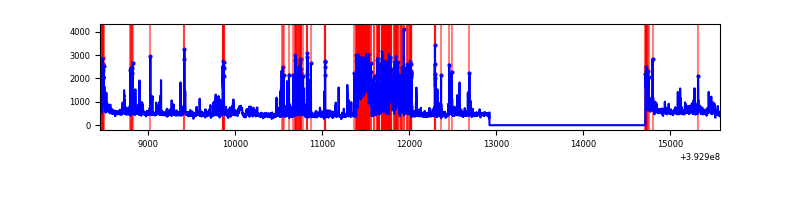 |
Top three noisy pixels from each quadrant. If the there are fewer than three noisy pixels in the level2.evt file, extra rows are filled as -1
| Pixel properties | Quadrant properties | ||||||
|---|---|---|---|---|---|---|---|
| Quadrant | DetID | PixID | Counts | Sigma | Mean | Median | Sigma |
| A | 9 | 143 | 188143 | 1482.4 | 632 | 621 | 126.5 |
| A | 10 | 83 | 185129 | 1458.57 | 632 | 621 | 126.5 |
| A | 13 | 6 | 19000 | 145.29 | 632 | 621 | 126.5 |
| B | 4 | 171 | 1547893 | 13615.55 | 585 | 569 | 113.6 |
| B | 5 | 172 | 423714 | 3723.43 | 585 | 569 | 113.6 |
| B | 8 | 128 | 229497 | 2014.43 | 585 | 569 | 113.6 |
| C | 15 | 214 | 223690 | 1558.96 | 614 | 621 | 143.1 |
| C | 0 | 10 | 206918 | 1441.75 | 614 | 621 | 143.1 |
| C | 0 | 207 | 56167 | 388.19 | 614 | 621 | 143.1 |
| D | 13 | 171 | 534922 | 3576.45 | 608 | 590 | 149.4 |
| D | 12 | 6 | 499589 | 3339.95 | 608 | 590 | 149.4 |
| D | 13 | 249 | 108294 | 720.9 | 608 | 590 | 149.4 |
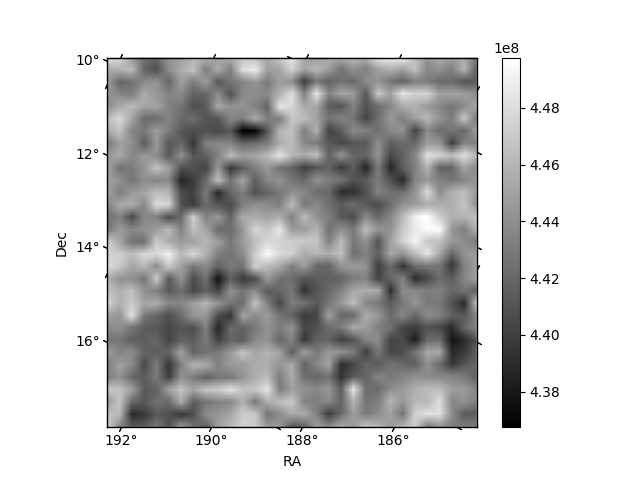
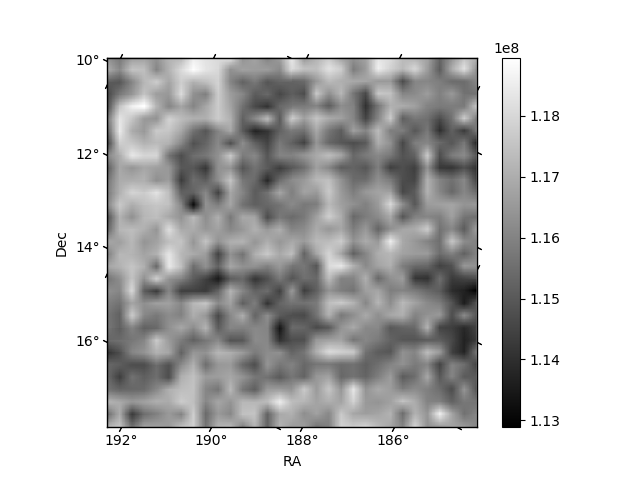
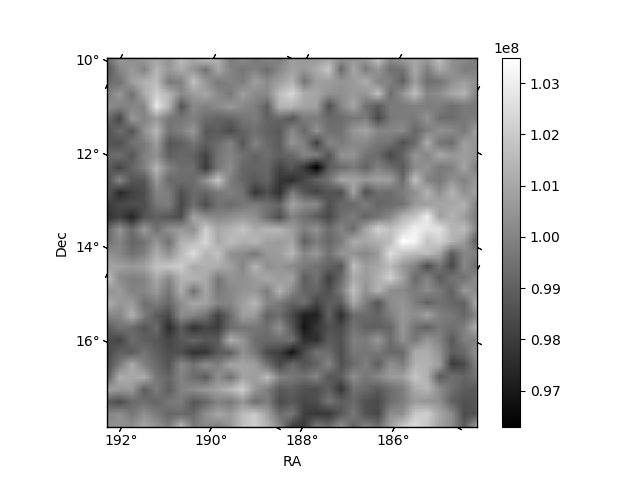
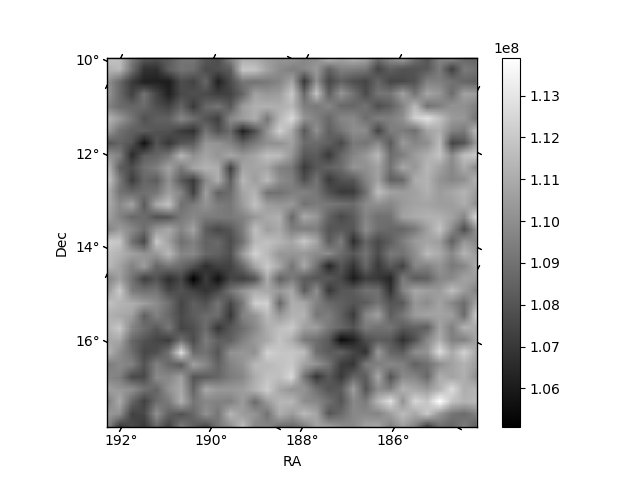
Histogram calculated using DETX and DETY for each event in the final _common_clean file
| Quadrant A | 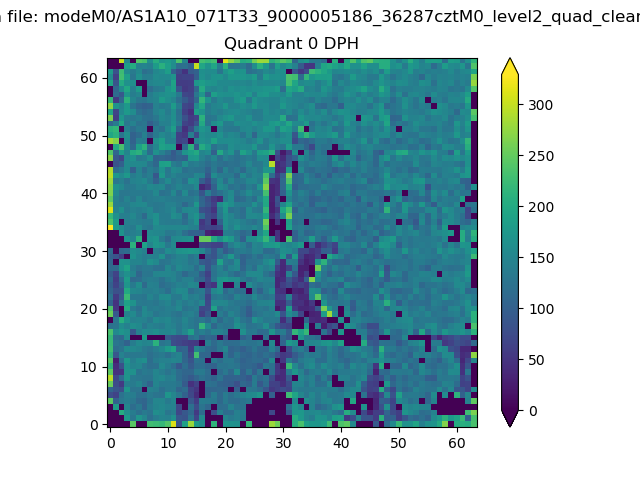 |
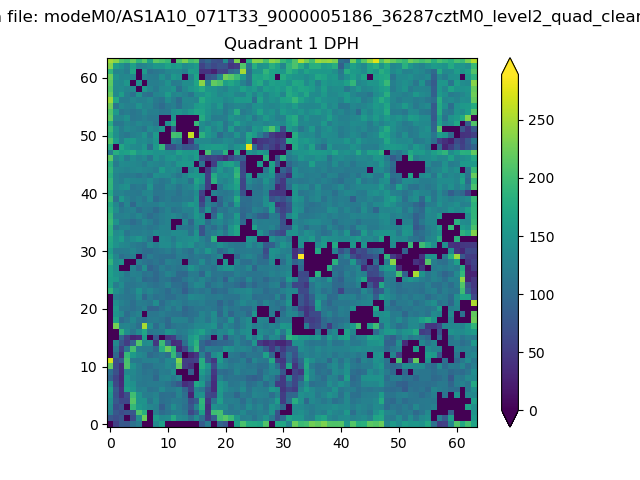 |
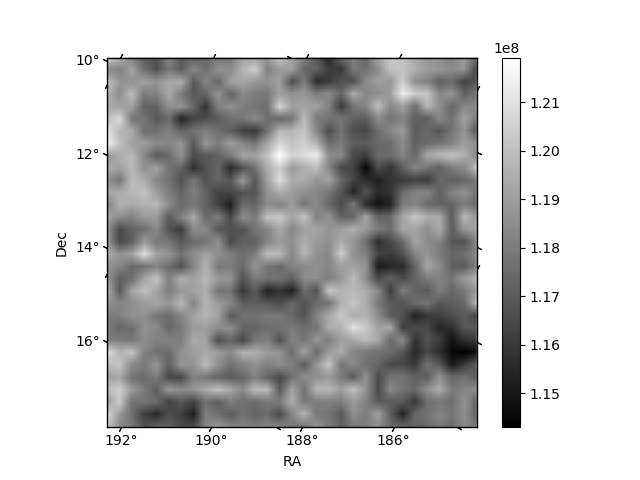
Quadrant B |
|---|---|---|---|
| Quadrant D | 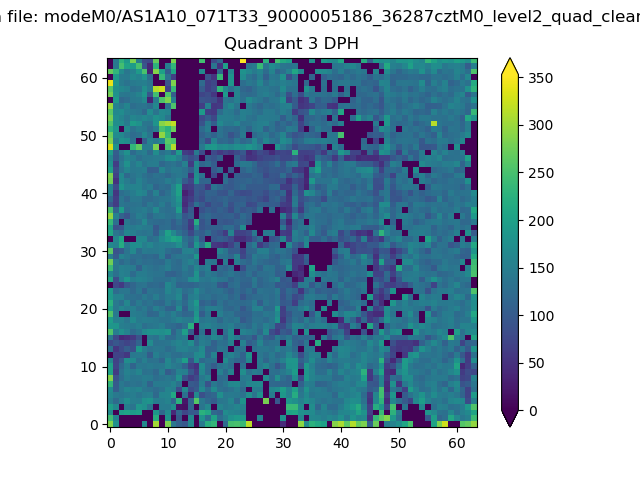 |
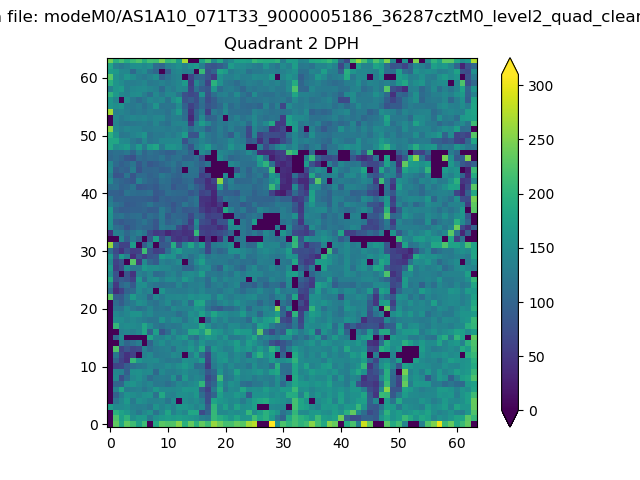 |
Quadrant C |
| Plot type | Count rate plots | Images |
|---|---|---|
| Comparison with Poisson distribution Blue bars denote a histogram of data divided into 1 sec bins. Red curve is a Poisson curve with rate = median count rate of data. |
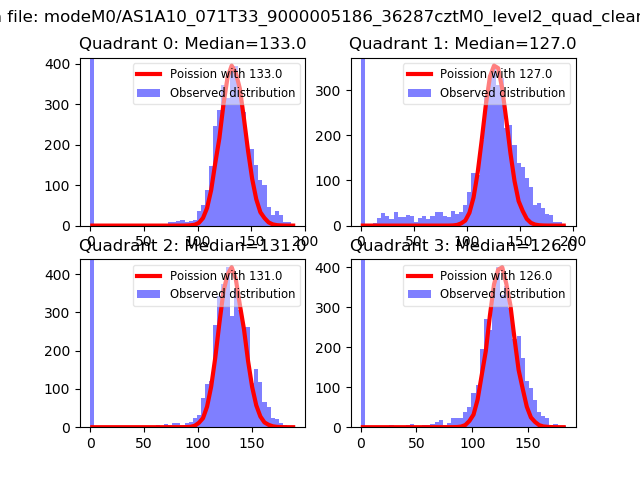 |
 |
| Quadrant-wise count rates Data is divided into 100 sec bins |
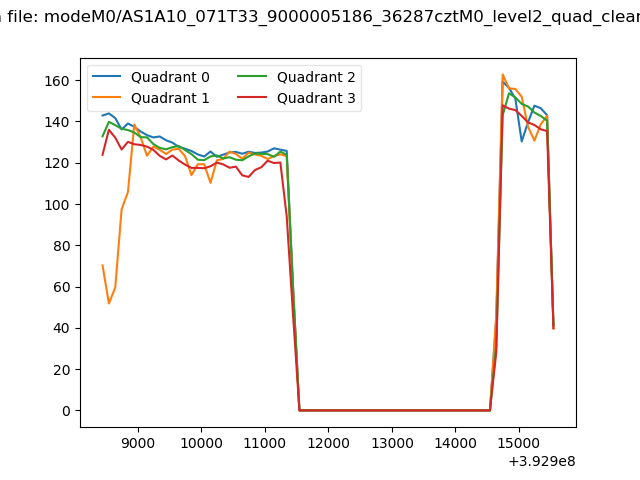 |
|
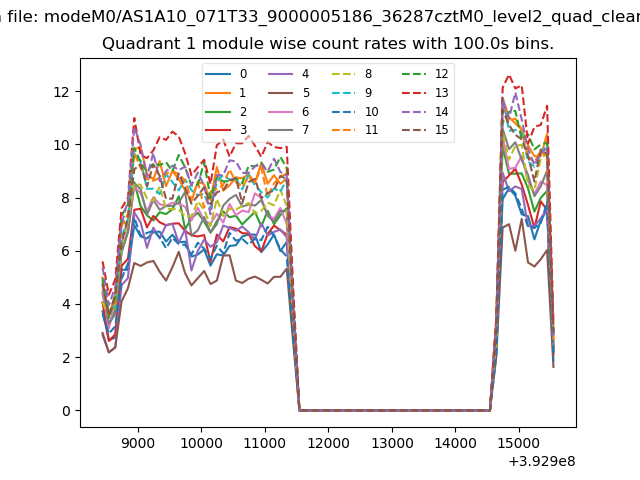
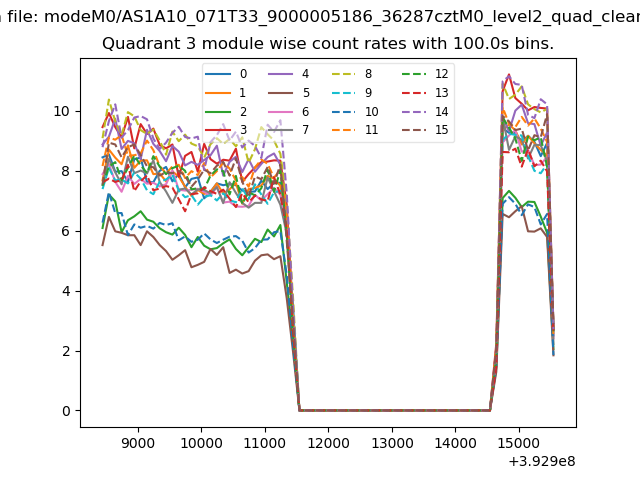
| Module-wise count rates for Quadrant A Data is divided into 100 sec bins |
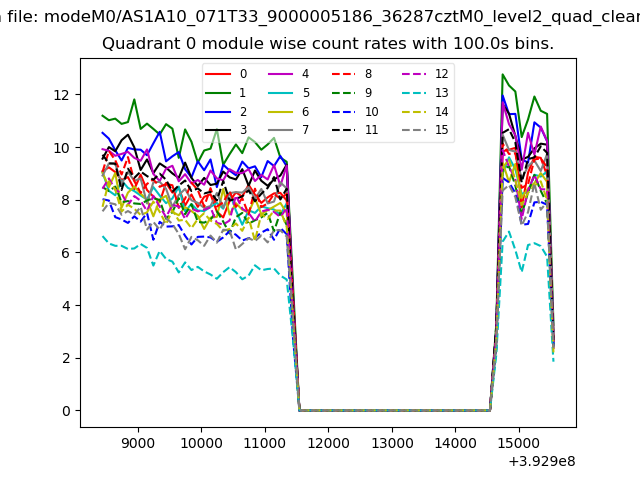 |
 |
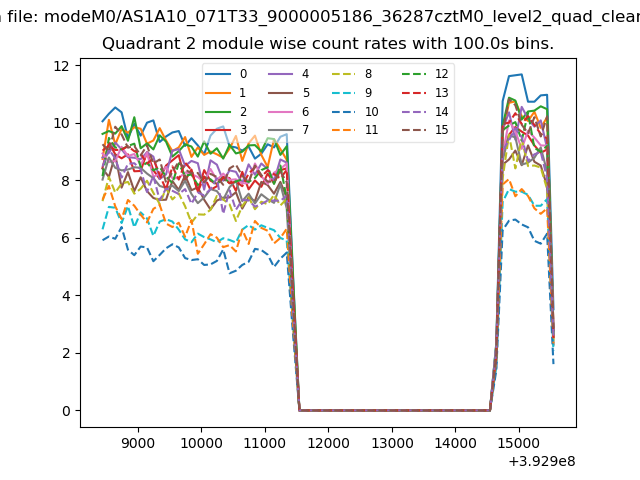
| Module-wise count rates for Quadrant B Data is divided into 100 sec bins |
 |
 |
| Module-wise count rates for Quadrant C Data is divided into 100 sec bins |
 |
 |
| Module-wise count rates for Quadrant D Data is divided into 100 sec bins |
 |
 |
| Parameter | Plot |
|---|---|
| CZT HV Monitor | 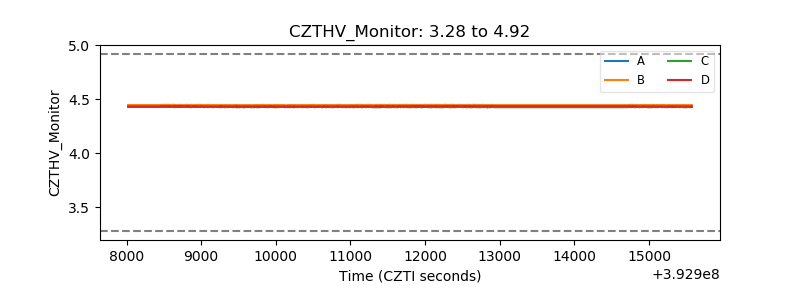 |
| D_VDD | 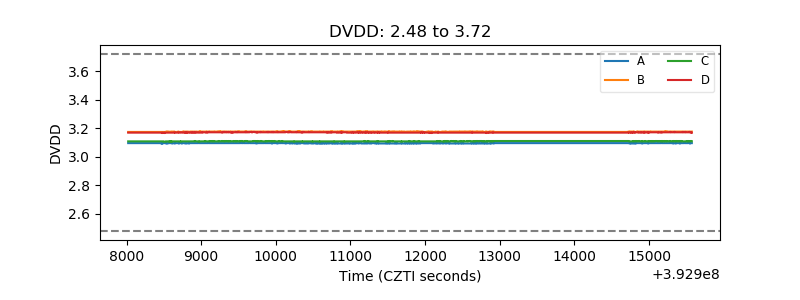 |
| Temperature 1 | 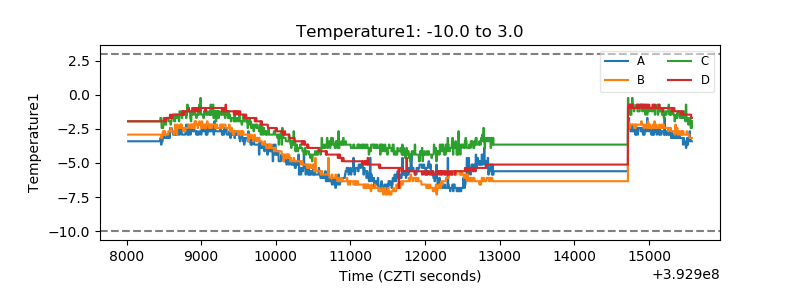 |
| Veto HV Monitor |  |
| Veto LLD | 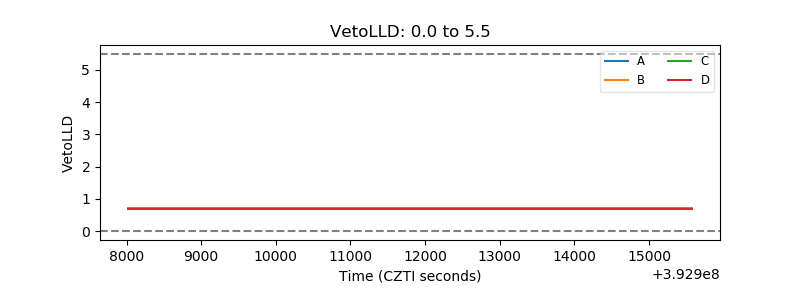 |
| Alpha Counter | 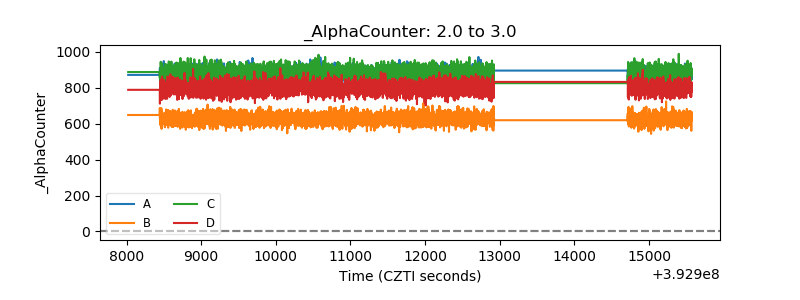 |
| _CPM_Rate | 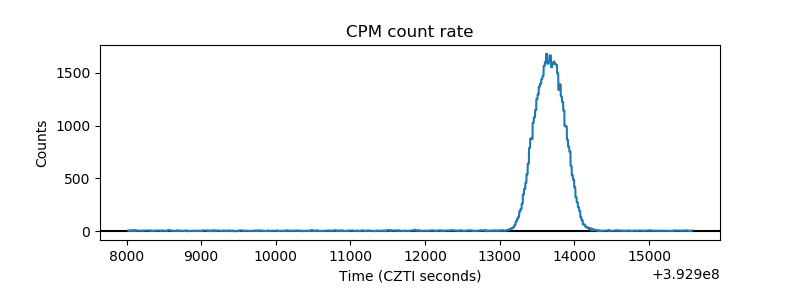 |
| CZT Counter | 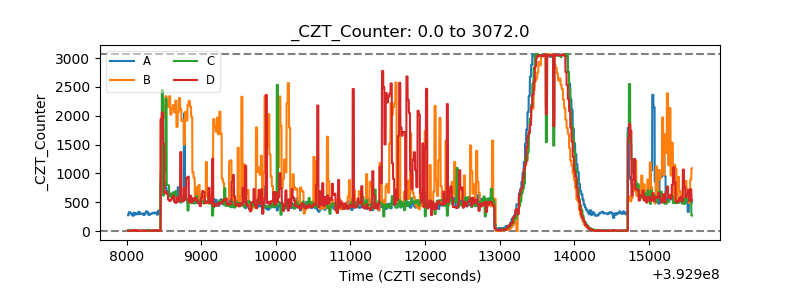 |
| +2.5 Volts monitor | 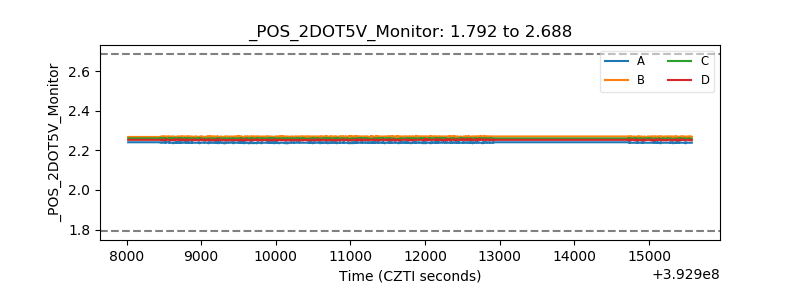 |
| +5 Volts monitor | 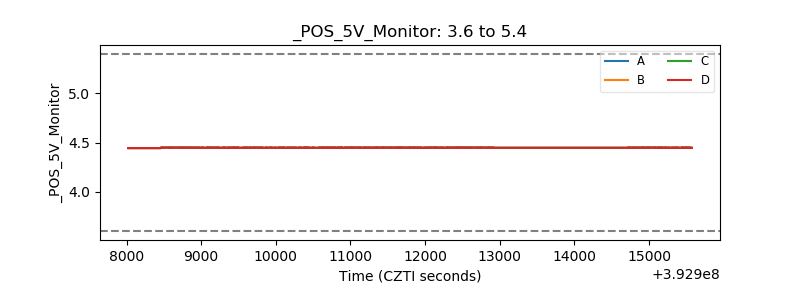 |
| _ROLL_ROT | 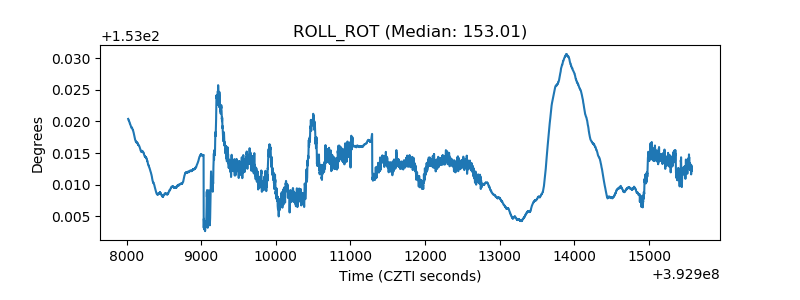 |
| _Roll_DEC | 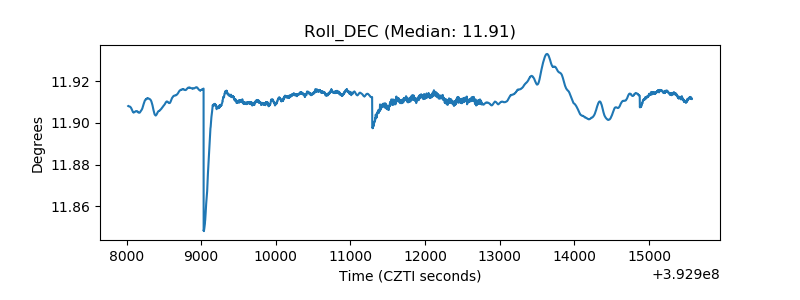 |
| _Roll_RA | 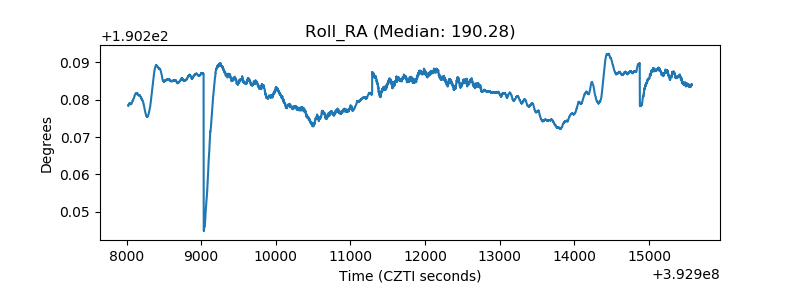 |
| Veto Counter | 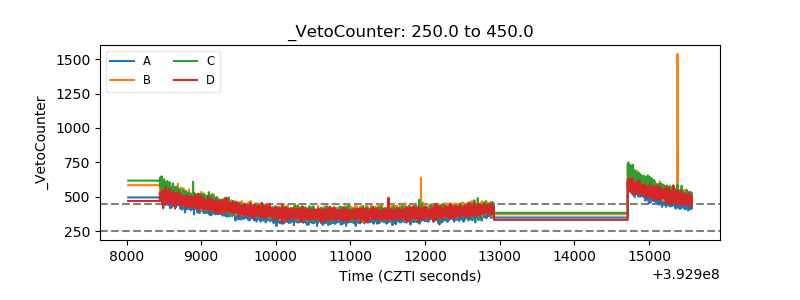 |