| Param | Original file | Final file |
|---|---|---|
| Filename | modeM0/AS1A10_071T35_9000005184_36285cztM0_level2.evt | modeM0/AS1A10_071T35_9000005184_36285cztM0_level2_quad_clean.evt |
| Size (bytes) | 207,884,160 | 45,558,720 |
| Size | 198.3 MB | 43.4 MB |
| Events in quadrant A | 1,209,506 | 309,217 |
| Events in quadrant B | 1,806,630 | 304,457 |
| Events in quadrant C | 1,719,694 | 295,475 |
| Events in quadrant D | 1,389,476 | 291,763 |
| Mode M0 | |||
|---|---|---|---|
| Quadrant | BADHDUFLAG | Total packets | Discarded packets |
| A | 0 | 5232 | 1 |
| B | 0 | 6931 | 1 |
| C | 0 | 6727 | 1 |
| D | 0 | 5742 | 1 |
| Mode SS | |||
|---|---|---|---|
| Quadrant | BADHDUFLAG | Total packets | Discarded packets |
| A | 0 | 50 | 0 |
| B | 0 | 50 | 0 |
| C | 0 | 50 | 0 |
| D | 0 | 50 | 0 |
| Mode M9 | |||
|---|---|---|---|
| Quadrant | BADHDUFLAG | Total packets | Discarded packets |
| A | 0 | 2 | 0 |
| B | 0 | 2 | 0 |
| C | 0 | 2 | 0 |
| D | 0 | 3 | 0 |
| Quadrant | Total seconds | Saturated seconds | Saturation percentage |
|---|---|---|---|
| A | 2482 | 2 | 0.080580% |
| B | 2482 | 123 | 4.955681% |
| C | 2482 | 98 | 3.948429% |
| D | 2482 | 32 | 1.289283% |
Noise dominated data is calculated using 1-second bins in cleaned event files. If a bin has >2000 counts, and if more than 50% of those come from <1% of pixels, then it is considered to be noise-dominated and hence unusable.
| Quadrant | # 1 sec bins | Bins with >0 counts | Bins with >2000 counts | High rate bins dominated by noise | Noise dominated (total time) | Noise dominated (detector-on time) | Marked lightcurve |
|---|---|---|---|---|---|---|---|
| A | 2482 | 2482 | 0 | 0 | 0.00% | 0.00% | 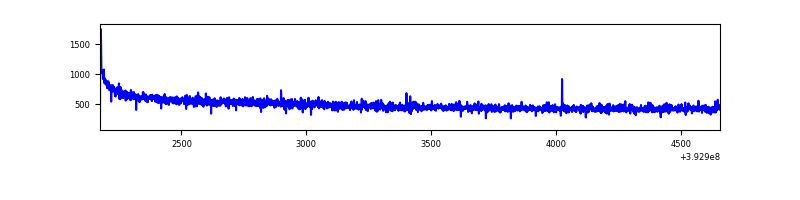 |
| B | 2482 | 2482 | 84 | 84 | 3.38% | 3.38% | 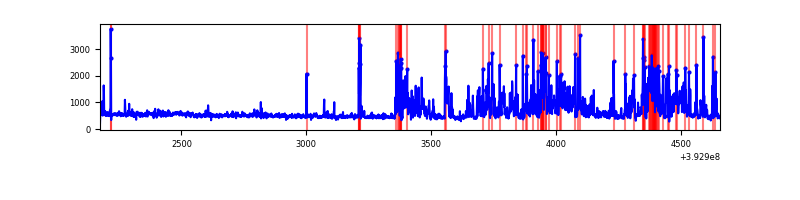 |
| C | 2482 | 2482 | 81 | 81 | 3.26% | 3.26% | 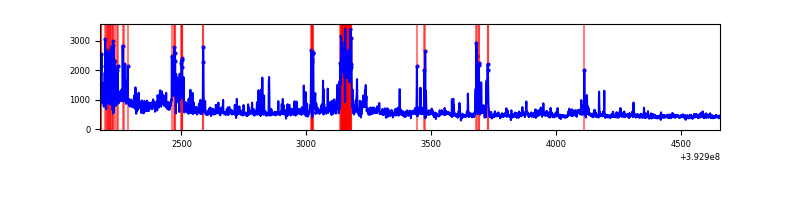 |
| D | 2482 | 2482 | 17 | 17 | 0.68% | 0.68% | 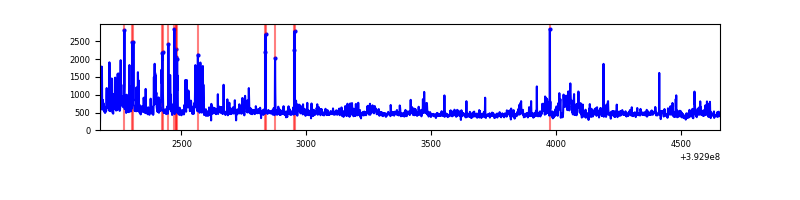 |
Top three noisy pixels from each quadrant. If the there are fewer than three noisy pixels in the level2.evt file, extra rows are filled as -1
| Pixel properties | Quadrant properties | ||||||
|---|---|---|---|---|---|---|---|
| Quadrant | DetID | PixID | Counts | Sigma | Mean | Median | Sigma |
| A | 10 | 83 | 89028 | 1460.89 | 288 | 283 | 60.7 |
| A | 13 | 254 | 4169 | 63.97 | 288 | 283 | 60.7 |
| A | 13 | 6 | 3416 | 51.57 | 288 | 283 | 60.7 |
| B | 4 | 171 | 375658 | 6729.01 | 278 | 271 | 55.8 |
| B | 5 | 172 | 171635 | 3071.79 | 278 | 271 | 55.8 |
| B | 5 | 255 | 109746 | 1962.4 | 278 | 271 | 55.8 |
| C | 0 | 207 | 289145 | 4458.0 | 274 | 275 | 64.8 |
| C | 0 | 10 | 255718 | 3942.14 | 274 | 275 | 64.8 |
| C | 15 | 214 | 104582 | 1609.72 | 274 | 275 | 64.8 |
| D | 12 | 6 | 115568 | 1638.81 | 282 | 274 | 70.4 |
| D | 7 | 223 | 70469 | 997.76 | 282 | 274 | 70.4 |
| D | 13 | 171 | 29828 | 420.09 | 282 | 274 | 70.4 |
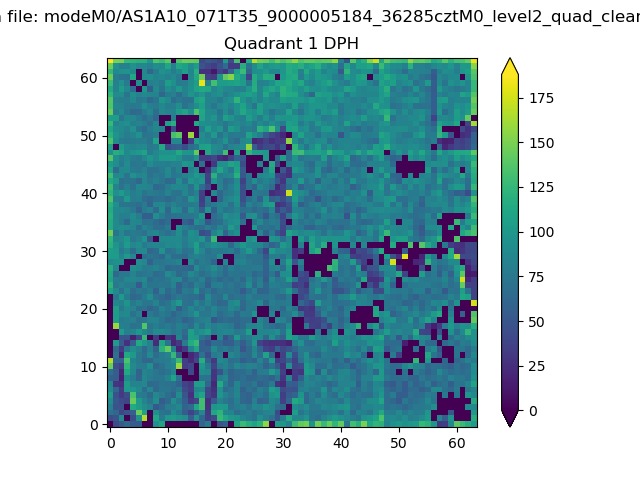
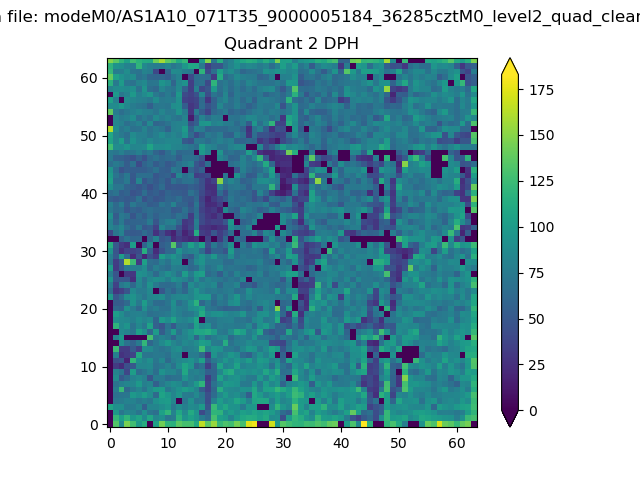
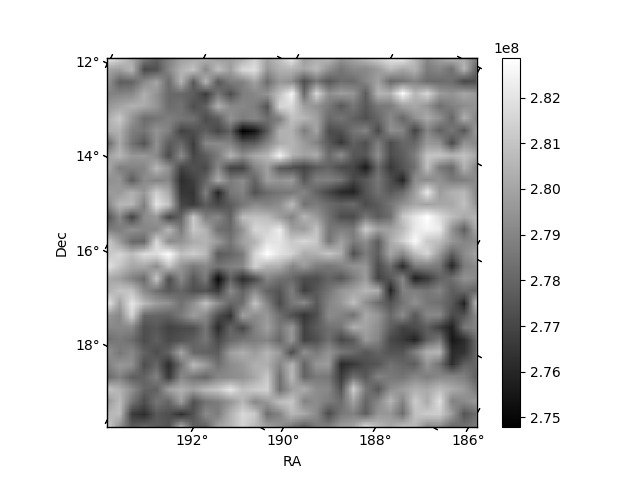
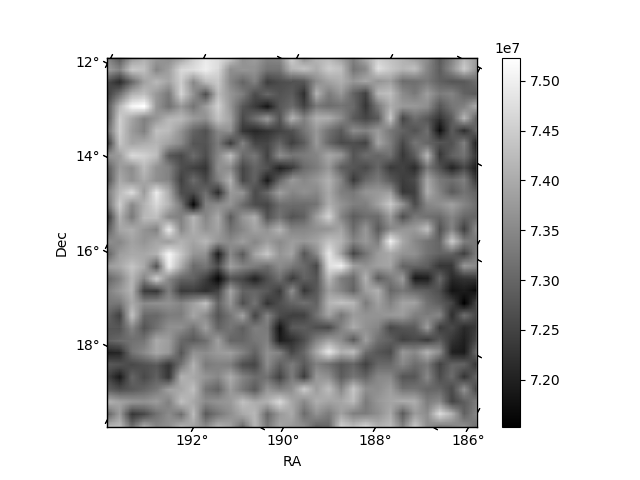
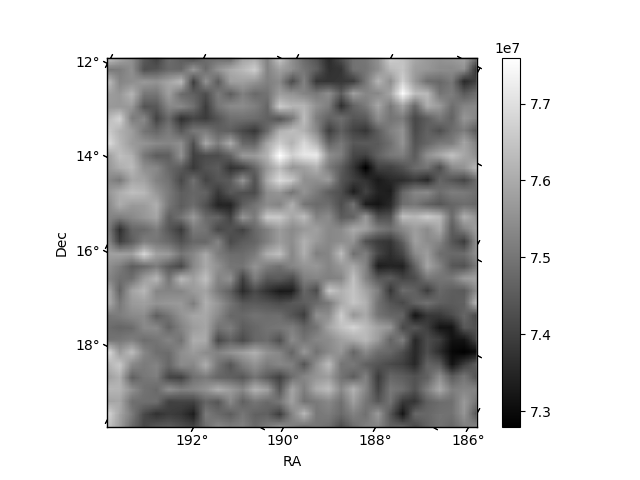
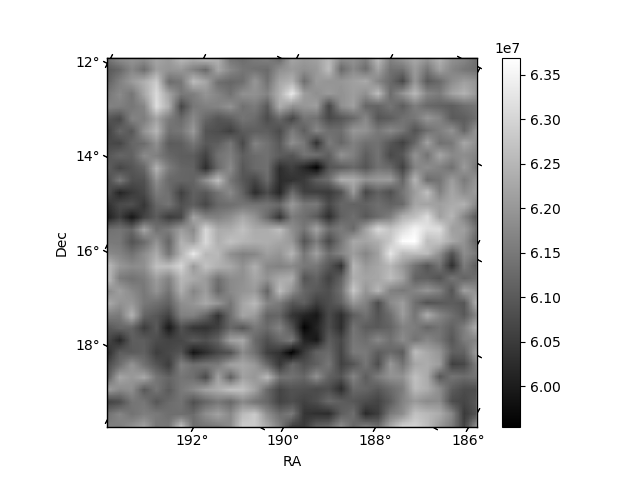
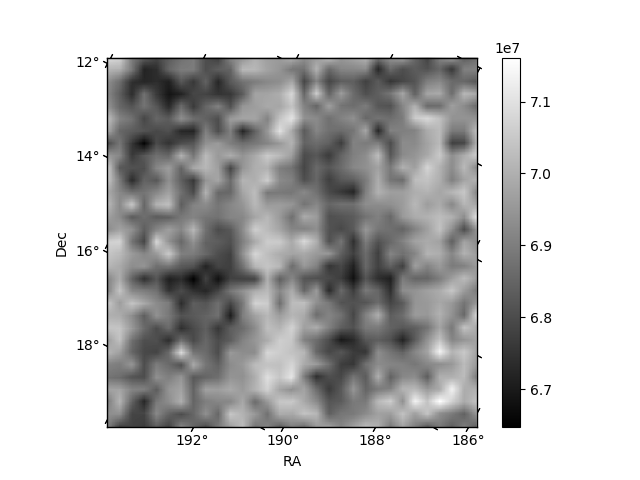
Histogram calculated using DETX and DETY for each event in the final _common_clean file
| Quadrant A |  |
 |
Quadrant B |
|---|---|---|---|
| Quadrant D | 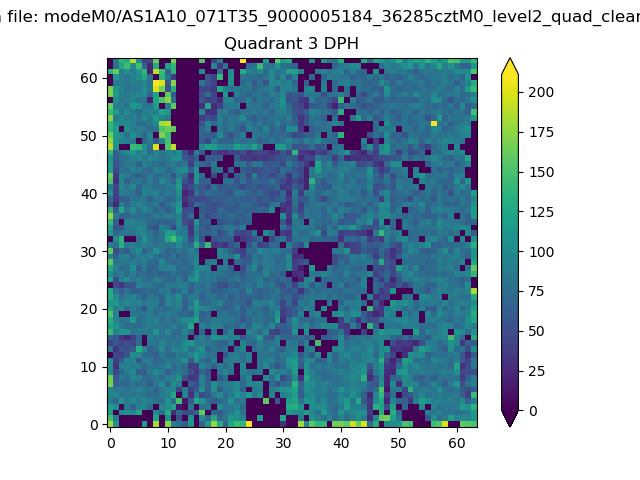 |
 |
Quadrant C |
| Plot type | Count rate plots | Images |
|---|---|---|
| Comparison with Poisson distribution Blue bars denote a histogram of data divided into 1 sec bins. Red curve is a Poisson curve with rate = median count rate of data. |
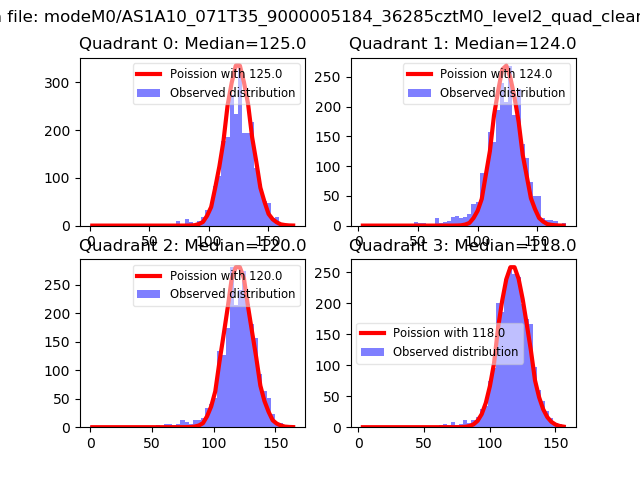 |
 |
| Quadrant-wise count rates Data is divided into 100 sec bins |
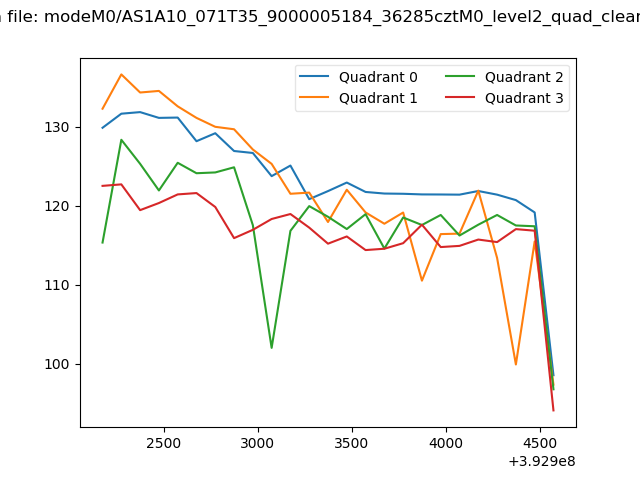 |
|
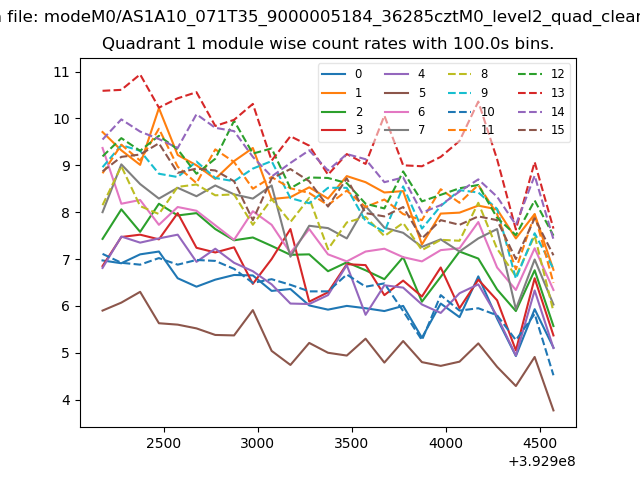
| Module-wise count rates for Quadrant A Data is divided into 100 sec bins |
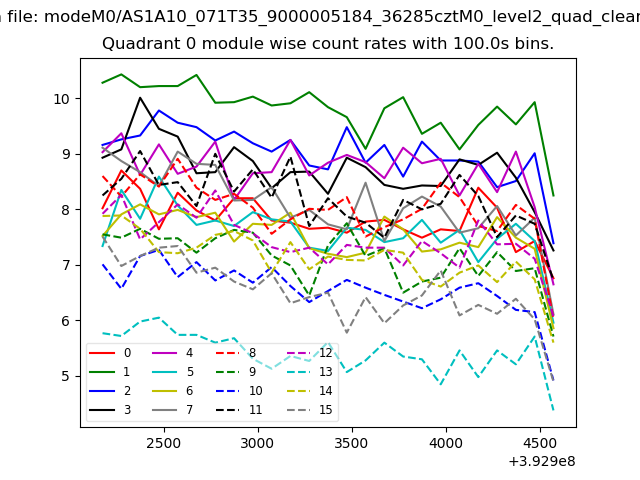 |
 |
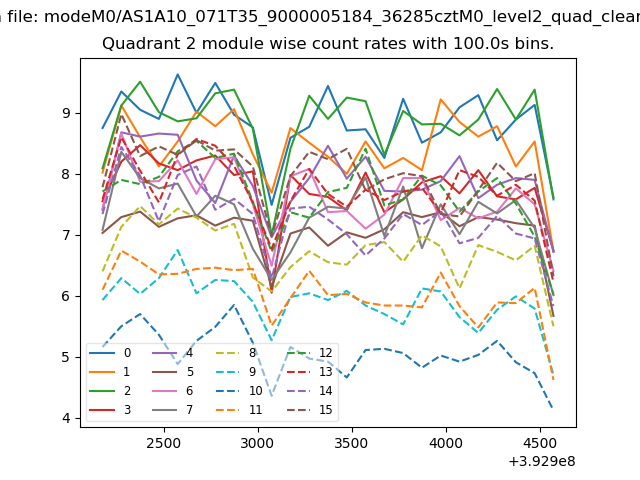
| Module-wise count rates for Quadrant B Data is divided into 100 sec bins |
 |
 |
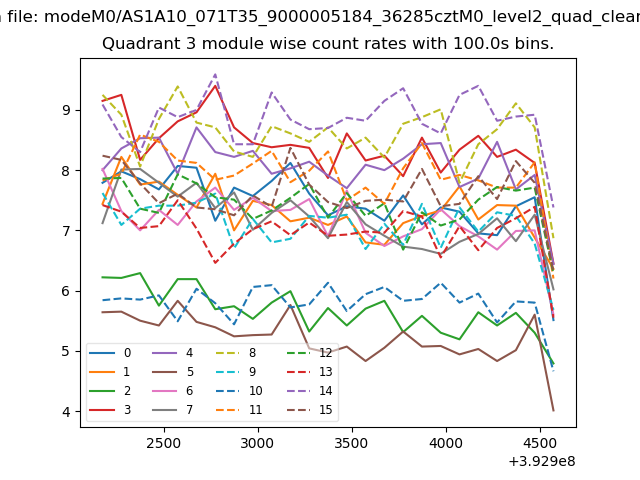
| Module-wise count rates for Quadrant C Data is divided into 100 sec bins |
 |
 |
| Module-wise count rates for Quadrant D Data is divided into 100 sec bins |
 |
 |
| Parameter | Plot |
|---|---|
| CZT HV Monitor | 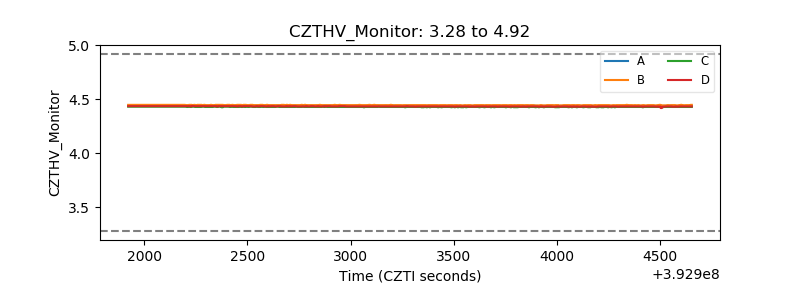 |
| D_VDD | 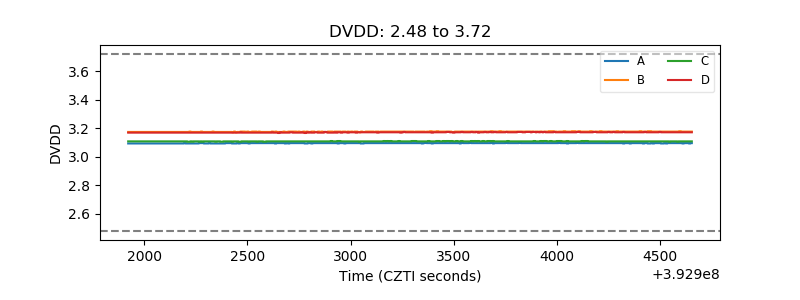 |
| Temperature 1 | 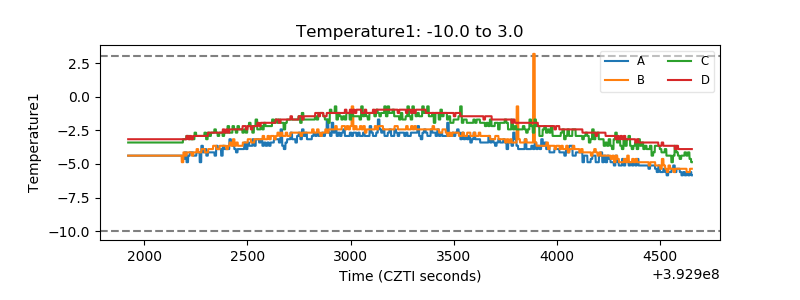 |
| Veto HV Monitor | 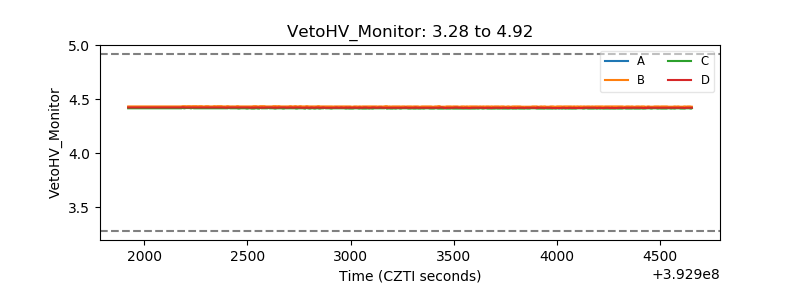 |
| Veto LLD | 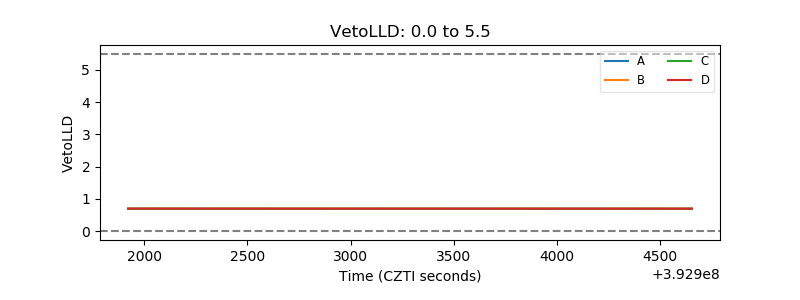 |
| Alpha Counter | 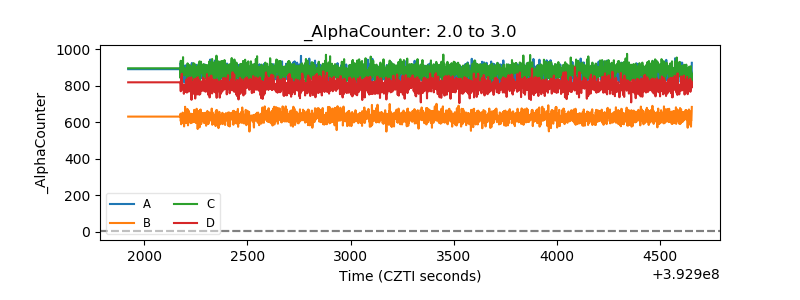 |
| _CPM_Rate | 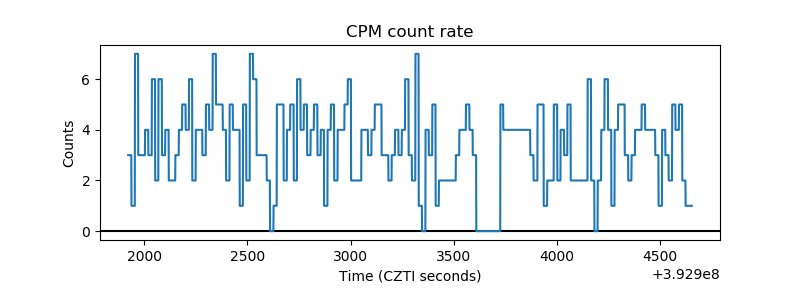 |
| CZT Counter | 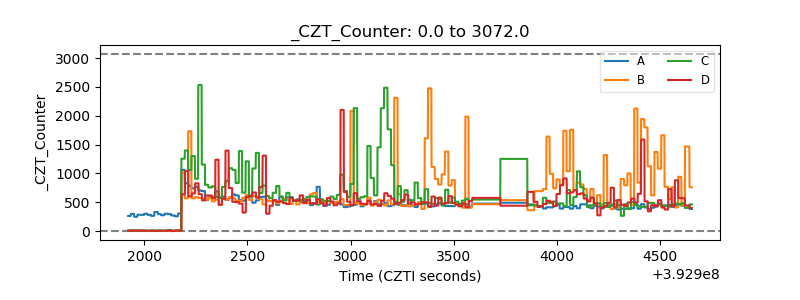 |
| +2.5 Volts monitor | 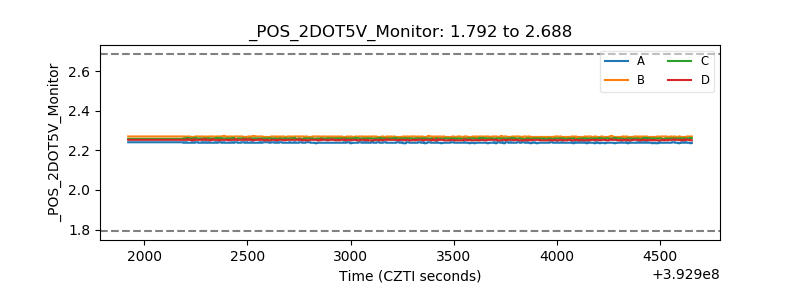 |
| +5 Volts monitor | 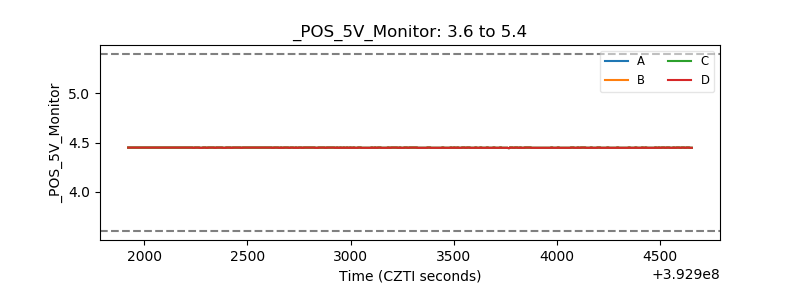 |
| _ROLL_ROT | 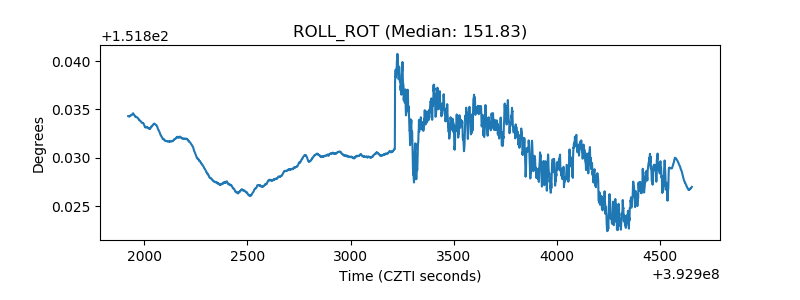 |
| _Roll_DEC | 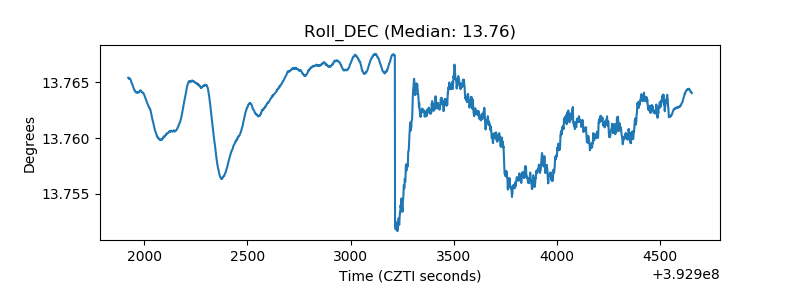 |
| _Roll_RA | 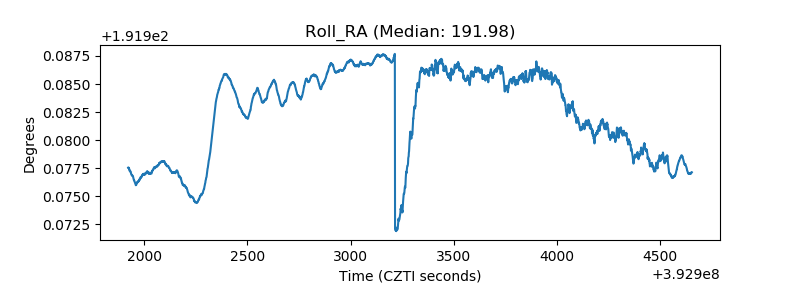 |
| Veto Counter | 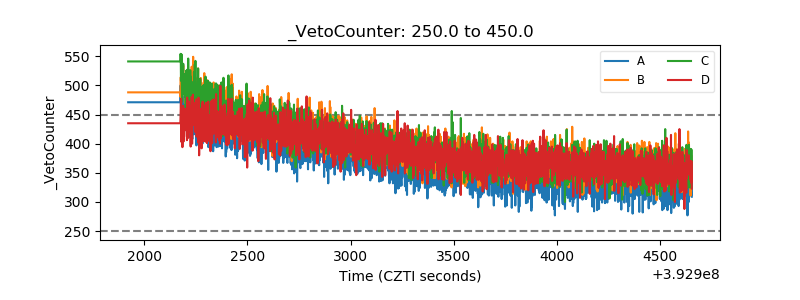 |