| Param | Original file | Final file |
|---|---|---|
| Filename | modeM0/AS1A10_071T35_9000005184_36284cztM0_level2.evt | modeM0/AS1A10_071T35_9000005184_36284cztM0_level2_quad_clean.evt |
| Size (bytes) | 495,668,160 | 87,013,440 |
| Size | 472.7 MB | 83.0 MB |
| Events in quadrant A | 3,036,176 | 563,690 |
| Events in quadrant B | 3,185,477 | 569,069 |
| Events in quadrant C | 3,801,407 | 547,376 |
| Events in quadrant D | 4,570,283 | 524,853 |
| Mode M0 | |||
|---|---|---|---|
| Quadrant | BADHDUFLAG | Total packets | Discarded packets |
| A | 0 | 12865 | 3 |
| B | 0 | 13257 | 2 |
| C | 0 | 15035 | 2 |
| D | 0 | 17733 | 2 |
| Mode SS | |||
|---|---|---|---|
| Quadrant | BADHDUFLAG | Total packets | Discarded packets |
| A | 0 | 128 | 0 |
| B | 0 | 128 | 0 |
| C | 0 | 128 | 0 |
| D | 0 | 128 | 0 |
| Mode M9 | |||
|---|---|---|---|
| Quadrant | BADHDUFLAG | Total packets | Discarded packets |
| A | 0 | 29 | 0 |
| B | 0 | 29 | 0 |
| C | 0 | 29 | 0 |
| D | 0 | 29 | 0 |
| Quadrant | Total seconds | Saturated seconds | Saturation percentage |
|---|---|---|---|
| A | 6158 | 7 | 0.113673% |
| B | 6158 | 46 | 0.746996% |
| C | 6158 | 130 | 2.111075% |
| D | 6158 | 449 | 7.291328% |
Noise dominated data is calculated using 1-second bins in cleaned event files. If a bin has >2000 counts, and if more than 50% of those come from <1% of pixels, then it is considered to be noise-dominated and hence unusable.
| Quadrant | # 1 sec bins | Bins with >0 counts | Bins with >2000 counts | High rate bins dominated by noise | Noise dominated (total time) | Noise dominated (detector-on time) | Marked lightcurve |
|---|---|---|---|---|---|---|---|
| A | 9083 | 6160 | 0 | 0 | 0.00% | 0.00% | 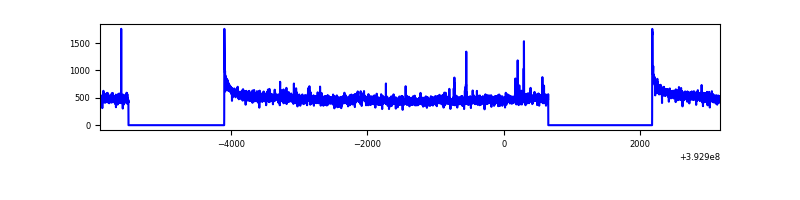 |
| B | 9083 | 6160 | 31 | 31 | 0.34% | 0.50% | 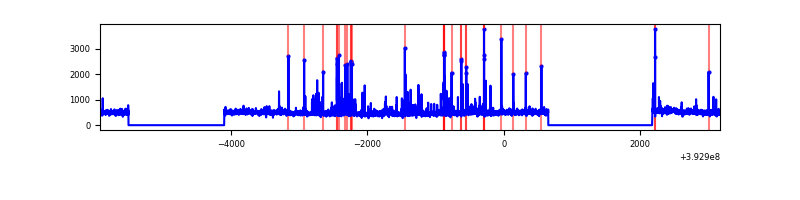 |
| C | 9083 | 6160 | 94 | 94 | 1.03% | 1.53% | 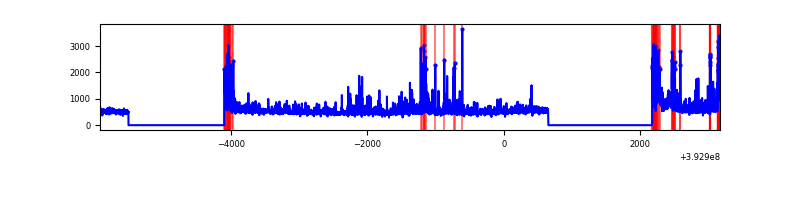 |
| D | 9083 | 6160 | 416 | 416 | 4.58% | 6.75% | 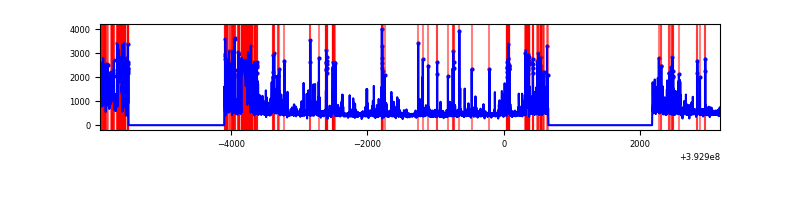 |
Top three noisy pixels from each quadrant. If the there are fewer than three noisy pixels in the level2.evt file, extra rows are filled as -1
| Pixel properties | Quadrant properties | ||||||
|---|---|---|---|---|---|---|---|
| Quadrant | DetID | PixID | Counts | Sigma | Mean | Median | Sigma |
| A | 10 | 83 | 193015 | 1307.36 | 723 | 708 | 147.1 |
| A | 12 | 189 | 22872 | 150.68 | 723 | 708 | 147.1 |
| A | 13 | 6 | 13286 | 85.51 | 723 | 708 | 147.1 |
| B | 5 | 172 | 240565 | 1706.11 | 712 | 691 | 140.6 |
| B | 0 | 155 | 64807 | 456.03 | 712 | 691 | 140.6 |
| B | 0 | 190 | 30893 | 214.81 | 712 | 691 | 140.6 |
| C | 0 | 10 | 464235 | 2812.48 | 696 | 702 | 164.8 |
| C | 0 | 207 | 365502 | 2213.42 | 696 | 702 | 164.8 |
| C | 15 | 214 | 259088 | 1567.76 | 696 | 702 | 164.8 |
| D | 12 | 6 | 953366 | 5711.56 | 677 | 658 | 166.8 |
| D | 13 | 171 | 240821 | 1439.8 | 677 | 658 | 166.8 |
| D | 12 | 227 | 234734 | 1403.3 | 677 | 658 | 166.8 |
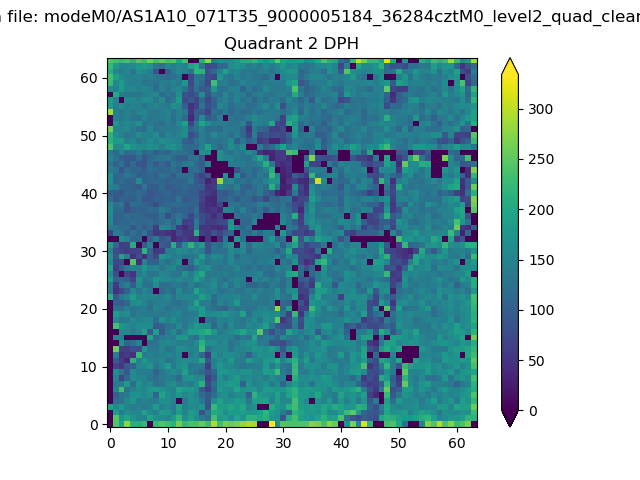
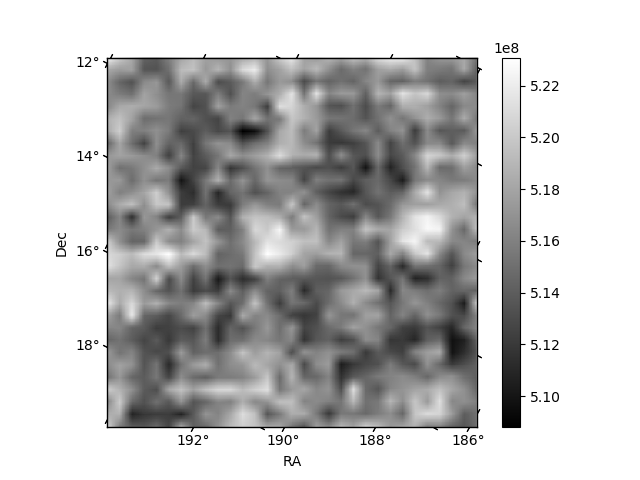
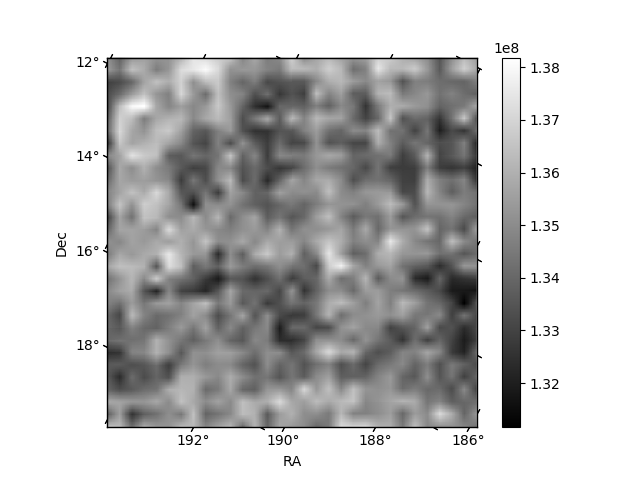
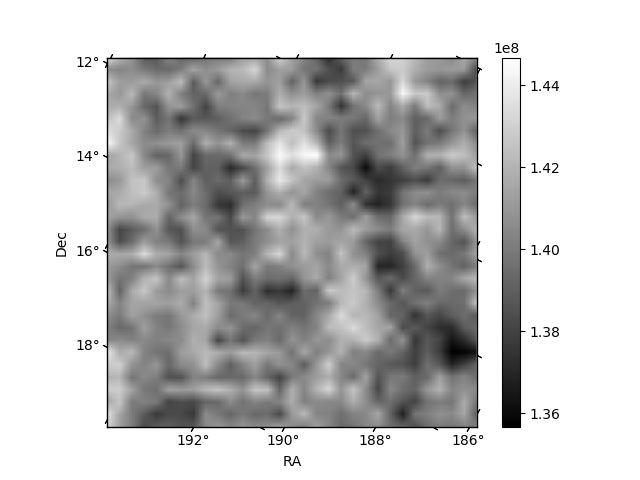
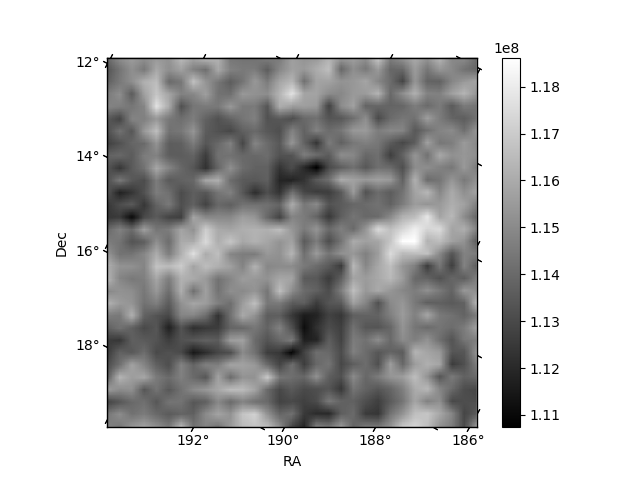
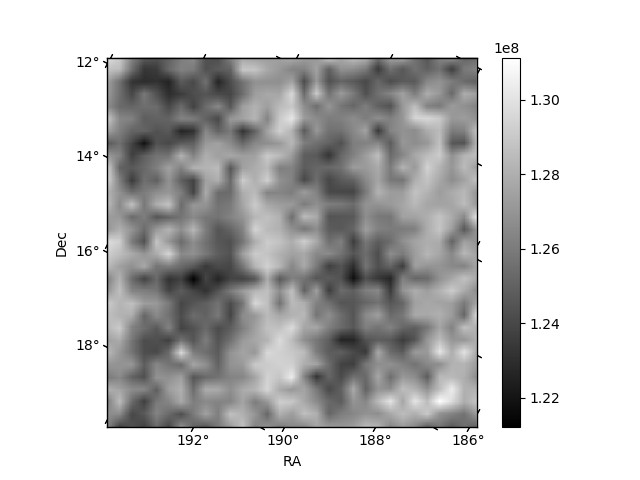
Histogram calculated using DETX and DETY for each event in the final _common_clean file
| Quadrant A | 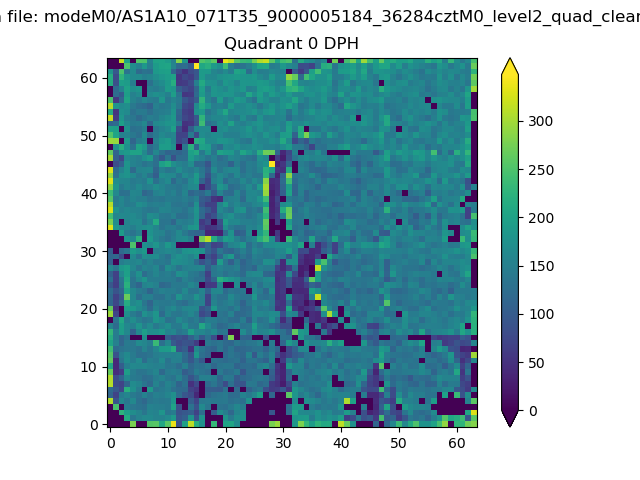 |
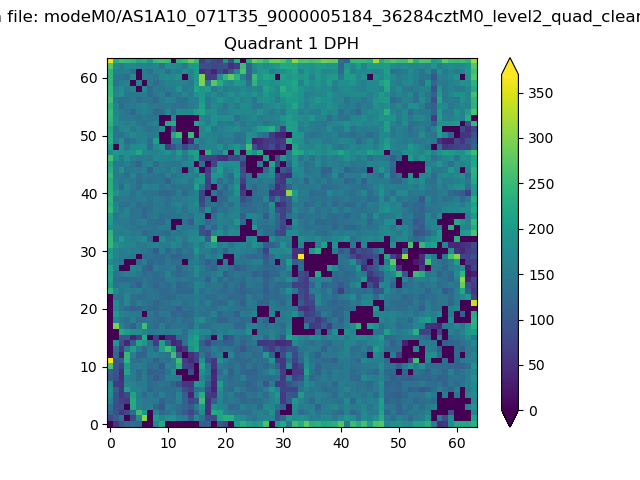 |
Quadrant B |
|---|---|---|---|
| Quadrant D | 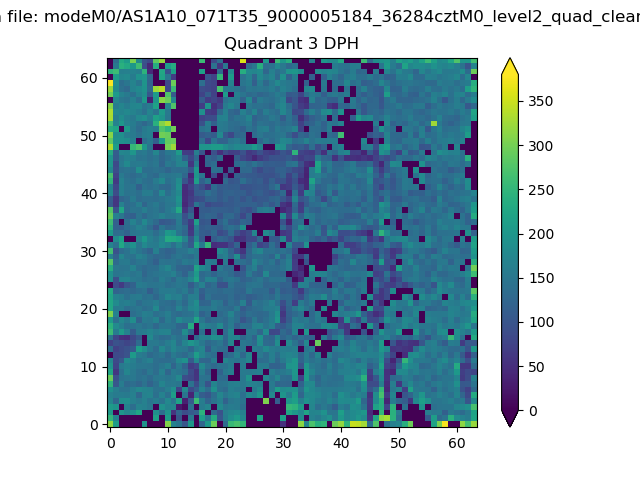 |
 |
Quadrant C |
| Plot type | Count rate plots | Images |
|---|---|---|
| Comparison with Poisson distribution Blue bars denote a histogram of data divided into 1 sec bins. Red curve is a Poisson curve with rate = median count rate of data. |
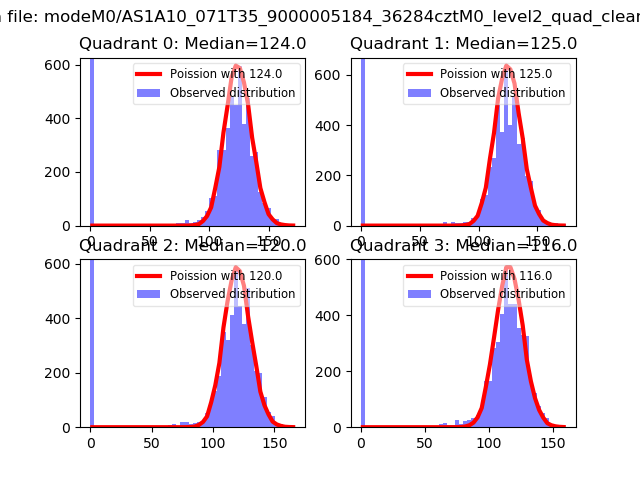 |
 |
| Quadrant-wise count rates Data is divided into 100 sec bins |
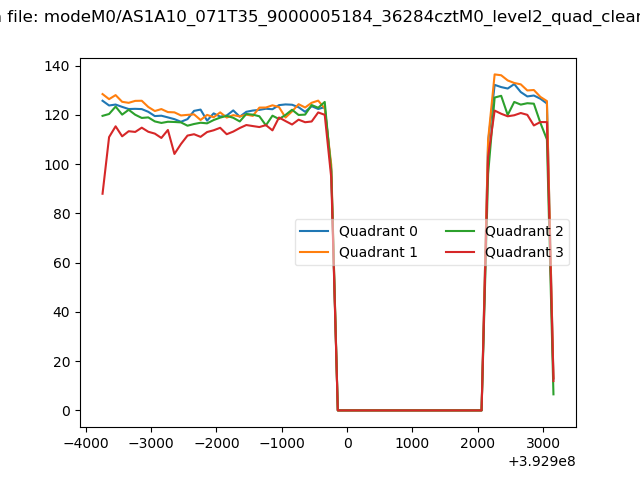 |
|
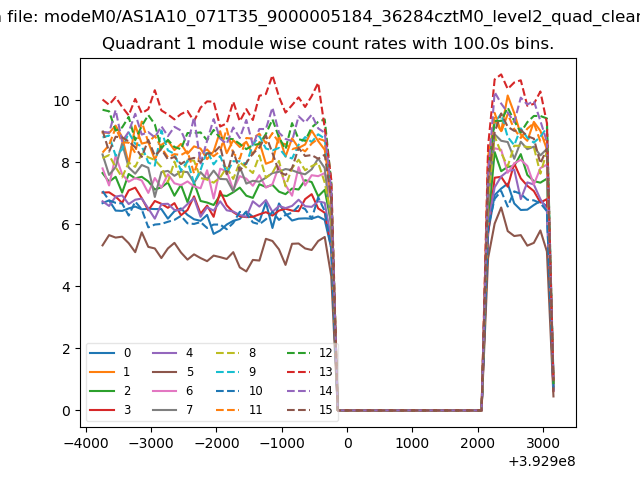
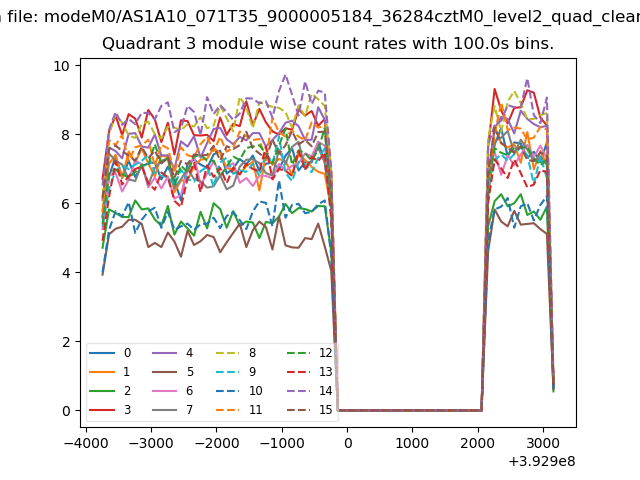
| Module-wise count rates for Quadrant A Data is divided into 100 sec bins |
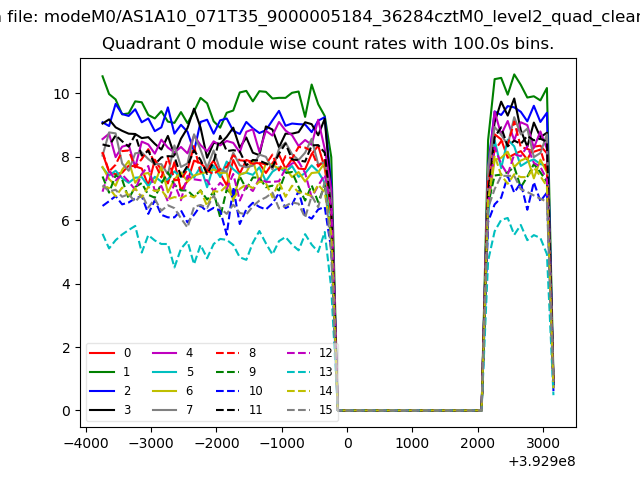 |
 |
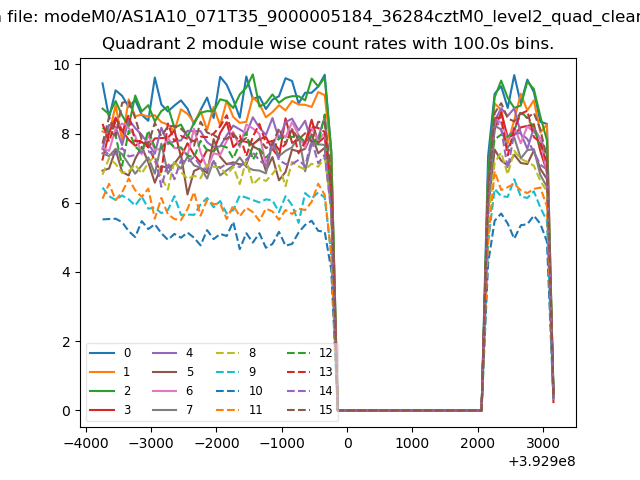
| Module-wise count rates for Quadrant B Data is divided into 100 sec bins |
 |
 |
| Module-wise count rates for Quadrant C Data is divided into 100 sec bins |
 |
 |
| Module-wise count rates for Quadrant D Data is divided into 100 sec bins |
 |
 |
| Parameter | Plot |
|---|---|
| CZT HV Monitor | 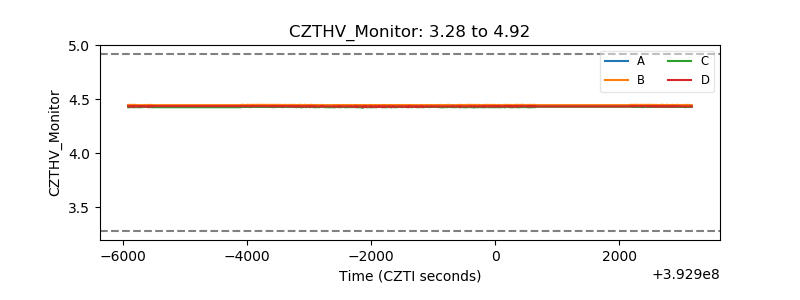 |
| D_VDD | 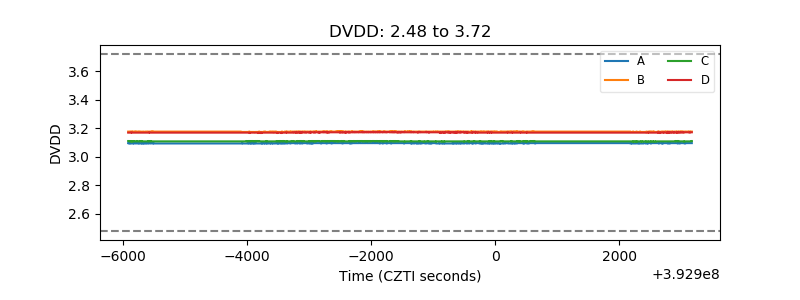 |
| Temperature 1 | 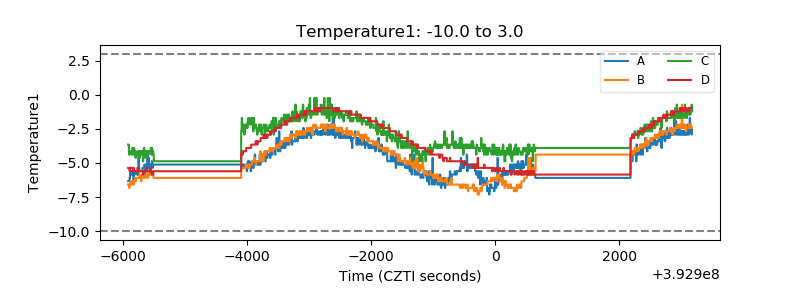 |
| Veto HV Monitor | 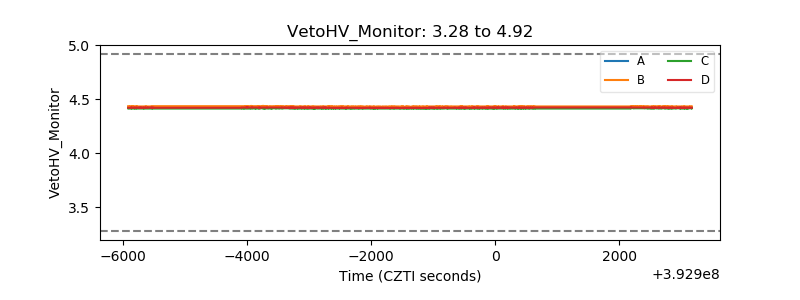 |
| Veto LLD | 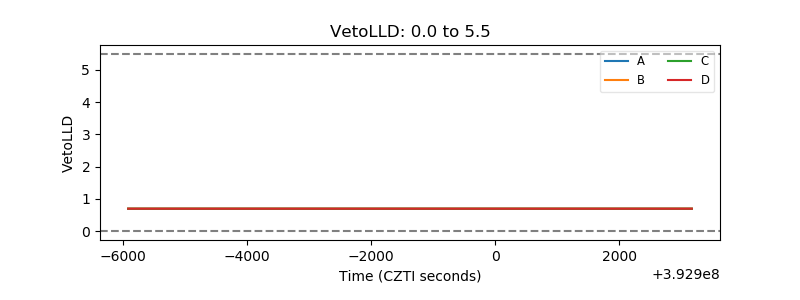 |
| Alpha Counter | 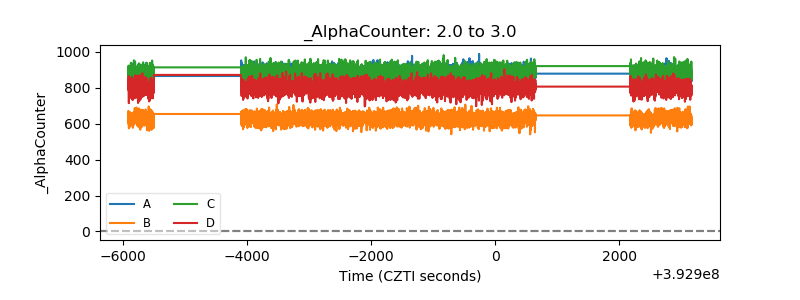 |
| _CPM_Rate | 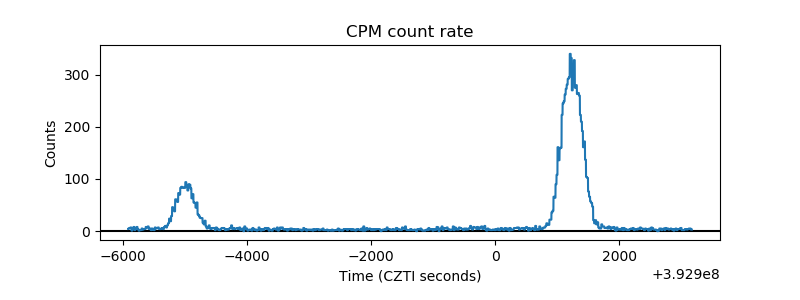 |
| CZT Counter | 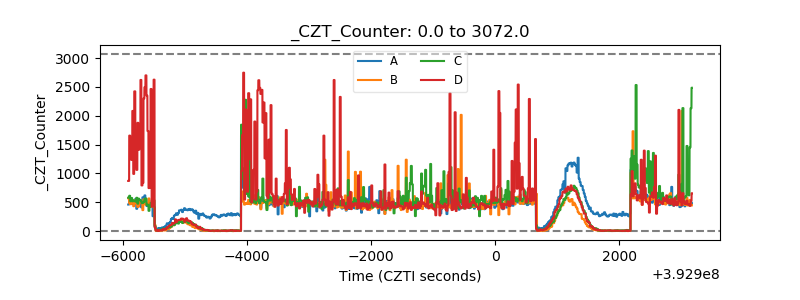 |
| +2.5 Volts monitor | 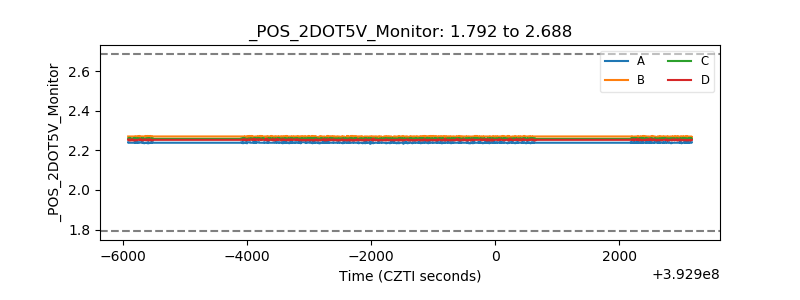 |
| +5 Volts monitor | 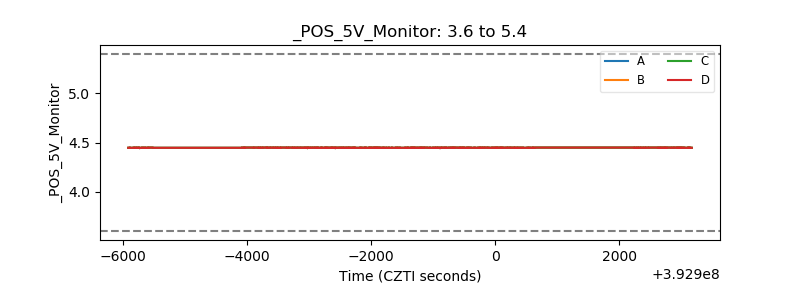 |
| _ROLL_ROT | 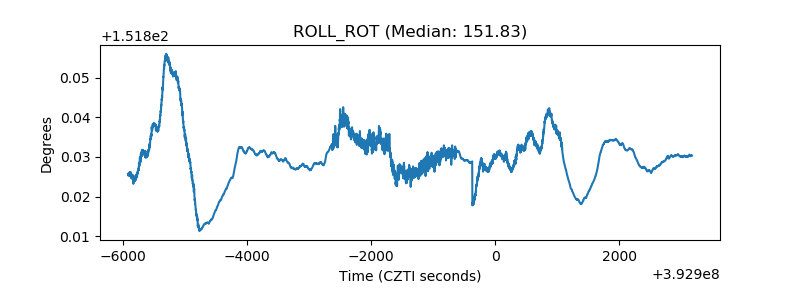 |
| _Roll_DEC | 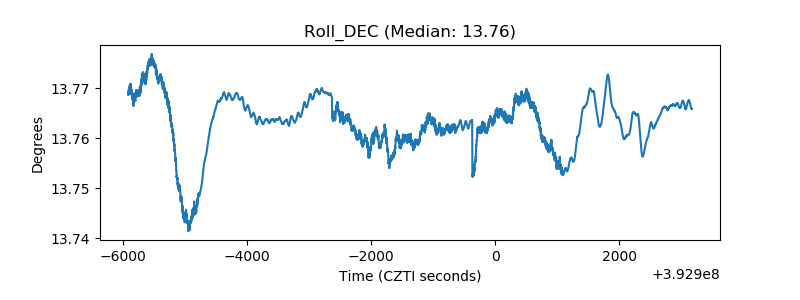 |
| _Roll_RA | 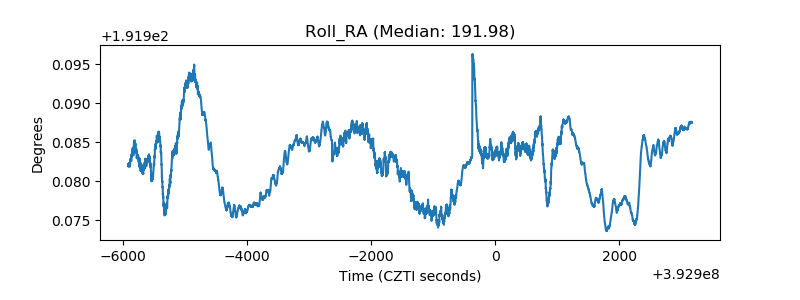 |
| Veto Counter | 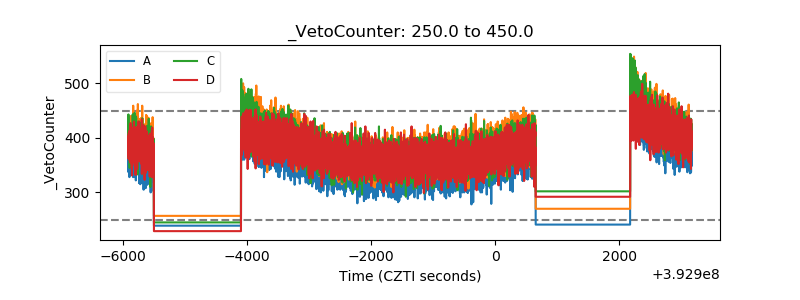 |