| Param | Original file | Final file |
|---|---|---|
| Filename | modeM0/AS1A10_071T35_9000005184_36283cztM0_level2.evt | modeM0/AS1A10_071T35_9000005184_36283cztM0_level2_quad_clean.evt |
| Size (bytes) | 802,710,720 | 140,512,320 |
| Size | 765.5 MB | 134.0 MB |
| Events in quadrant A | 4,656,904 | 918,994 |
| Events in quadrant B | 5,315,031 | 925,482 |
| Events in quadrant C | 5,051,747 | 910,088 |
| Events in quadrant D | 8,622,946 | 820,737 |
| Mode M0 | |||
|---|---|---|---|
| Quadrant | BADHDUFLAG | Total packets | Discarded packets |
| A | 0 | 20005 | 3 |
| B | 0 | 22089 | 2 |
| C | 0 | 20761 | 2 |
| D | 0 | 32246 | 2 |
| Mode SS | |||
|---|---|---|---|
| Quadrant | BADHDUFLAG | Total packets | Discarded packets |
| A | 0 | 200 | 0 |
| B | 0 | 200 | 0 |
| C | 0 | 200 | 0 |
| D | 0 | 200 | 0 |
| Mode M9 | |||
|---|---|---|---|
| Quadrant | BADHDUFLAG | Total packets | Discarded packets |
| A | 0 | 26 | 0 |
| B | 0 | 26 | 0 |
| C | 0 | 26 | 0 |
| D | 0 | 26 | 0 |
| Quadrant | Total seconds | Saturated seconds | Saturation percentage |
|---|---|---|---|
| A | 9810 | 7 | 0.071356% |
| B | 9810 | 212 | 2.161060% |
| C | 9810 | 51 | 0.519878% |
| D | 9810 | 1055 | 10.754332% |
Noise dominated data is calculated using 1-second bins in cleaned event files. If a bin has >2000 counts, and if more than 50% of those come from <1% of pixels, then it is considered to be noise-dominated and hence unusable.
| Quadrant | # 1 sec bins | Bins with >0 counts | Bins with >2000 counts | High rate bins dominated by noise | Noise dominated (total time) | Noise dominated (detector-on time) | Marked lightcurve |
|---|---|---|---|---|---|---|---|
| A | 12404 | 9812 | 0 | 0 | 0.00% | 0.00% |  |
| B | 12404 | 9812 | 161 | 161 | 1.30% | 1.64% |  |
| C | 12404 | 9812 | 23 | 23 | 0.19% | 0.23% |  |
| D | 12404 | 9812 | 1054 | 1054 | 8.50% | 10.74% |  |
Top three noisy pixels from each quadrant. If the there are fewer than three noisy pixels in the level2.evt file, extra rows are filled as -1
| Pixel properties | Quadrant properties | ||||||
|---|---|---|---|---|---|---|---|
| Quadrant | DetID | PixID | Counts | Sigma | Mean | Median | Sigma |
| A | 10 | 83 | 249289 | 1081.99 | 1128 | 1103 | 229.4 |
| A | 13 | 6 | 21852 | 90.46 | 1128 | 1103 | 229.4 |
| A | 9 | 143 | 18863 | 77.43 | 1128 | 1103 | 229.4 |
| B | 5 | 172 | 376152 | 1737.02 | 1110 | 1080 | 215.9 |
| B | 8 | 128 | 331594 | 1530.66 | 1110 | 1080 | 215.9 |
| B | 5 | 255 | 66067 | 300.97 | 1110 | 1080 | 215.9 |
| C | 15 | 214 | 408451 | 1585.74 | 1097 | 1104 | 256.9 |
| C | 0 | 10 | 220986 | 855.97 | 1097 | 1104 | 256.9 |
| C | 0 | 207 | 132995 | 513.43 | 1097 | 1104 | 256.9 |
| D | 12 | 227 | 1765728 | 6765.25 | 1059 | 1027 | 260.8 |
| D | 12 | 6 | 1736321 | 6652.51 | 1059 | 1027 | 260.8 |
| D | 13 | 171 | 329320 | 1258.56 | 1059 | 1027 | 260.8 |
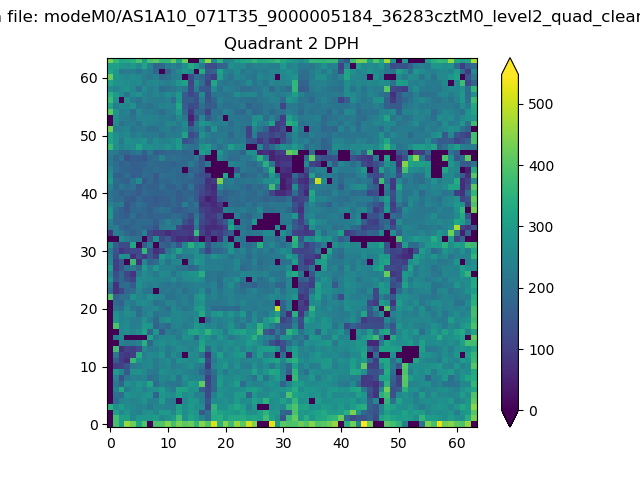
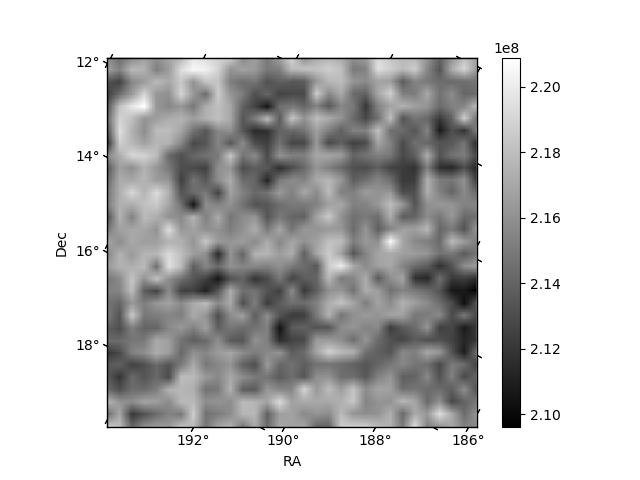
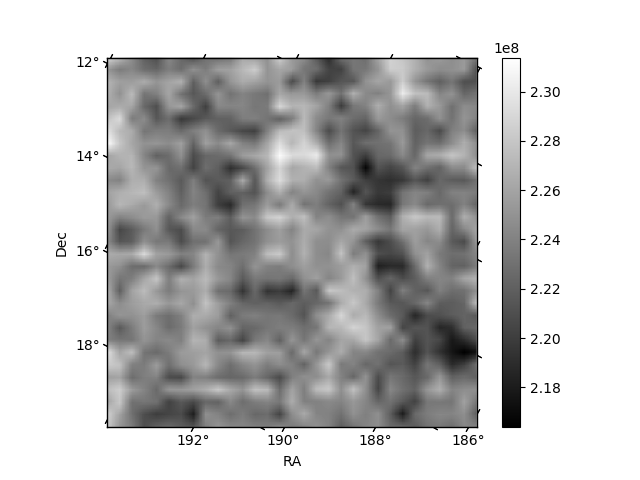
Histogram calculated using DETX and DETY for each event in the final _common_clean file
| Quadrant A | 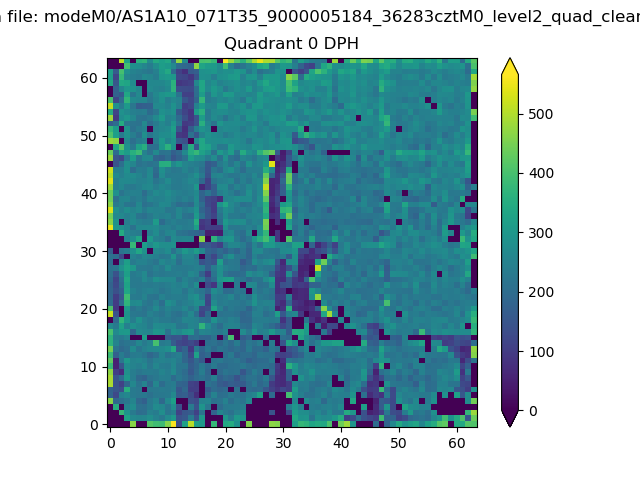 |
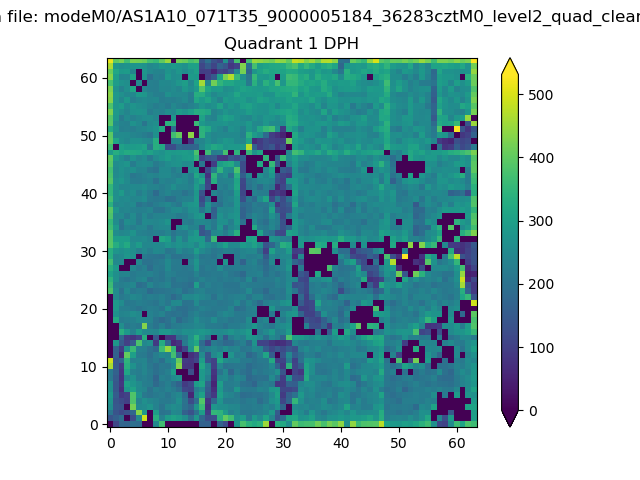 |
Quadrant B |
|---|---|---|---|
| Quadrant D | 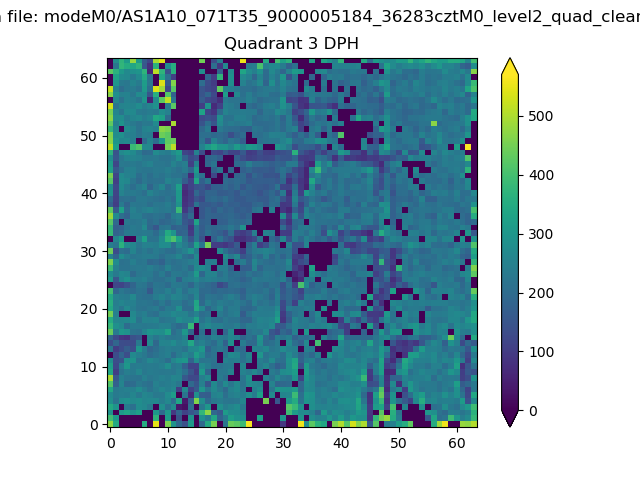 |
 |
Quadrant C |
| Plot type | Count rate plots | Images |
|---|---|---|
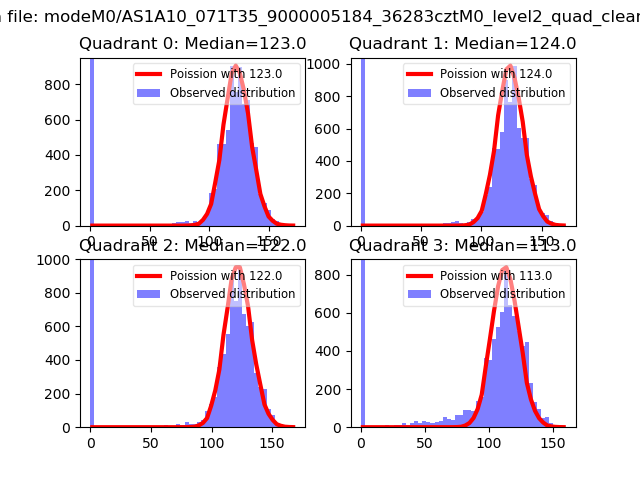
| Comparison with Poisson distribution Blue bars denote a histogram of data divided into 1 sec bins. Red curve is a Poisson curve with rate = median count rate of data. |
 |
 |
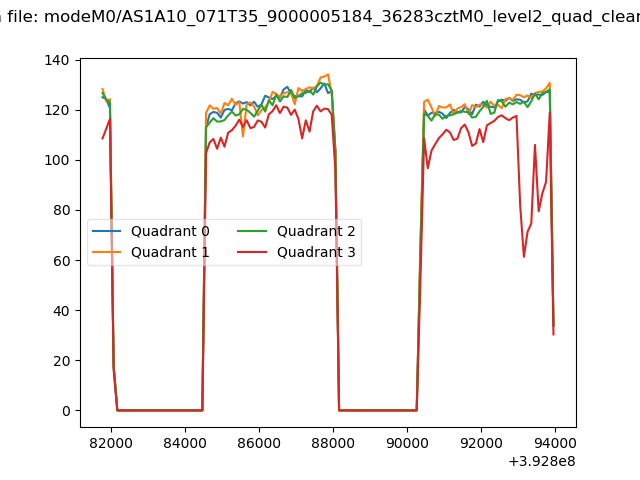
| Quadrant-wise count rates Data is divided into 100 sec bins |
 |
|
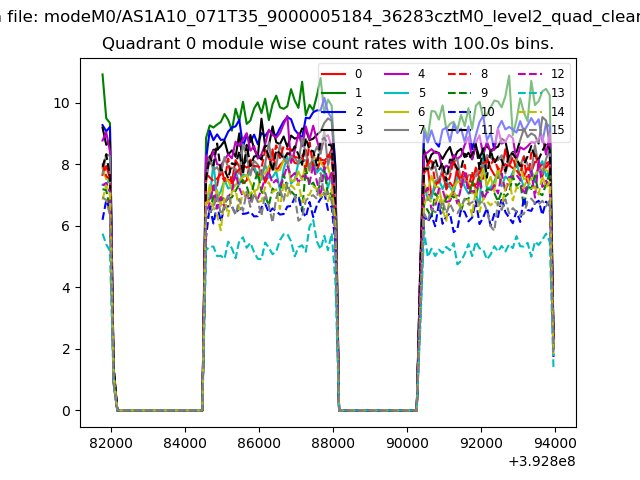
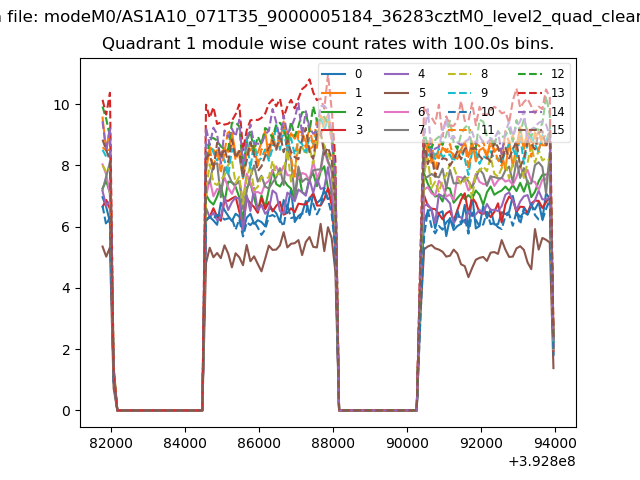
| Module-wise count rates for Quadrant A Data is divided into 100 sec bins |
 |
 |
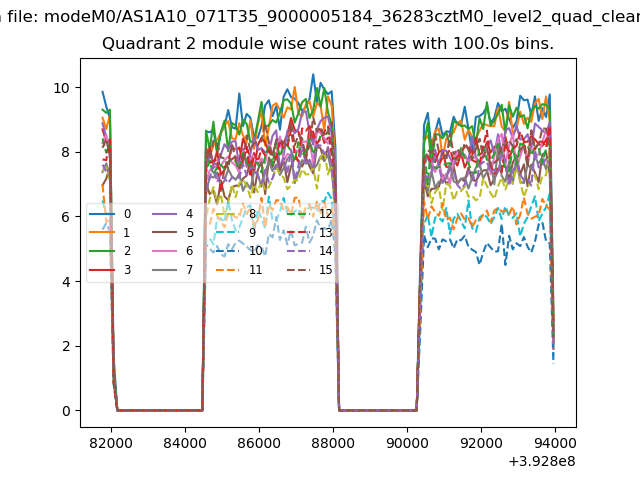
| Module-wise count rates for Quadrant B Data is divided into 100 sec bins |
 |
 |
| Module-wise count rates for Quadrant C Data is divided into 100 sec bins |
 |
 |
| Module-wise count rates for Quadrant D Data is divided into 100 sec bins |
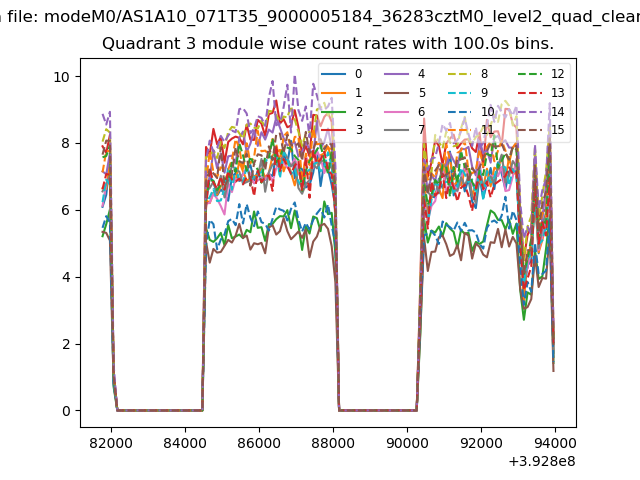 |
 |
| Parameter | Plot |
|---|---|
| CZT HV Monitor | 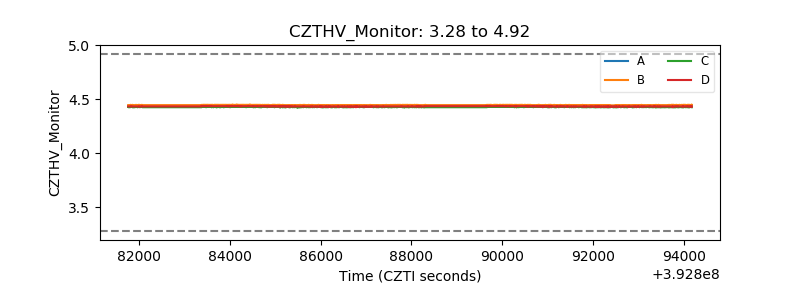 |
| D_VDD | 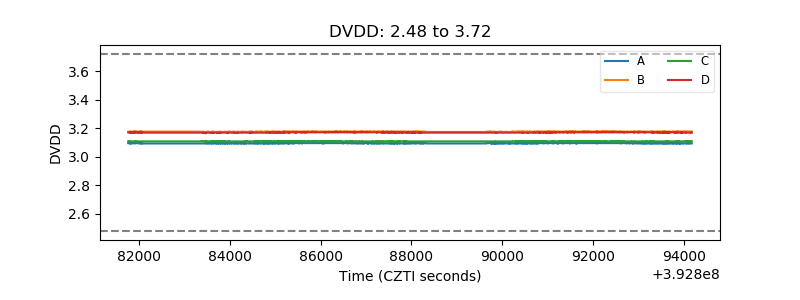 |
| Temperature 1 | 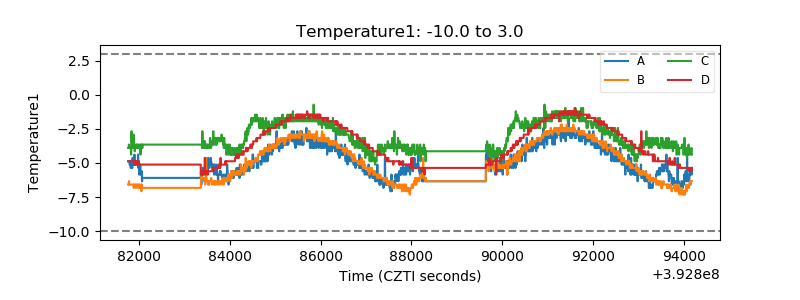 |
| Veto HV Monitor | 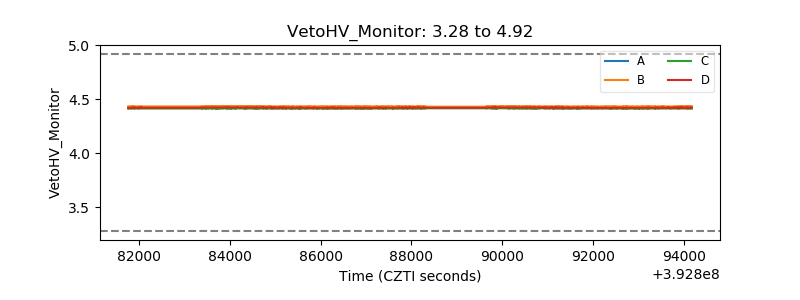 |
| Veto LLD | 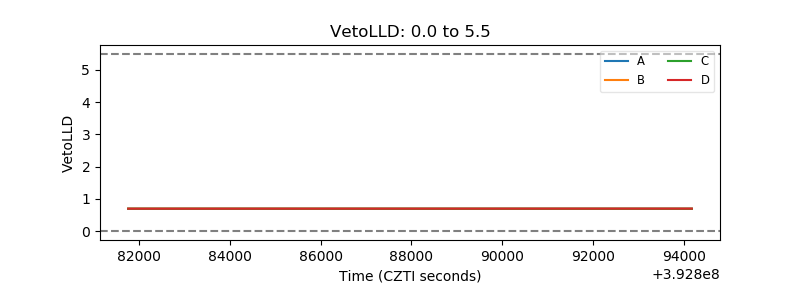 |
| Alpha Counter | 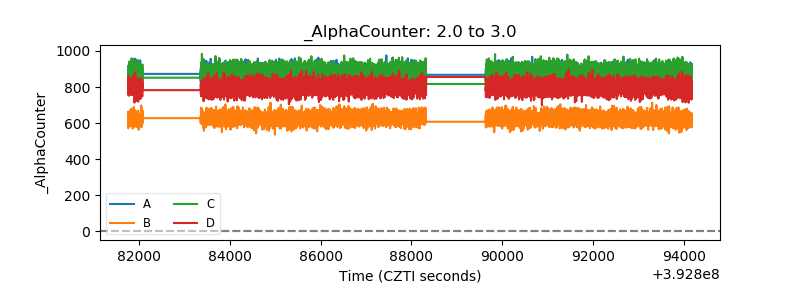 |
| _CPM_Rate | 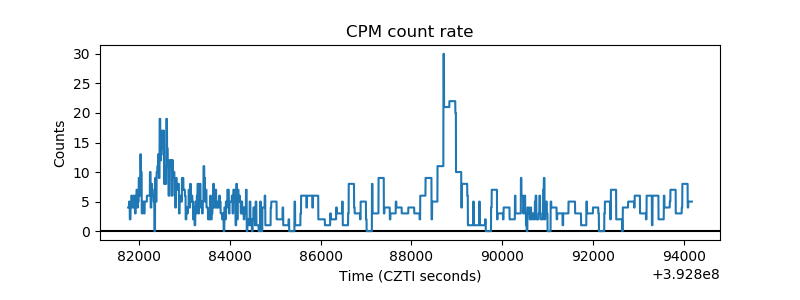 |
| CZT Counter | 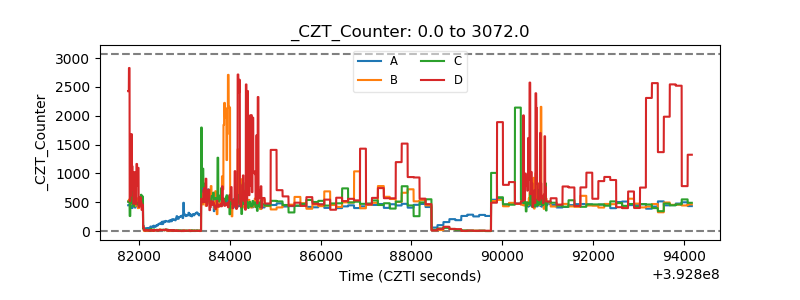 |
| +2.5 Volts monitor |  |
| +5 Volts monitor | 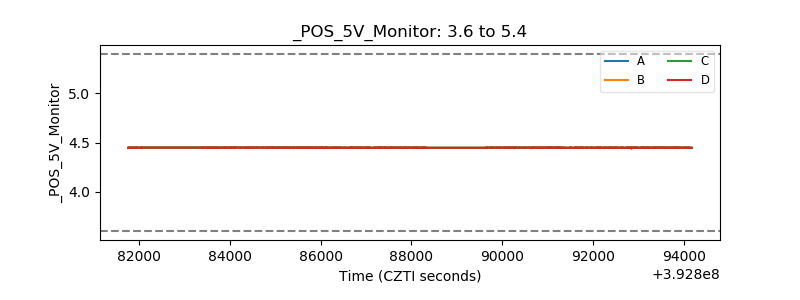 |
| _ROLL_ROT | 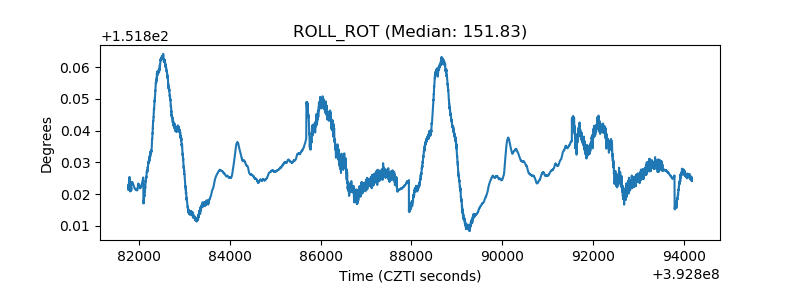 |
| _Roll_DEC | 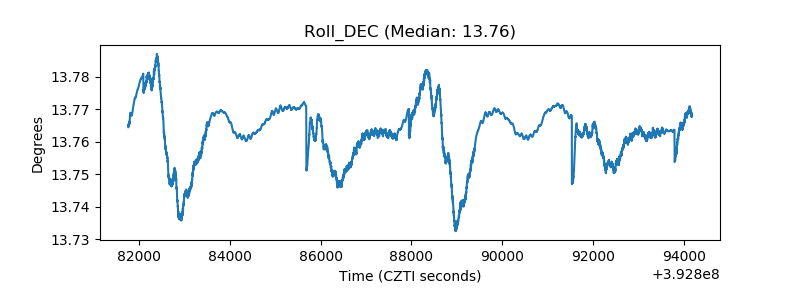 |
| _Roll_RA | 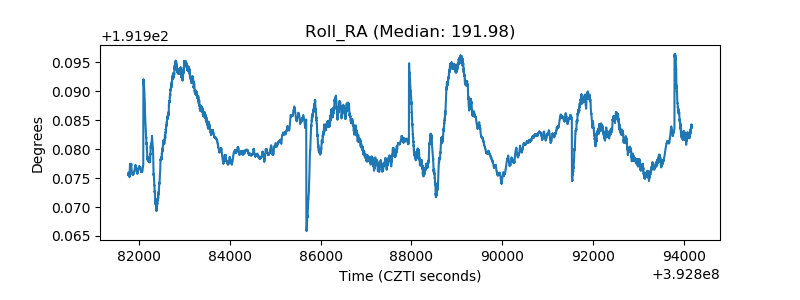 |
| Veto Counter | 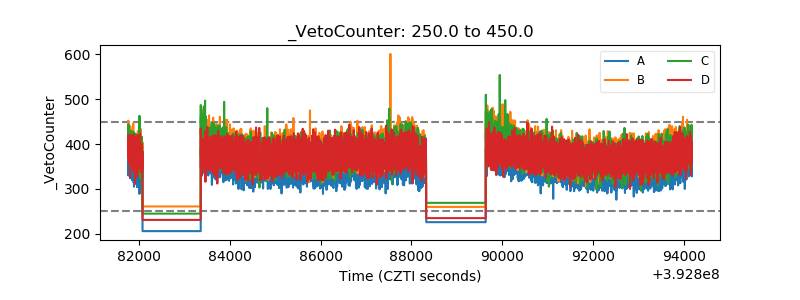 |