| Param | Original file | Final file |
|---|---|---|
| Filename | modeM0/AS1A10_071T35_9000005184_36276cztM0_level2.evt | modeM0/AS1A10_071T35_9000005184_36276cztM0_level2_quad_clean.evt |
| Size (bytes) | 449,530,560 | 60,756,480 |
| Size | 428.7 MB | 57.9 MB |
| Events in quadrant A | 2,586,130 | 384,118 |
| Events in quadrant B | 3,844,021 | 389,526 |
| Events in quadrant C | 2,764,694 | 375,131 |
| Events in quadrant D | 4,086,581 | 346,787 |
| Mode M0 | |||
|---|---|---|---|
| Quadrant | BADHDUFLAG | Total packets | Discarded packets |
| A | 0 | 10625 | 3 |
| B | 0 | 14526 | 2 |
| C | 0 | 10996 | 2 |
| D | 0 | 15341 | 2 |
| Mode SS | |||
|---|---|---|---|
| Quadrant | BADHDUFLAG | Total packets | Discarded packets |
| A | 0 | 100 | 0 |
| B | 0 | 100 | 0 |
| C | 0 | 100 | 0 |
| D | 0 | 100 | 0 |
| Mode M9 | |||
|---|---|---|---|
| Quadrant | BADHDUFLAG | Total packets | Discarded packets |
| A | 0 | 36 | 0 |
| B | 0 | 36 | 0 |
| C | 0 | 36 | 0 |
| D | 0 | 37 | 0 |
| Quadrant | Total seconds | Saturated seconds | Saturation percentage |
|---|---|---|---|
| A | 4901 | 33 | 0.673332% |
| B | 4901 | 447 | 9.120588% |
| C | 4901 | 78 | 1.591512% |
| D | 4901 | 346 | 7.059784% |
Noise dominated data is calculated using 1-second bins in cleaned event files. If a bin has >2000 counts, and if more than 50% of those come from <1% of pixels, then it is considered to be noise-dominated and hence unusable.
| Quadrant | # 1 sec bins | Bins with >0 counts | Bins with >2000 counts | High rate bins dominated by noise | Noise dominated (total time) | Noise dominated (detector-on time) | Marked lightcurve |
|---|---|---|---|---|---|---|---|
| A | 7054 | 4902 | 22 | 22 | 0.31% | 0.45% | 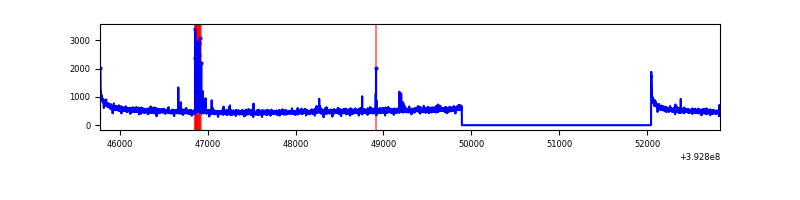 |
| B | 7054 | 4902 | 329 | 329 | 4.66% | 6.71% | 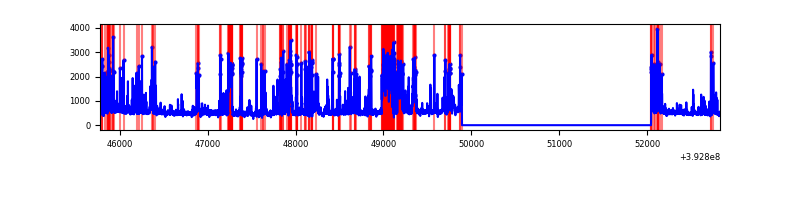 |
| C | 7054 | 4902 | 73 | 73 | 1.03% | 1.49% | 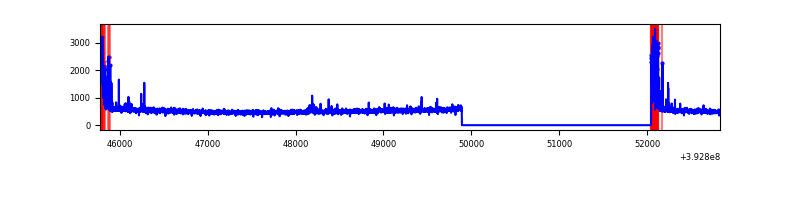 |
| D | 7054 | 4902 | 358 | 358 | 5.08% | 7.30% | 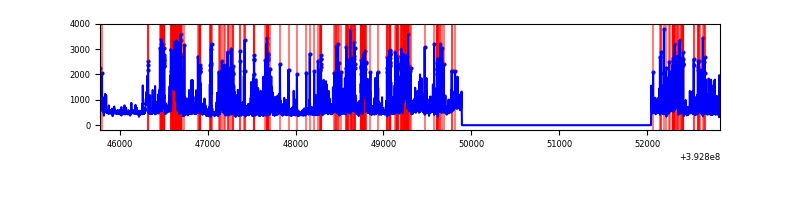 |
Top three noisy pixels from each quadrant. If the there are fewer than three noisy pixels in the level2.evt file, extra rows are filled as -1
| Pixel properties | Quadrant properties | ||||||
|---|---|---|---|---|---|---|---|
| Quadrant | DetID | PixID | Counts | Sigma | Mean | Median | Sigma |
| A | 10 | 83 | 168556 | 1388.13 | 598 | 587 | 121.0 |
| A | 13 | 248 | 80290 | 658.68 | 598 | 587 | 121.0 |
| A | 13 | 6 | 17540 | 140.1 | 598 | 587 | 121.0 |
| B | 5 | 172 | 1263598 | 11414.11 | 582 | 566 | 110.7 |
| B | 5 | 236 | 176652 | 1591.3 | 582 | 566 | 110.7 |
| B | 8 | 128 | 33866 | 300.93 | 582 | 566 | 110.7 |
| C | 0 | 10 | 281882 | 2073.6 | 579 | 586 | 135.7 |
| C | 15 | 214 | 205292 | 1509.01 | 579 | 586 | 135.7 |
| C | 14 | 67 | 6949 | 46.91 | 579 | 586 | 135.7 |
| D | 12 | 6 | 864220 | 6244.09 | 561 | 545 | 138.3 |
| D | 13 | 171 | 490665 | 3543.41 | 561 | 545 | 138.3 |
| D | 7 | 223 | 177272 | 1277.68 | 561 | 545 | 138.3 |
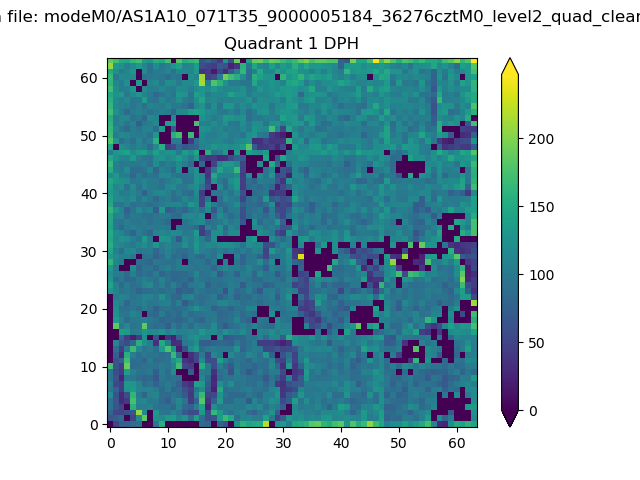
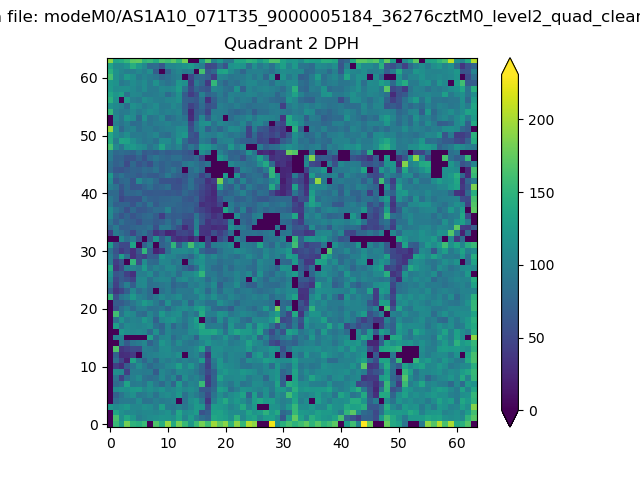
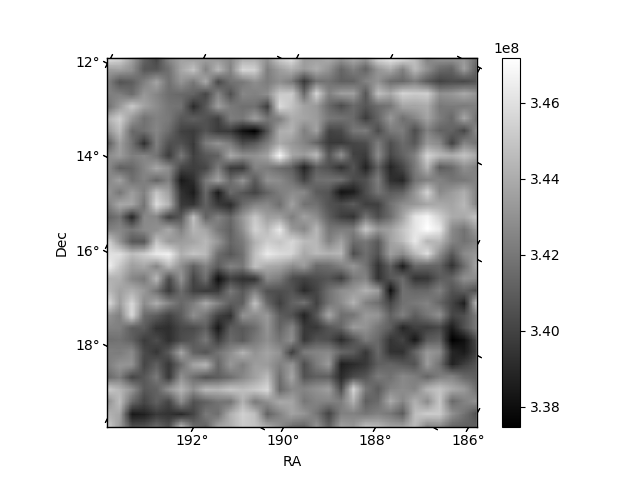
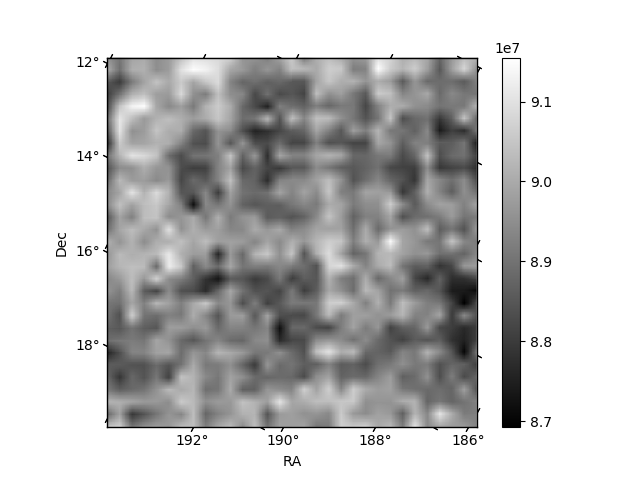
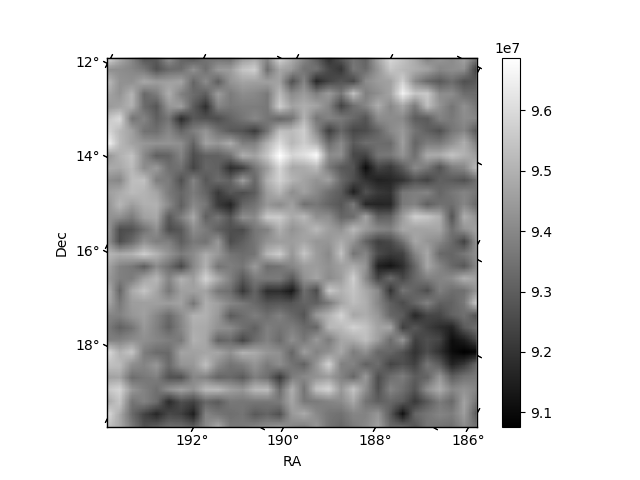
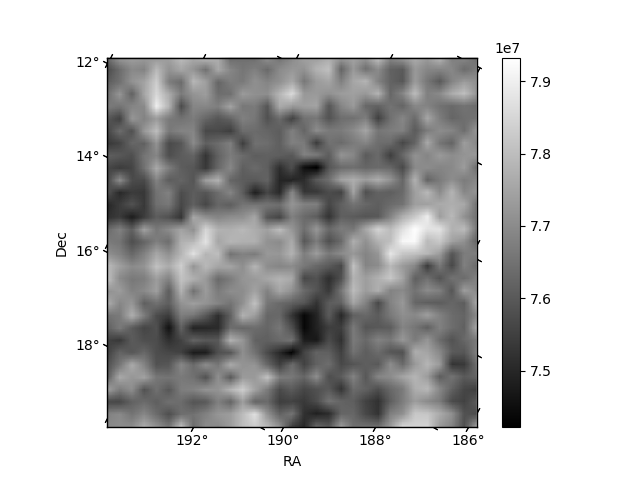
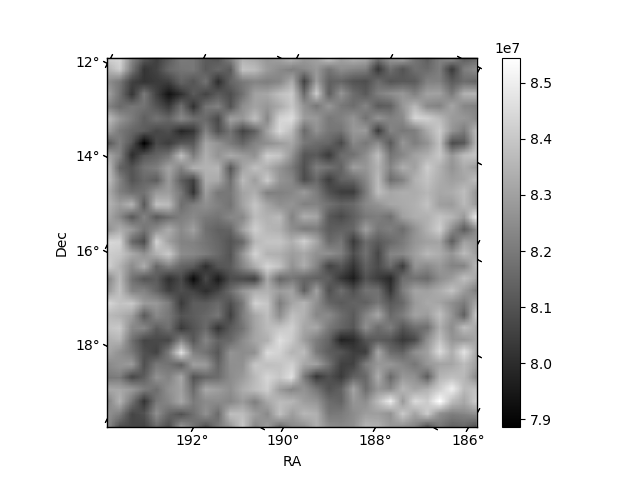
Histogram calculated using DETX and DETY for each event in the final _common_clean file
| Quadrant A |  |
 |
Quadrant B |
|---|---|---|---|
| Quadrant D | 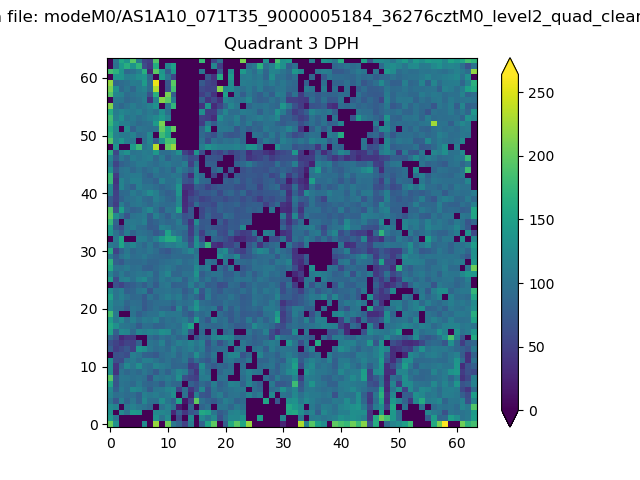 |
 |
Quadrant C |
| Plot type | Count rate plots | Images |
|---|---|---|
| Comparison with Poisson distribution Blue bars denote a histogram of data divided into 1 sec bins. Red curve is a Poisson curve with rate = median count rate of data. |
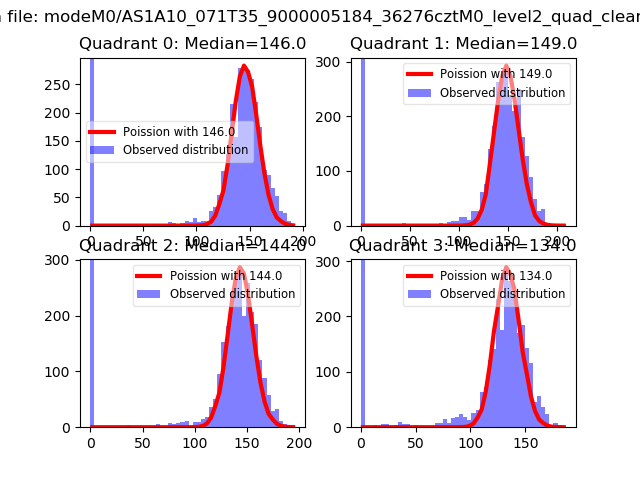 |
 |
| Quadrant-wise count rates Data is divided into 100 sec bins |
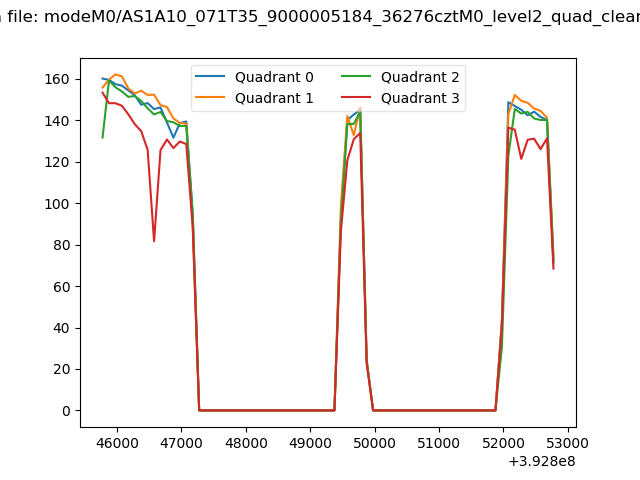 |
|
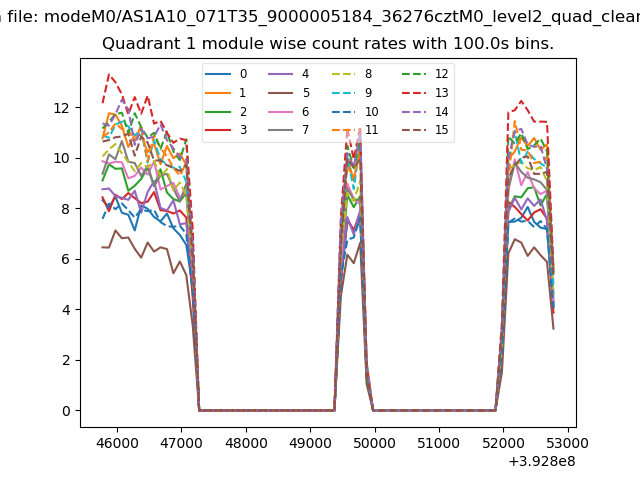
| Module-wise count rates for Quadrant A Data is divided into 100 sec bins |
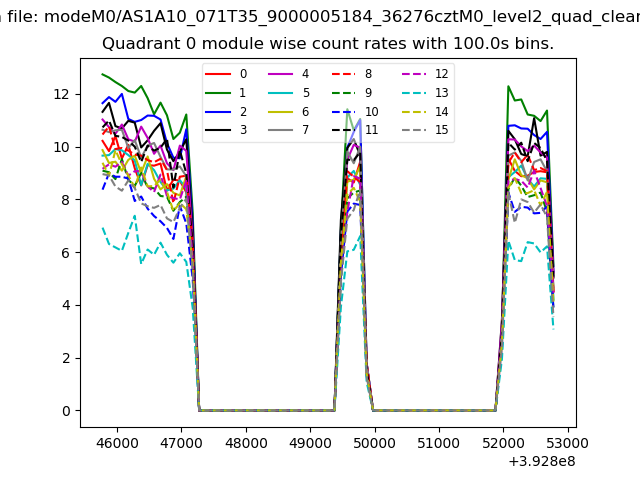 |
 |
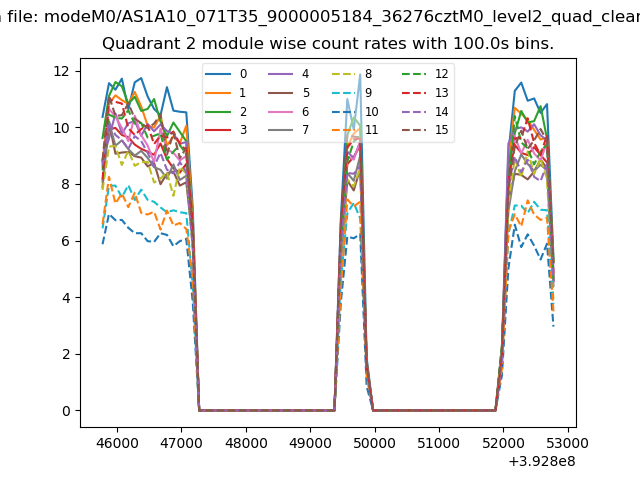
| Module-wise count rates for Quadrant B Data is divided into 100 sec bins |
 |
 |
| Module-wise count rates for Quadrant C Data is divided into 100 sec bins |
 |
 |
| Module-wise count rates for Quadrant D Data is divided into 100 sec bins |
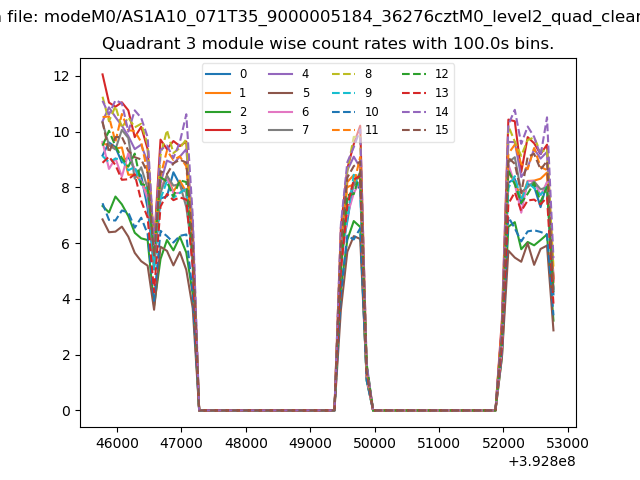 |
 |
| Parameter | Plot |
|---|---|
| CZT HV Monitor | 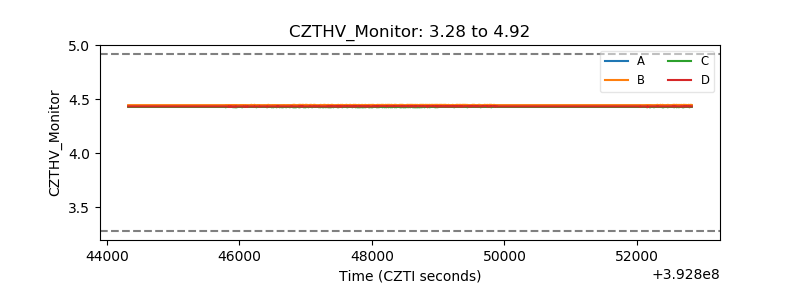 |
| D_VDD | 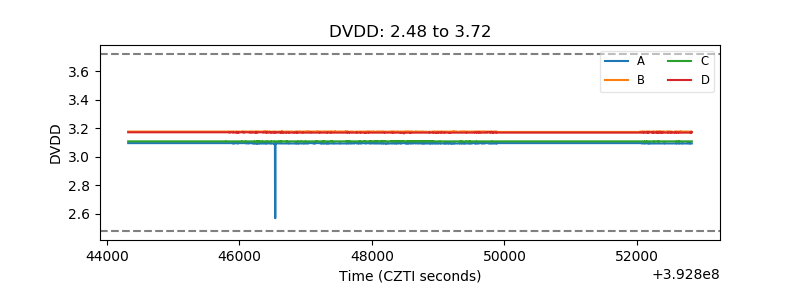 |
| Temperature 1 | 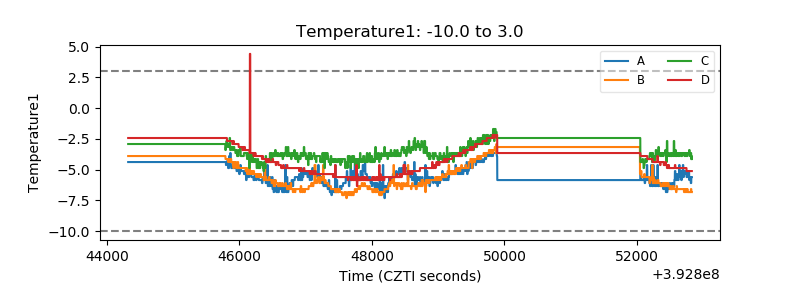 |
| Veto HV Monitor | 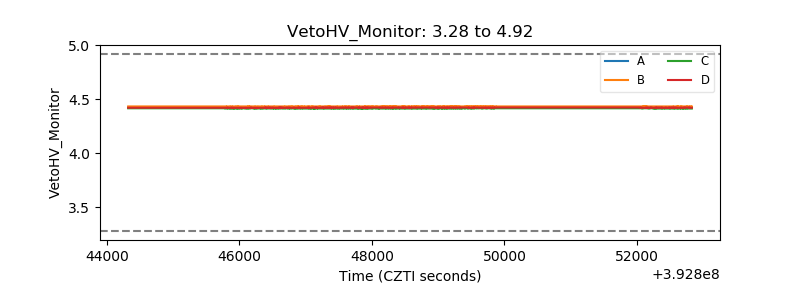 |
| Veto LLD | 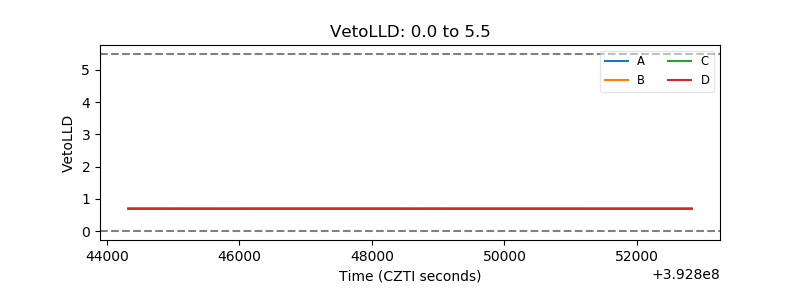 |
| Alpha Counter | 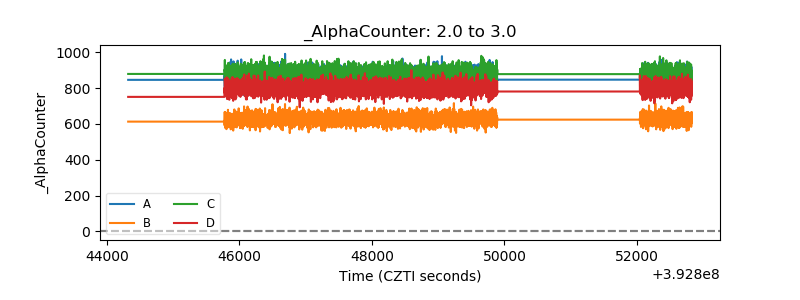 |
| _CPM_Rate | 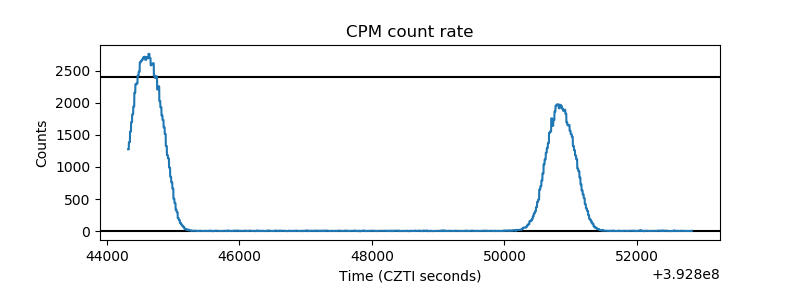 |
| CZT Counter | 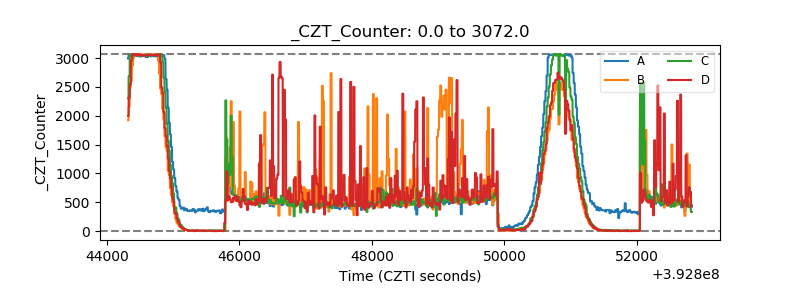 |
| +2.5 Volts monitor | 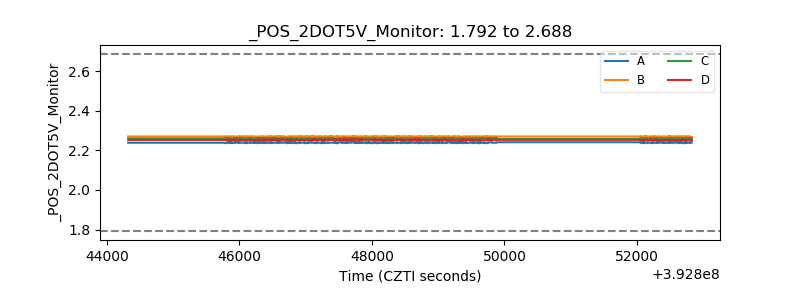 |
| +5 Volts monitor | 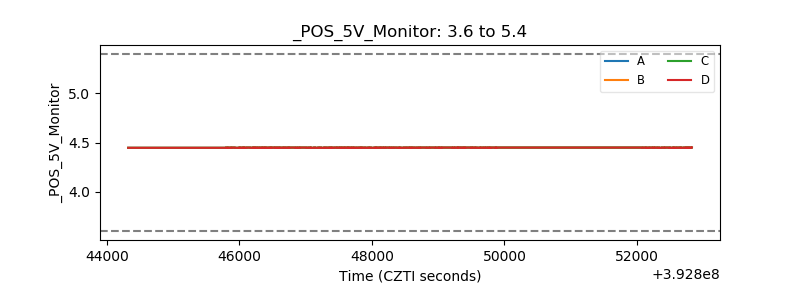 |
| _ROLL_ROT | 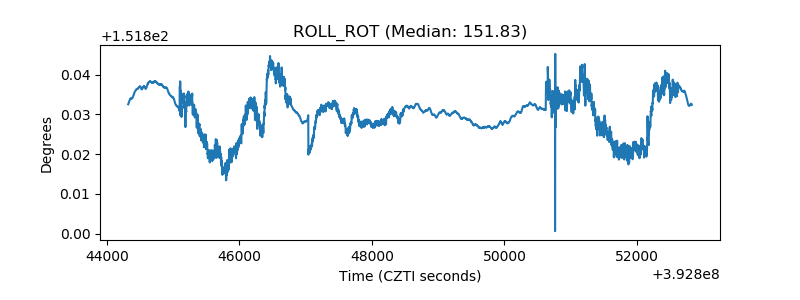 |
| _Roll_DEC | 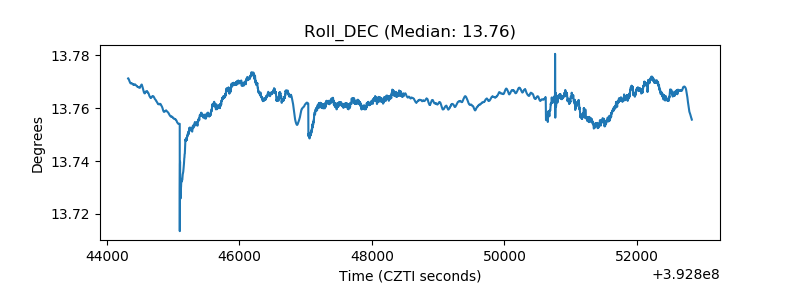 |
| _Roll_RA | 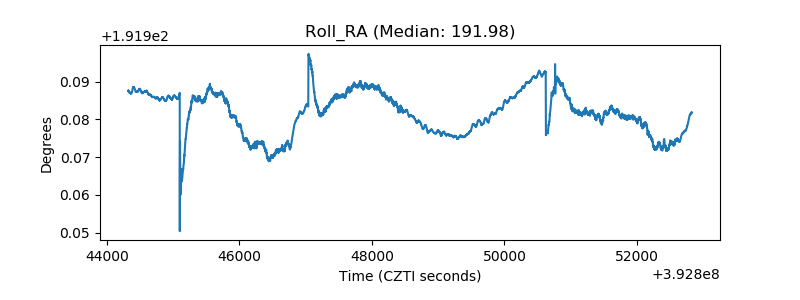 |
| Veto Counter | 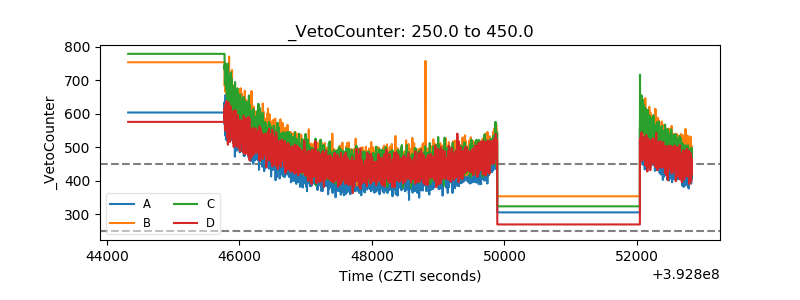 |