| Param | Original file | Final file |
|---|---|---|
| Filename | modeM0/AS1A10_071T35_9000005184_36275cztM0_level2.evt | modeM0/AS1A10_071T35_9000005184_36275cztM0_level2_quad_clean.evt |
| Size (bytes) | 456,413,760 | 60,871,680 |
| Size | 435.3 MB | 58.1 MB |
| Events in quadrant A | 2,536,683 | 391,738 |
| Events in quadrant B | 3,675,737 | 393,858 |
| Events in quadrant C | 2,764,302 | 380,801 |
| Events in quadrant D | 4,514,846 | 334,355 |
| Mode M0 | |||
|---|---|---|---|
| Quadrant | BADHDUFLAG | Total packets | Discarded packets |
| A | 0 | 10475 | 3 |
| B | 0 | 14083 | 2 |
| C | 0 | 10991 | 2 |
| D | 0 | 16566 | 2 |
| Mode SS | |||
|---|---|---|---|
| Quadrant | BADHDUFLAG | Total packets | Discarded packets |
| A | 0 | 100 | 0 |
| B | 0 | 100 | 0 |
| C | 0 | 100 | 0 |
| D | 0 | 100 | 0 |
| Mode M9 | |||
|---|---|---|---|
| Quadrant | BADHDUFLAG | Total packets | Discarded packets |
| A | 0 | 33 | 0 |
| B | 0 | 33 | 0 |
| C | 0 | 33 | 0 |
| D | 0 | 34 | 0 |
| Quadrant | Total seconds | Saturated seconds | Saturation percentage |
|---|---|---|---|
| A | 4873 | 5 | 0.102606% |
| B | 4873 | 348 | 7.141391% |
| C | 4873 | 86 | 1.764827% |
| D | 4873 | 513 | 10.527396% |
Noise dominated data is calculated using 1-second bins in cleaned event files. If a bin has >2000 counts, and if more than 50% of those come from <1% of pixels, then it is considered to be noise-dominated and hence unusable.
| Quadrant | # 1 sec bins | Bins with >0 counts | Bins with >2000 counts | High rate bins dominated by noise | Noise dominated (total time) | Noise dominated (detector-on time) | Marked lightcurve |
|---|---|---|---|---|---|---|---|
| A | 6966 | 4874 | 3 | 3 | 0.04% | 0.06% | 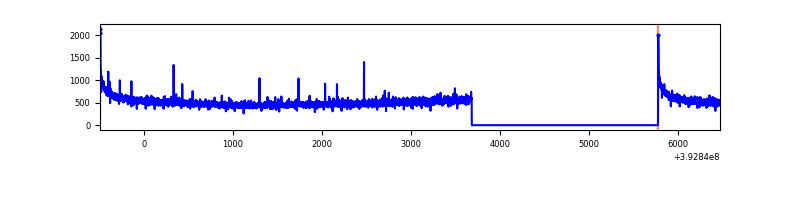 |
| B | 6966 | 4874 | 267 | 267 | 3.83% | 5.48% | 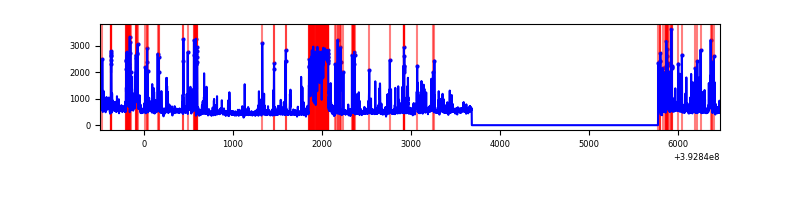 |
| C | 6966 | 4874 | 83 | 83 | 1.19% | 1.70% | 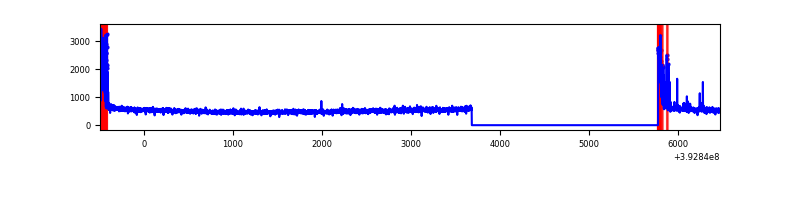 |
| D | 6966 | 4874 | 528 | 528 | 7.58% | 10.83% | 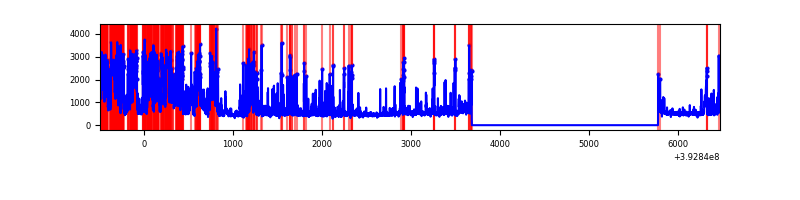 |
Top three noisy pixels from each quadrant. If the there are fewer than three noisy pixels in the level2.evt file, extra rows are filled as -1
| Pixel properties | Quadrant properties | ||||||
|---|---|---|---|---|---|---|---|
| Quadrant | DetID | PixID | Counts | Sigma | Mean | Median | Sigma |
| A | 10 | 83 | 173859 | 1425.56 | 603 | 593 | 121.5 |
| A | 13 | 6 | 16999 | 134.98 | 603 | 593 | 121.5 |
| A | 13 | 254 | 8156 | 62.22 | 603 | 593 | 121.5 |
| B | 5 | 172 | 818568 | 7394.8 | 588 | 573 | 110.6 |
| B | 5 | 236 | 387135 | 3494.58 | 588 | 573 | 110.6 |
| B | 0 | 213 | 61947 | 554.83 | 588 | 573 | 110.6 |
| C | 0 | 10 | 277230 | 2032.45 | 584 | 590 | 136.1 |
| C | 15 | 214 | 206023 | 1509.3 | 584 | 590 | 136.1 |
| C | 13 | 61 | 3995 | 25.02 | 584 | 590 | 136.1 |
| D | 12 | 227 | 1320483 | 9608.2 | 560 | 547 | 137.4 |
| D | 12 | 6 | 648479 | 4716.49 | 560 | 547 | 137.4 |
| D | 13 | 249 | 99193 | 718.07 | 560 | 547 | 137.4 |
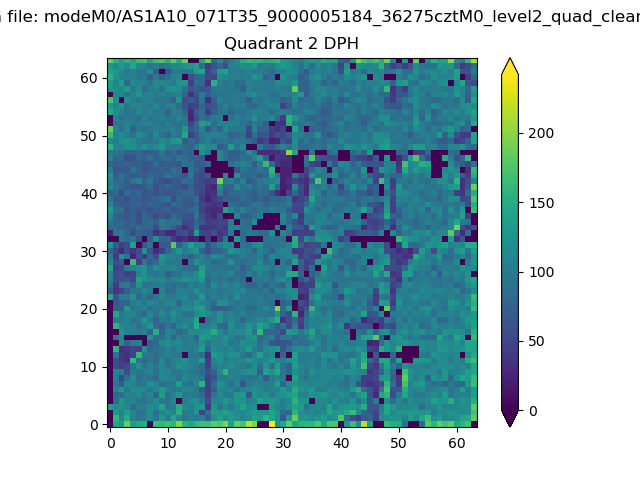
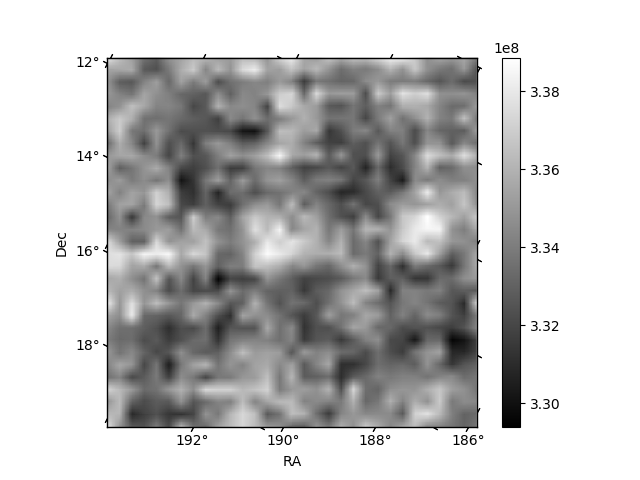
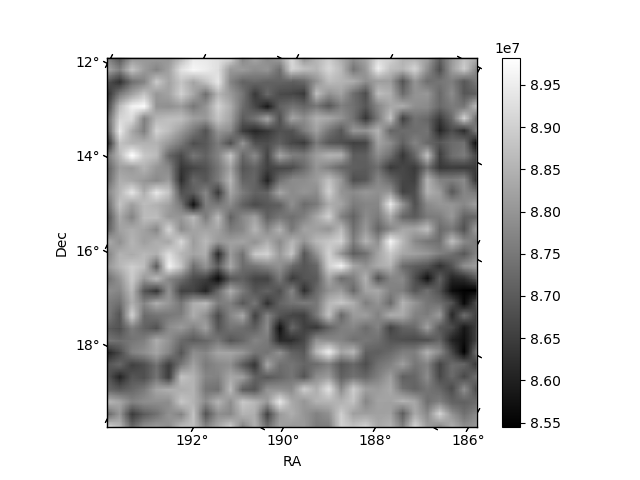
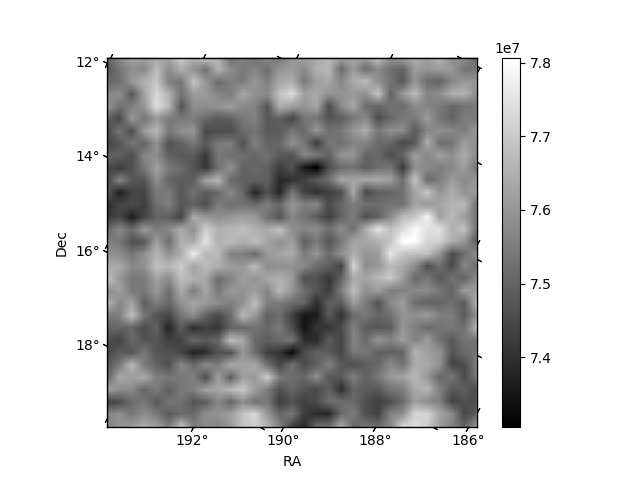
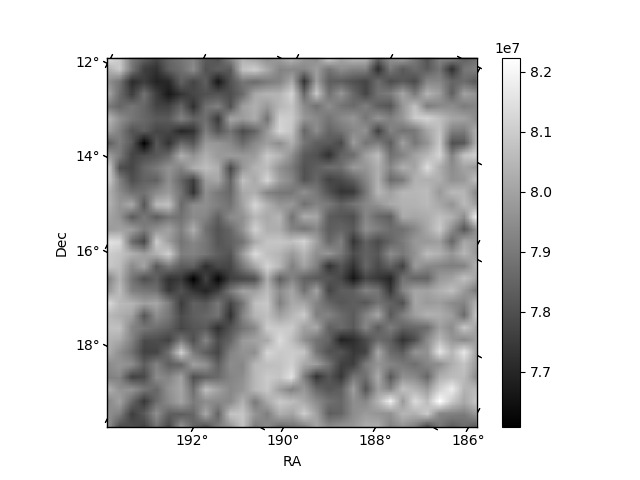
Histogram calculated using DETX and DETY for each event in the final _common_clean file
| Quadrant A | 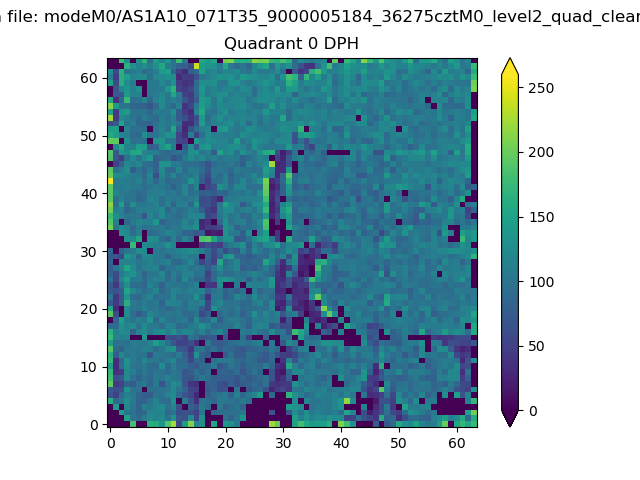 |
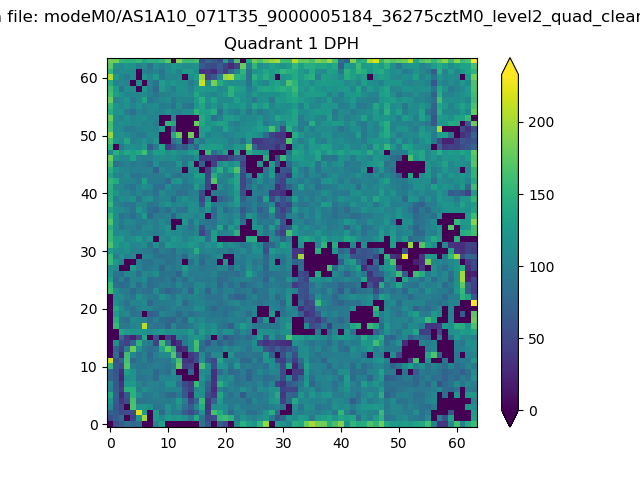 |
Quadrant B |
|---|---|---|---|
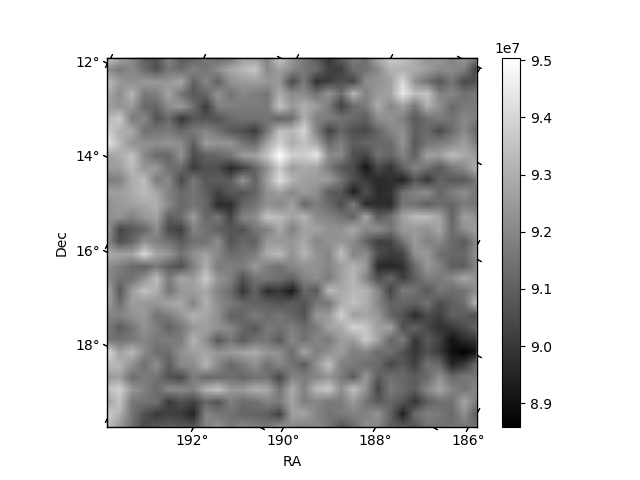
| Quadrant D | 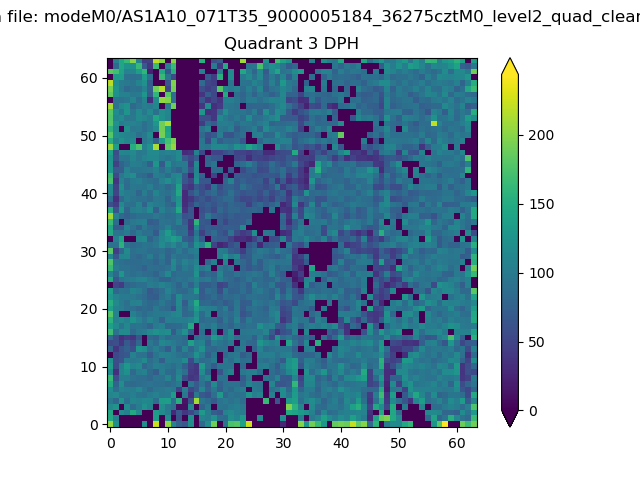 |
 |
Quadrant C |
| Plot type | Count rate plots | Images |
|---|---|---|
| Comparison with Poisson distribution Blue bars denote a histogram of data divided into 1 sec bins. Red curve is a Poisson curve with rate = median count rate of data. |
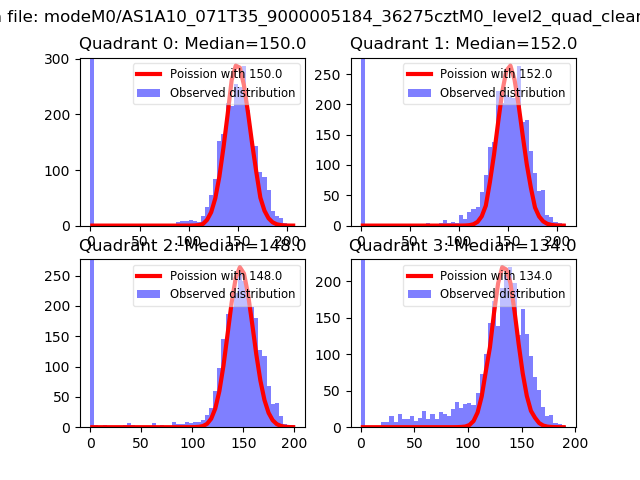 |
 |
| Quadrant-wise count rates Data is divided into 100 sec bins |
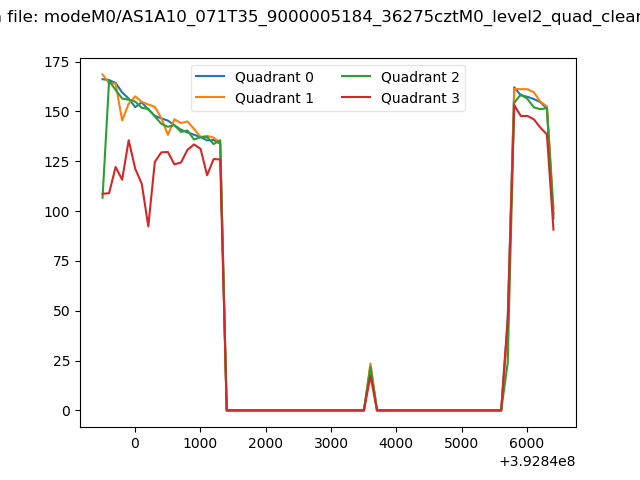 |
|
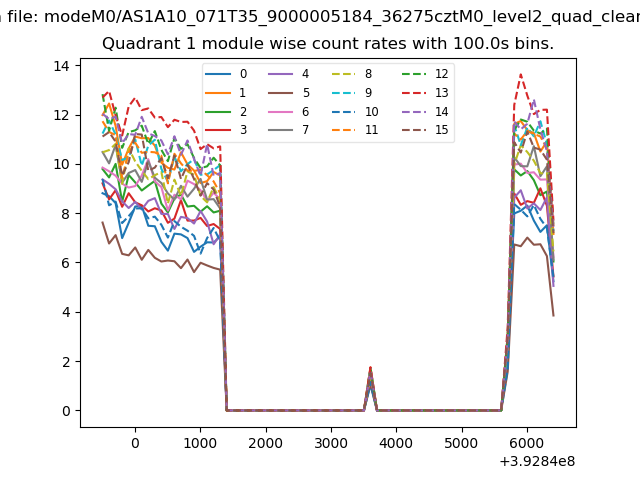
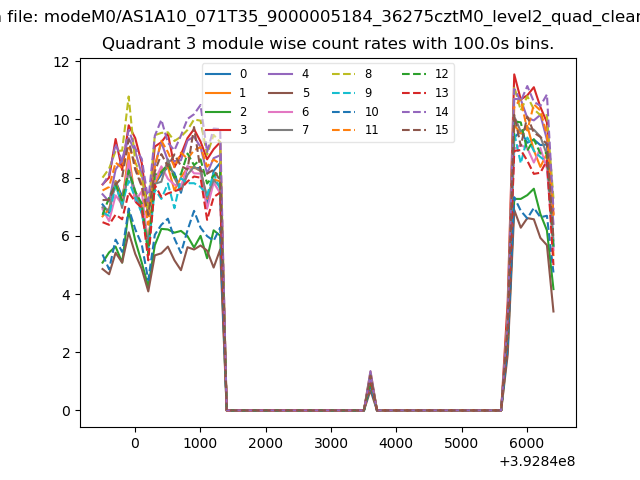
| Module-wise count rates for Quadrant A Data is divided into 100 sec bins |
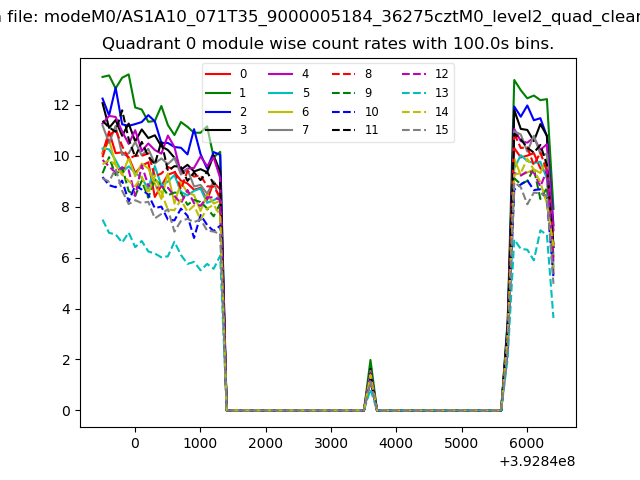 |
 |
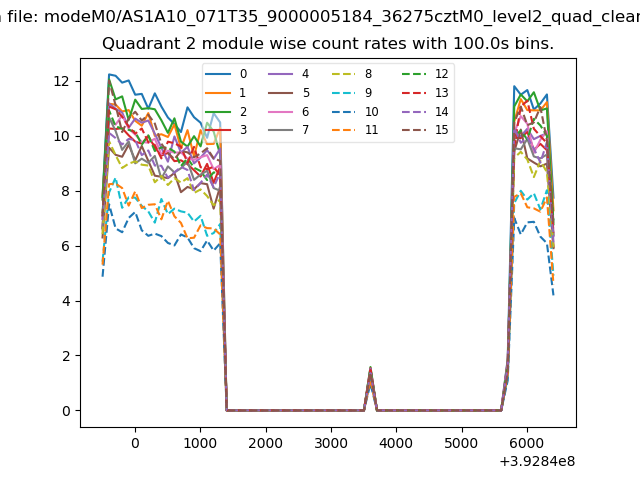
| Module-wise count rates for Quadrant B Data is divided into 100 sec bins |
 |
 |
| Module-wise count rates for Quadrant C Data is divided into 100 sec bins |
 |
 |
| Module-wise count rates for Quadrant D Data is divided into 100 sec bins |
 |
 |
| Parameter | Plot |
|---|---|
| CZT HV Monitor | 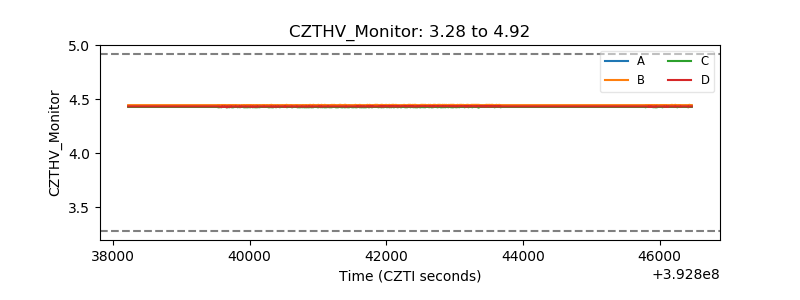 |
| D_VDD | 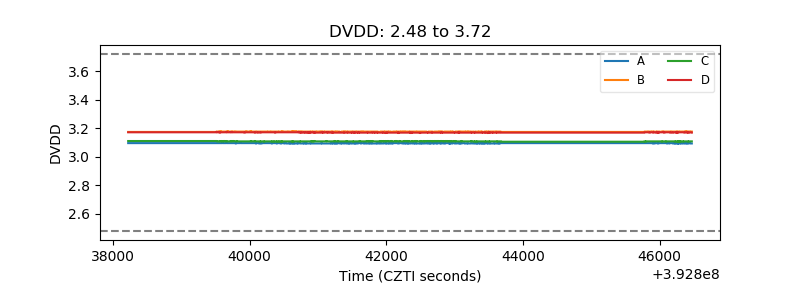 |
| Temperature 1 | 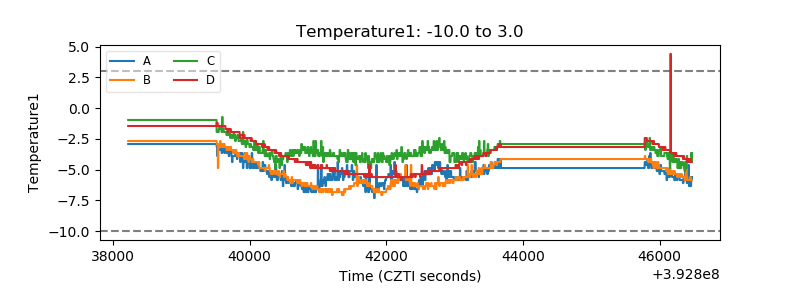 |
| Veto HV Monitor | 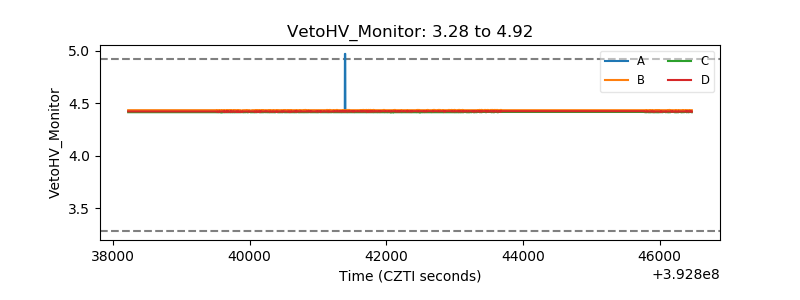 |
| Veto LLD | 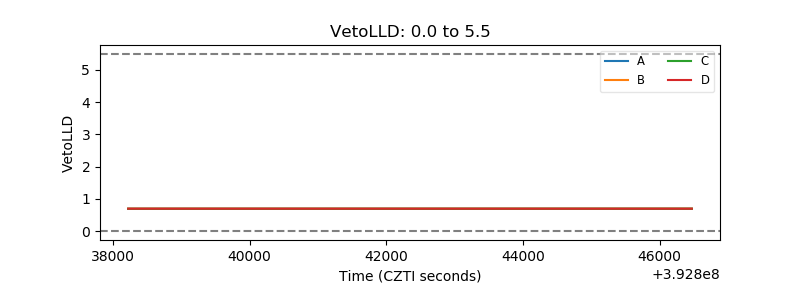 |
| Alpha Counter | 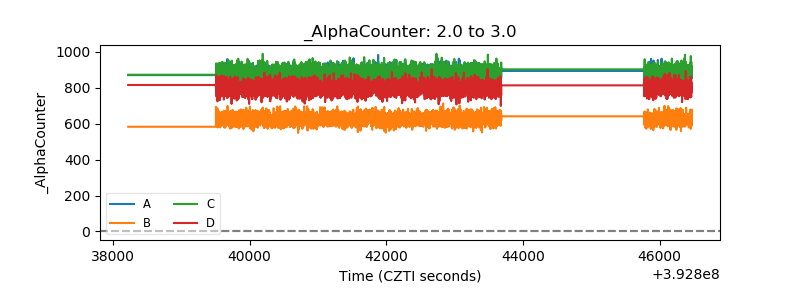 |
| _CPM_Rate | 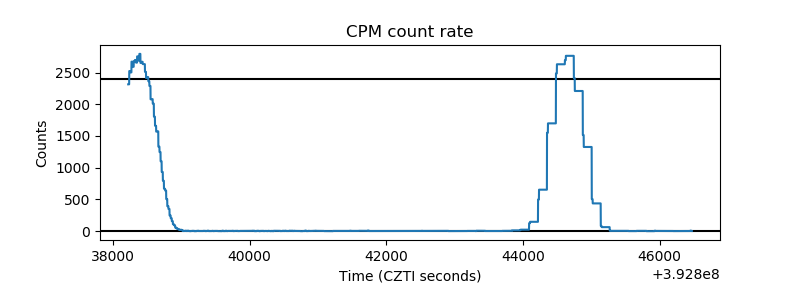 |
| CZT Counter | 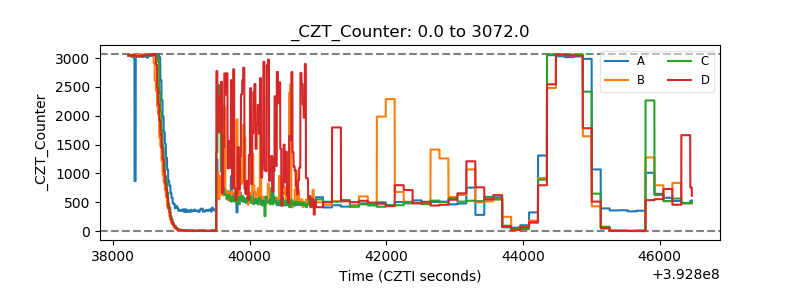 |
| +2.5 Volts monitor | 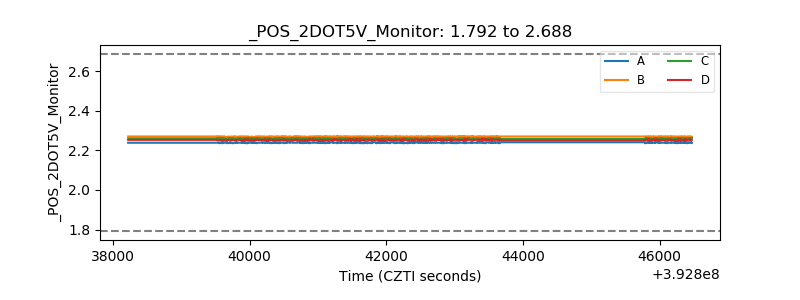 |
| +5 Volts monitor | 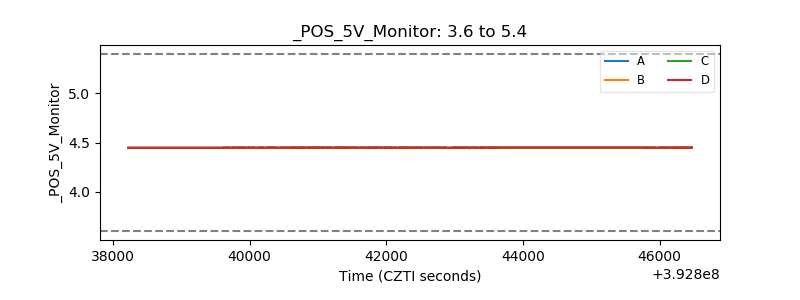 |
| _ROLL_ROT | 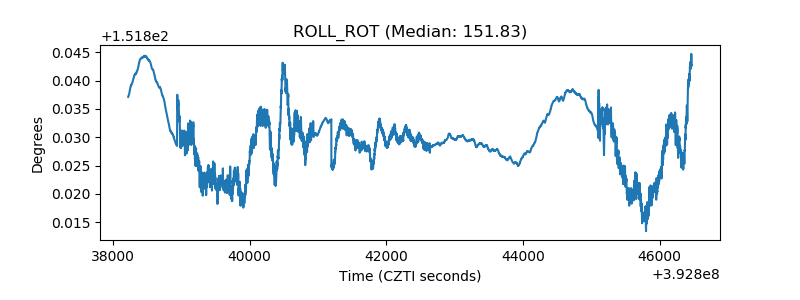 |
| _Roll_DEC | 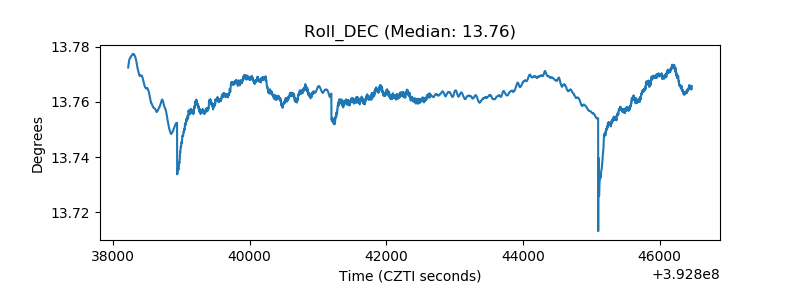 |
| _Roll_RA |  |
| Veto Counter |  |