| Param | Original file | Final file |
|---|---|---|
| Filename | modeM0/AS1A10_071T35_9000005184_36274cztM0_level2.evt | modeM0/AS1A10_071T35_9000005184_36274cztM0_level2_quad_clean.evt |
| Size (bytes) | 442,336,320 | 71,043,840 |
| Size | 421.8 MB | 67.8 MB |
| Events in quadrant A | 2,645,847 | 464,691 |
| Events in quadrant B | 3,501,935 | 462,938 |
| Events in quadrant C | 2,850,136 | 454,503 |
| Events in quadrant D | 4,048,866 | 408,262 |
| Mode M0 | |||
|---|---|---|---|
| Quadrant | BADHDUFLAG | Total packets | Discarded packets |
| A | 0 | 10994 | 3 |
| B | 0 | 13720 | 2 |
| C | 0 | 11416 | 2 |
| D | 0 | 15420 | 2 |
| Mode SS | |||
|---|---|---|---|
| Quadrant | BADHDUFLAG | Total packets | Discarded packets |
| A | 0 | 106 | 0 |
| B | 0 | 106 | 0 |
| C | 0 | 106 | 0 |
| D | 0 | 106 | 0 |
| Mode M9 | |||
|---|---|---|---|
| Quadrant | BADHDUFLAG | Total packets | Discarded packets |
| A | 0 | 22 | 0 |
| B | 0 | 22 | 0 |
| C | 0 | 22 | 0 |
| D | 0 | 23 | 0 |
| Quadrant | Total seconds | Saturated seconds | Saturation percentage |
|---|---|---|---|
| A | 5143 | 7 | 0.136107% |
| B | 5143 | 208 | 4.044332% |
| C | 5143 | 86 | 1.672176% |
| D | 5143 | 425 | 8.263659% |
Noise dominated data is calculated using 1-second bins in cleaned event files. If a bin has >2000 counts, and if more than 50% of those come from <1% of pixels, then it is considered to be noise-dominated and hence unusable.
| Quadrant | # 1 sec bins | Bins with >0 counts | Bins with >2000 counts | High rate bins dominated by noise | Noise dominated (total time) | Noise dominated (detector-on time) | Marked lightcurve |
|---|---|---|---|---|---|---|---|
| A | 7116 | 5144 | 3 | 3 | 0.04% | 0.06% | 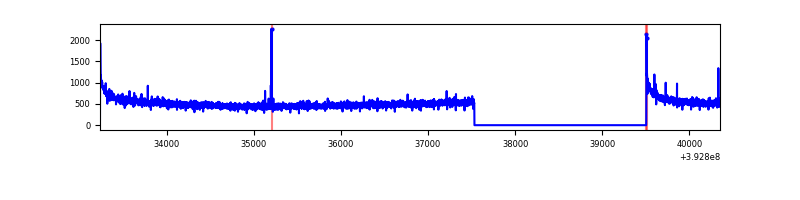 |
| B | 7116 | 5143 | 148 | 148 | 2.08% | 2.88% | 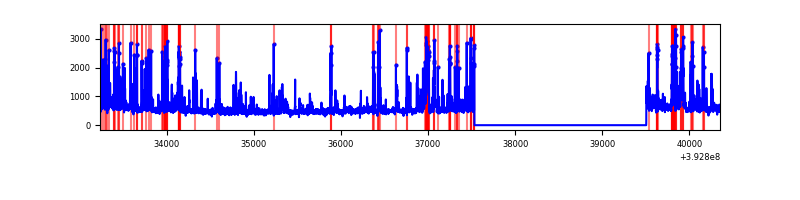 |
| C | 7116 | 5144 | 76 | 76 | 1.07% | 1.48% | 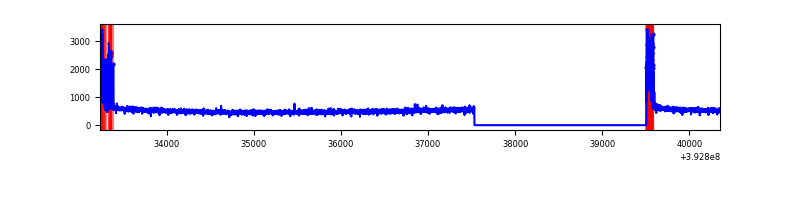 |
| D | 7116 | 5144 | 434 | 434 | 6.10% | 8.44% | 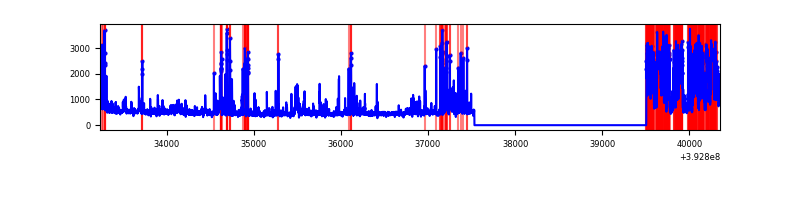 |
Top three noisy pixels from each quadrant. If the there are fewer than three noisy pixels in the level2.evt file, extra rows are filled as -1
| Pixel properties | Quadrant properties | ||||||
|---|---|---|---|---|---|---|---|
| Quadrant | DetID | PixID | Counts | Sigma | Mean | Median | Sigma |
| A | 10 | 83 | 181653 | 1419.4 | 630 | 618 | 127.5 |
| A | 13 | 6 | 15825 | 119.23 | 630 | 618 | 127.5 |
| A | 13 | 254 | 9189 | 67.2 | 630 | 618 | 127.5 |
| B | 5 | 172 | 431562 | 3668.51 | 619 | 602 | 117.5 |
| B | 5 | 236 | 384944 | 3271.68 | 619 | 602 | 117.5 |
| B | 8 | 128 | 78883 | 666.36 | 619 | 602 | 117.5 |
| C | 0 | 10 | 257121 | 1814.34 | 609 | 613 | 141.4 |
| C | 15 | 214 | 214564 | 1513.32 | 609 | 613 | 141.4 |
| C | 13 | 61 | 4244 | 25.68 | 609 | 613 | 141.4 |
| D | 12 | 227 | 1229211 | 8578.54 | 589 | 573 | 143.2 |
| D | 12 | 6 | 219118 | 1525.92 | 589 | 573 | 143.2 |
| D | 2 | 153 | 100106 | 694.95 | 589 | 573 | 143.2 |
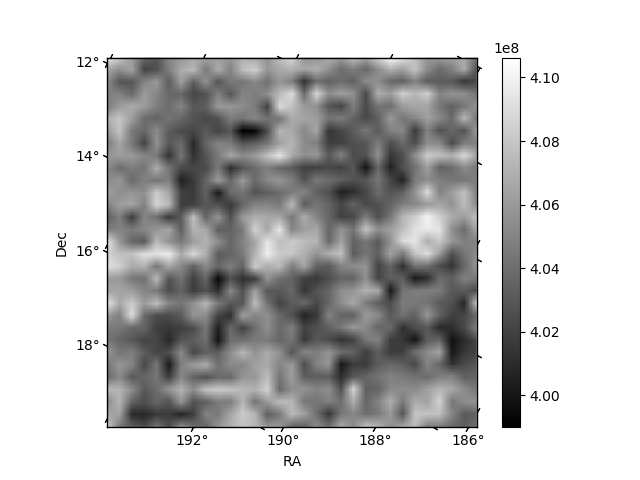
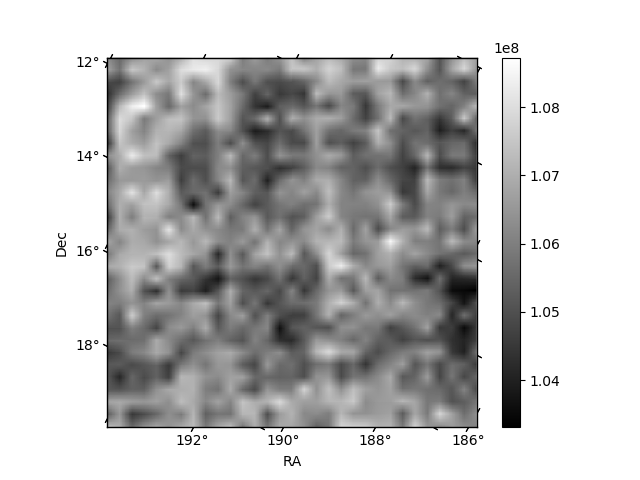
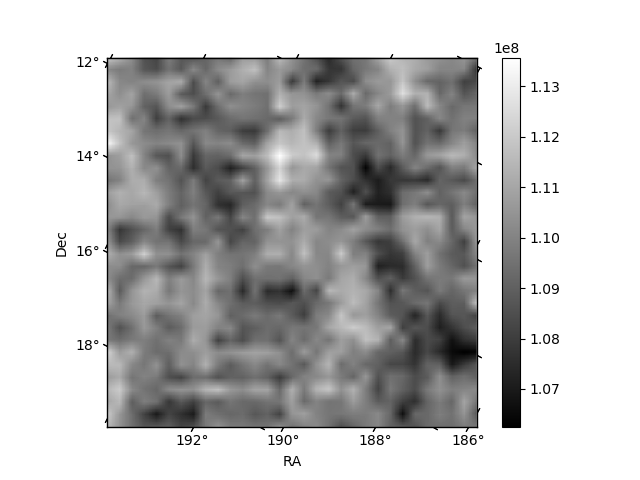
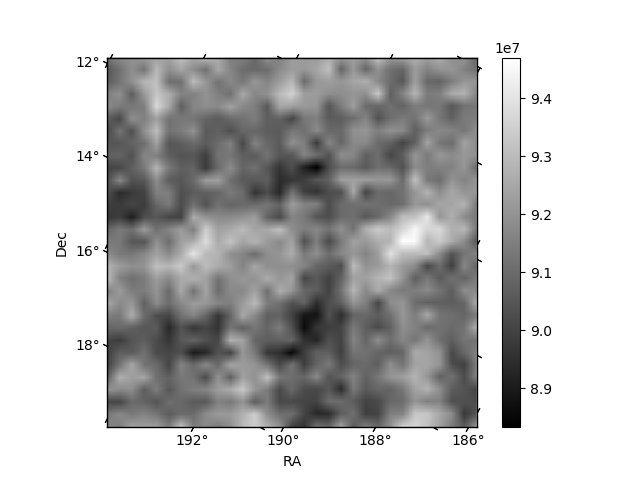
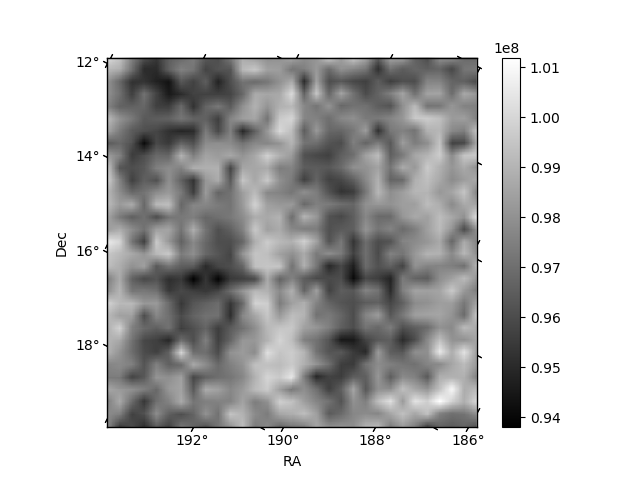
Histogram calculated using DETX and DETY for each event in the final _common_clean file
| Quadrant A | 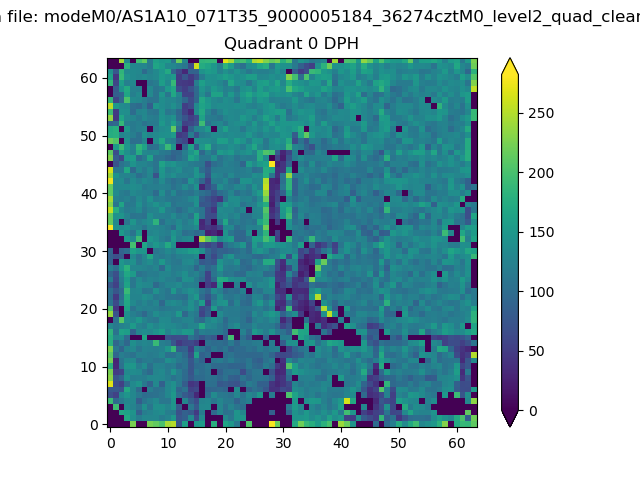 |
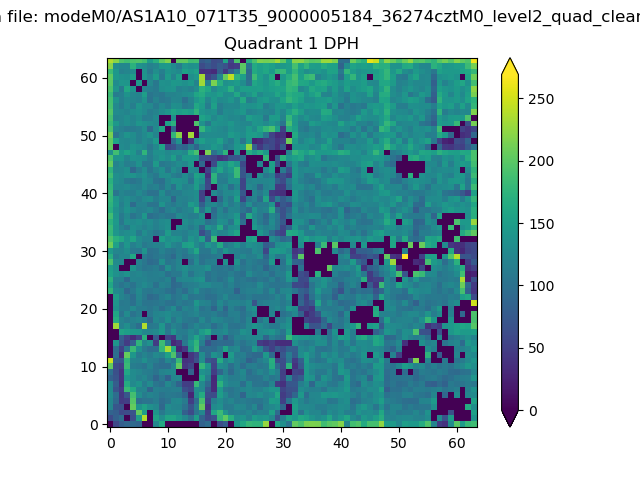 |
Quadrant B |
|---|---|---|---|
| Quadrant D | 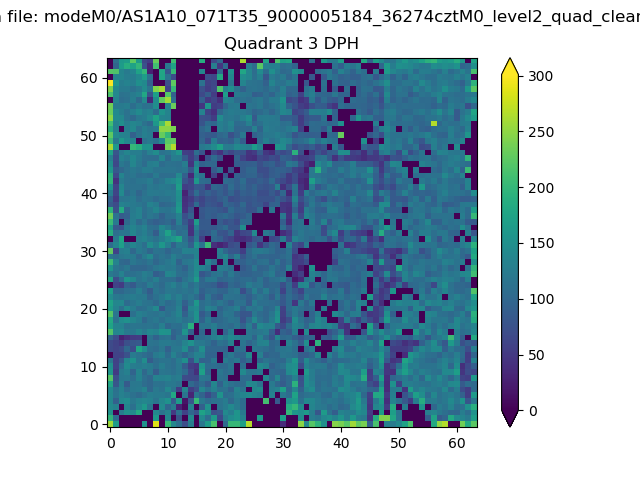 |
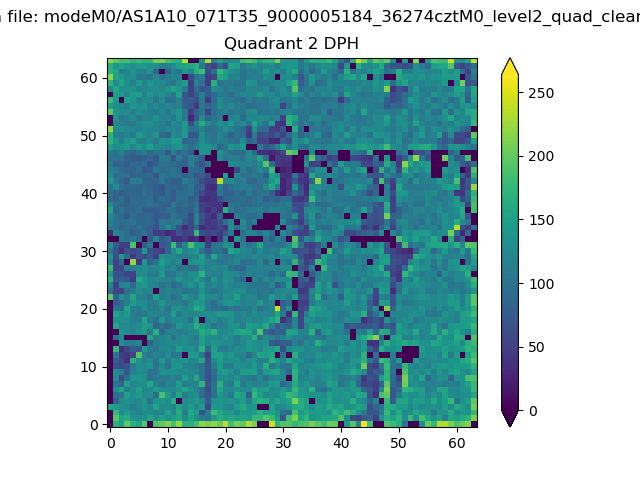 |
Quadrant C |
| Plot type | Count rate plots | Images |
|---|---|---|
| Comparison with Poisson distribution Blue bars denote a histogram of data divided into 1 sec bins. Red curve is a Poisson curve with rate = median count rate of data. |
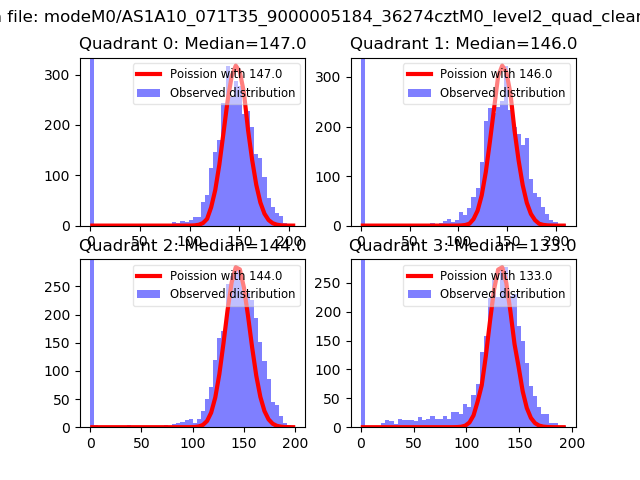 |
 |
| Quadrant-wise count rates Data is divided into 100 sec bins |
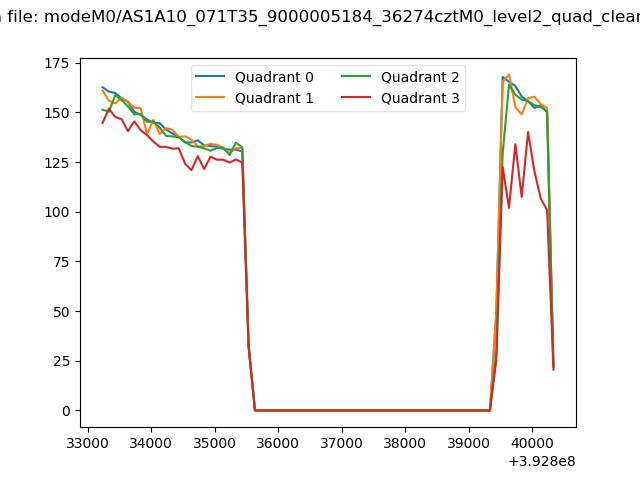 |
|
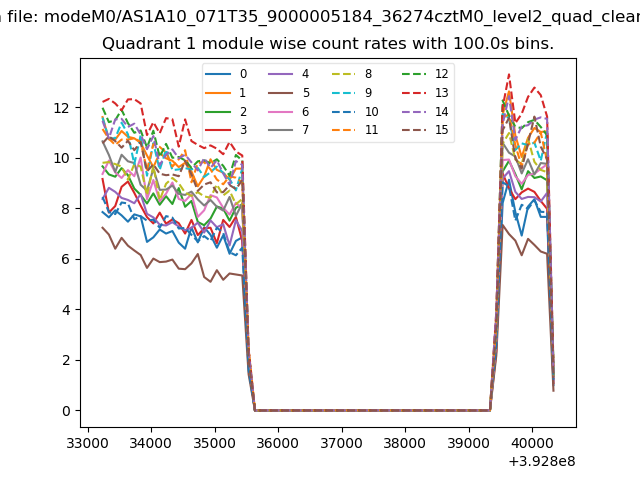
| Module-wise count rates for Quadrant A Data is divided into 100 sec bins |
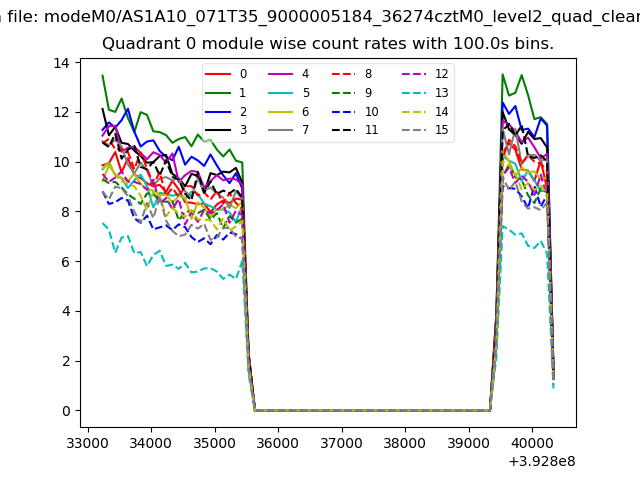 |
 |
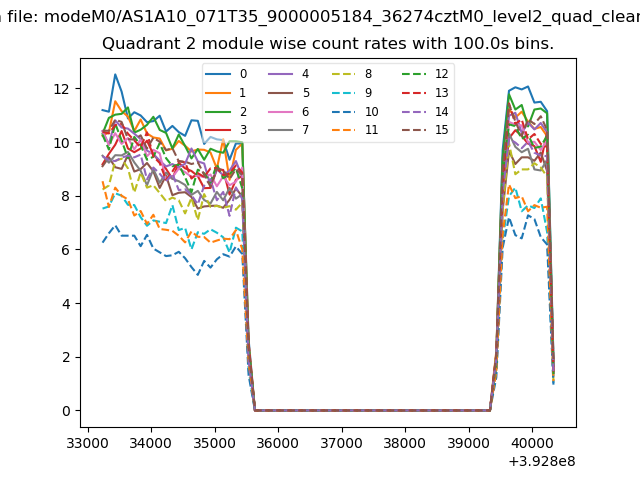
| Module-wise count rates for Quadrant B Data is divided into 100 sec bins |
 |
 |
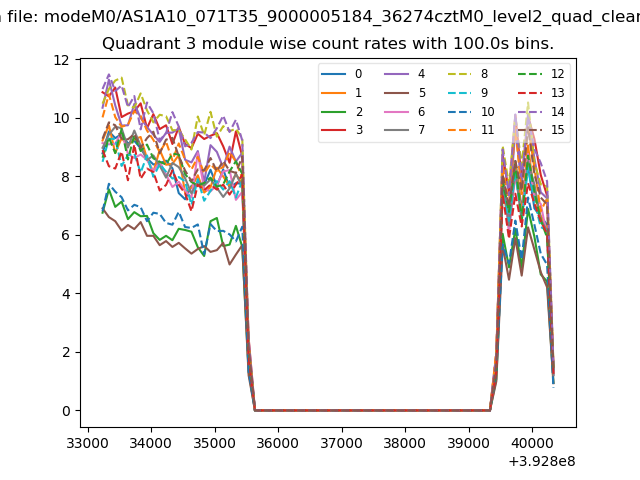
| Module-wise count rates for Quadrant C Data is divided into 100 sec bins |
 |
 |
| Module-wise count rates for Quadrant D Data is divided into 100 sec bins |
 |
 |
| Parameter | Plot |
|---|---|
| CZT HV Monitor | 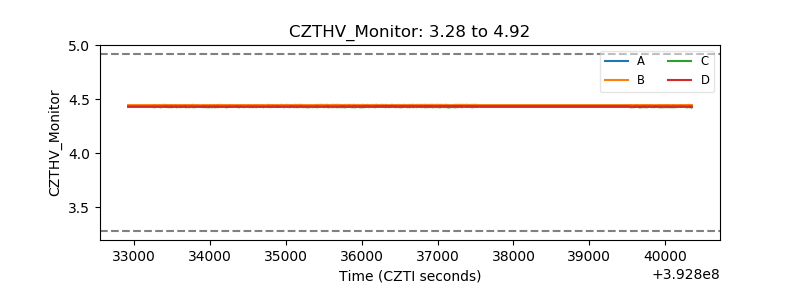 |
| D_VDD | 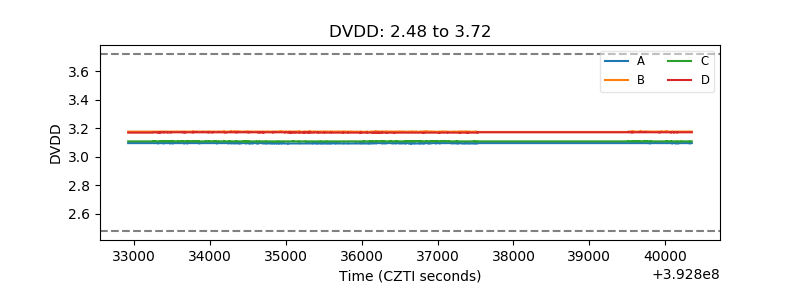 |
| Temperature 1 | 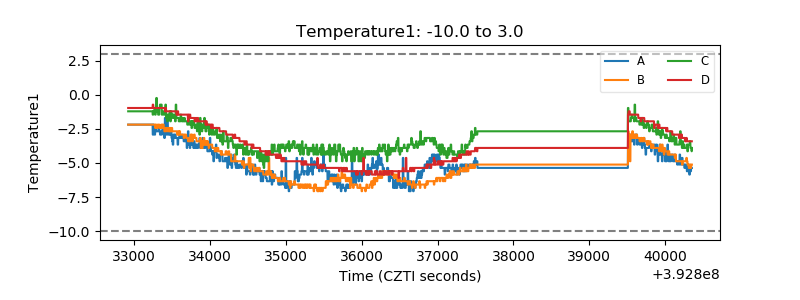 |
| Veto HV Monitor | 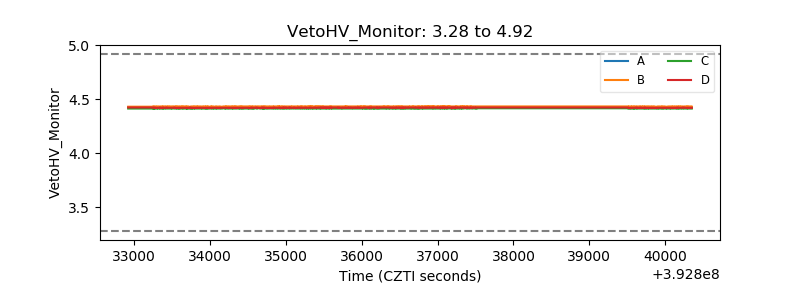 |
| Veto LLD | 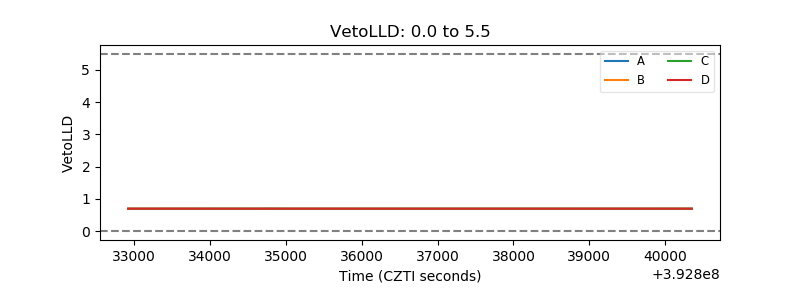 |
| Alpha Counter | 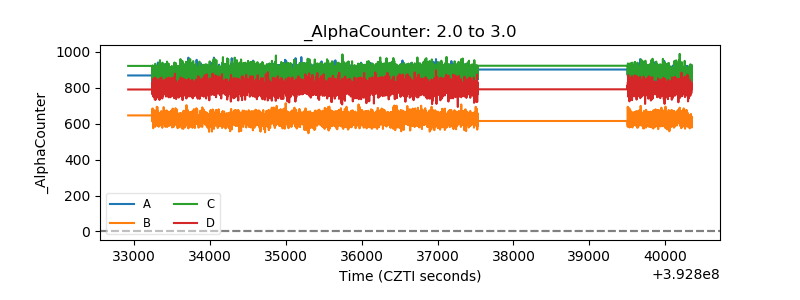 |
| _CPM_Rate | 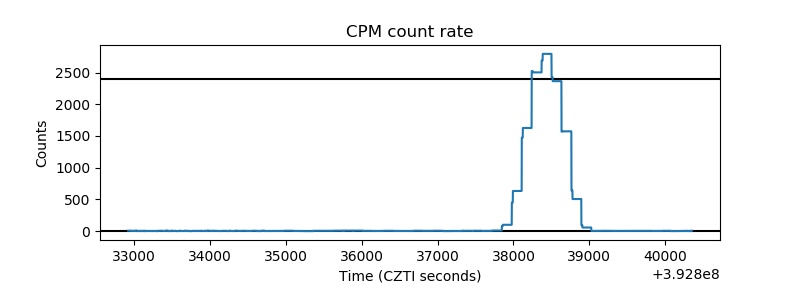 |
| CZT Counter | 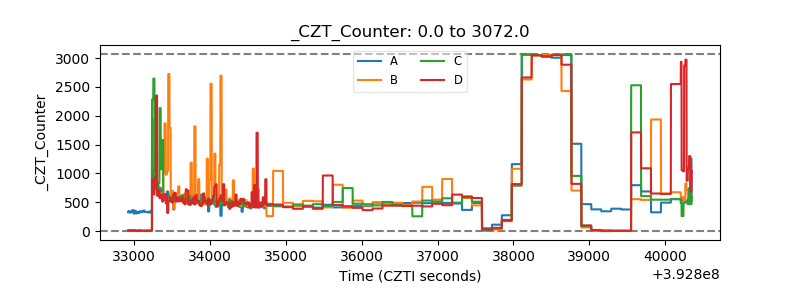 |
| +2.5 Volts monitor |  |
| +5 Volts monitor | 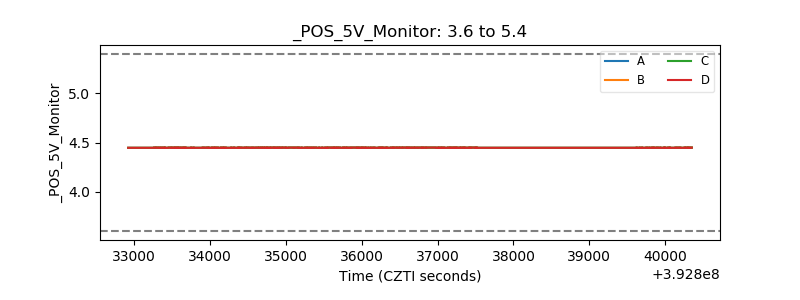 |
| _ROLL_ROT | 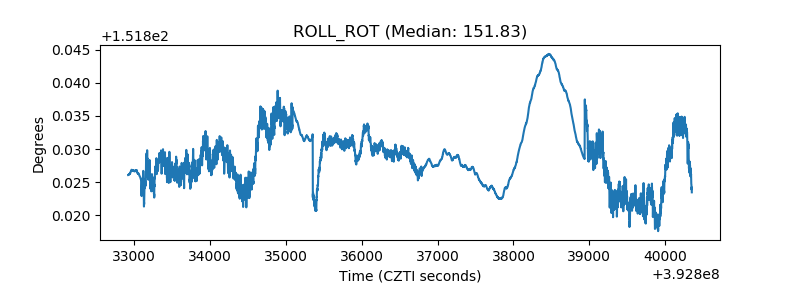 |
| _Roll_DEC | 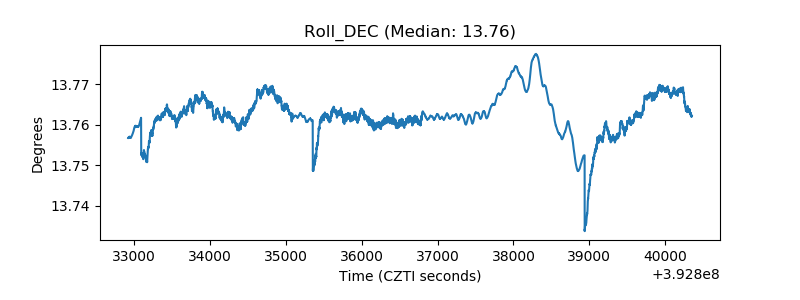 |
| _Roll_RA | 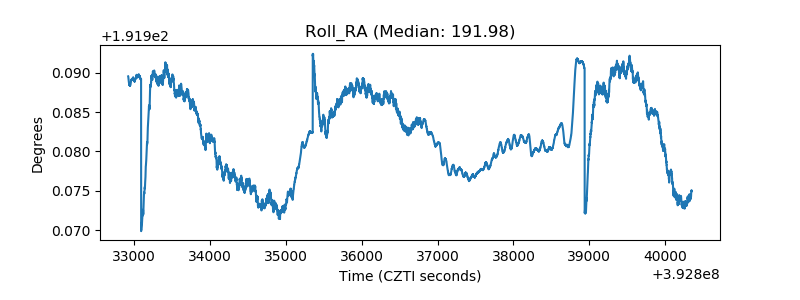 |
| Veto Counter | 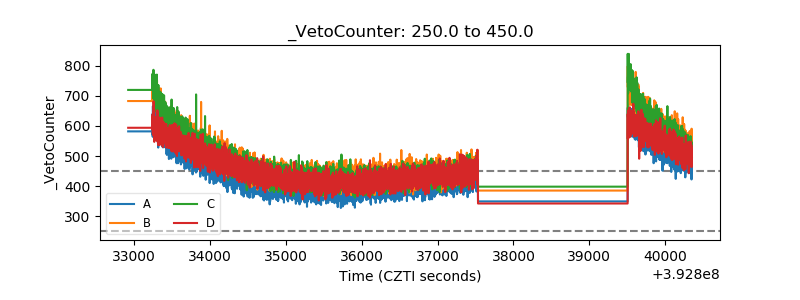 |