| Param | Original file | Final file |
|---|---|---|
| Filename | modeM0/AS1A10_071T35_9000005184cztM0_level2_bc.evt | modeM0/AS1A10_071T35_9000005184cztM0_level2_quad_clean.evt |
| Size (bytes) | 2,591,470,080 | 669,888,000 |
| Size | 2.4 GB | 638.9 MB |
| Events in quadrant A | 12,662,359 | 4,250,449 |
| Events in quadrant B | 17,486,620 | 4,259,789 |
| Events in quadrant C | 15,843,160 | 4,164,425 |
| Events in quadrant D | 28,732,743 | 3,826,257 |
| Mode M0 | |||
|---|---|---|---|
| Quadrant | BADHDUFLAG | Total packets | Discarded packets |
| A | 0 | 114015 | 0 |
| B | 0 | 135325 | 0 |
| C | 0 | 122465 | 0 |
| D | 0 | 177875 | 0 |
| Mode SS | |||
|---|---|---|---|
| Quadrant | BADHDUFLAG | Total packets | Discarded packets |
| A | 0 | 1128 | 0 |
| B | 0 | 1128 | 0 |
| C | 0 | 1128 | 0 |
| D | 0 | 1128 | 0 |
| Mode M9 | |||
|---|---|---|---|
| Quadrant | BADHDUFLAG | Total packets | Discarded packets |
| A | 0 | 207 | 0 |
| B | 0 | 207 | 0 |
| C | 0 | 207 | 0 |
| D | 0 | 207 | 0 |
| Quadrant | Total seconds | Saturated seconds | Saturation percentage |
|---|---|---|---|
| A | 55216 | 88 | 0.159374% |
| B | 55216 | 1873 | 3.392133% |
| C | 55216 | 662 | 1.198928% |
| D | 55216 | 5627 | 10.190887% |
Noise dominated data is calculated using 1-second bins in cleaned event files. If a bin has >2000 counts, and if more than 50% of those come from <1% of pixels, then it is considered to be noise-dominated and hence unusable.
| Quadrant | # 1 sec bins | Bins with >0 counts | Bins with >2000 counts | High rate bins dominated by noise | Noise dominated (total time) | Noise dominated (detector-on time) | Marked lightcurve |
|---|---|---|---|---|---|---|---|
| A | 75859 | 55228 | 2 | 2 | 0.00% | 0.00% | 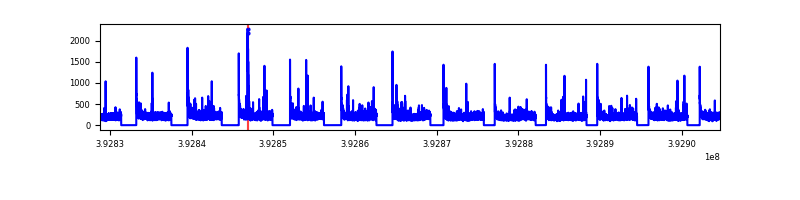 |
| B | 75859 | 55213 | 287 | 287 | 0.38% | 0.52% | 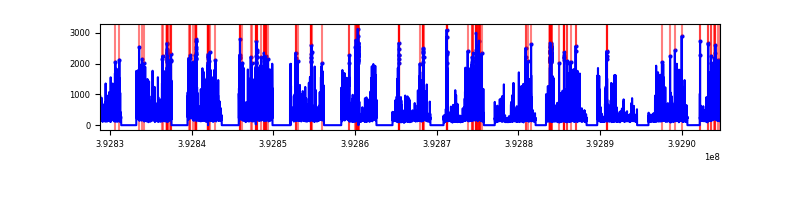 |
| C | 75859 | 55214 | 107 | 107 | 0.14% | 0.19% | 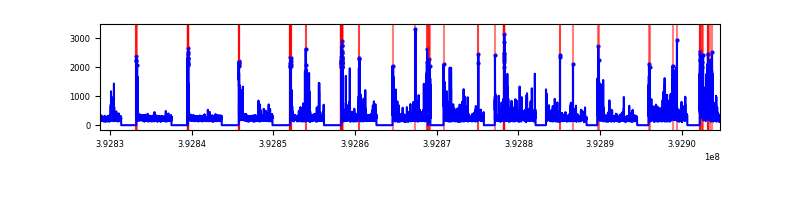 |
| D | 75859 | 55214 | 1412 | 1412 | 1.86% | 2.56% | 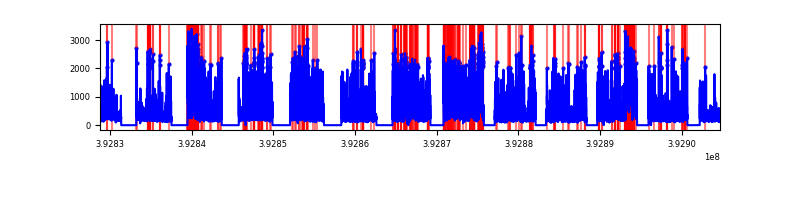 |
Top three noisy pixels from each quadrant. If the there are fewer than three noisy pixels in the level2.evt file, extra rows are filled as -1
| Pixel properties | Quadrant properties | ||||||
|---|---|---|---|---|---|---|---|
| Quadrant | DetID | PixID | Counts | Sigma | Mean | Median | Sigma |
| A | 10 | 83 | 1387125 | 2196.74 | 2829 | 2780 | 630.2 |
| A | 13 | 6 | 134362 | 208.8 | 2829 | 2780 | 630.2 |
| A | 13 | 248 | 86702 | 133.17 | 2829 | 2780 | 630.2 |
| B | 5 | 172 | 3557083 | 6342.64 | 2823 | 2758 | 560.4 |
| B | 5 | 236 | 1067061 | 1899.23 | 2823 | 2758 | 560.4 |
| B | 8 | 128 | 832090 | 1479.93 | 2823 | 2758 | 560.4 |
| C | 15 | 214 | 2163219 | 3429.97 | 2757 | 2734 | 629.9 |
| C | 0 | 10 | 1639944 | 2599.22 | 2757 | 2734 | 629.9 |
| C | 0 | 207 | 1181289 | 1871.07 | 2757 | 2734 | 629.9 |
| D | 12 | 6 | 7769039 | 12362.54 | 2652 | 2571 | 628.2 |
| D | 12 | 227 | 4969113 | 7905.66 | 2652 | 2571 | 628.2 |
| D | 13 | 249 | 1601525 | 2545.19 | 2652 | 2571 | 628.2 |
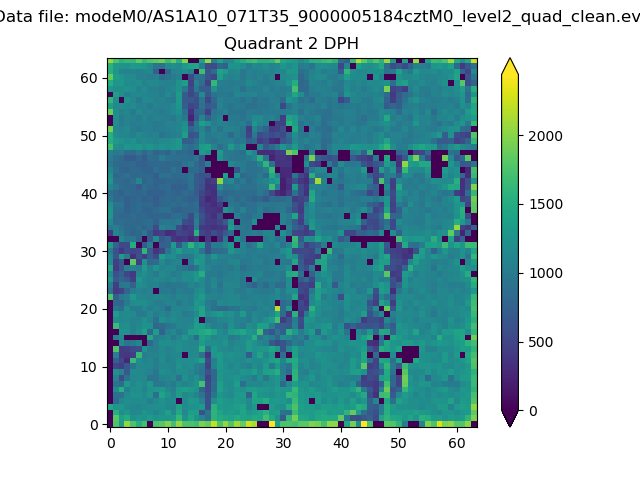
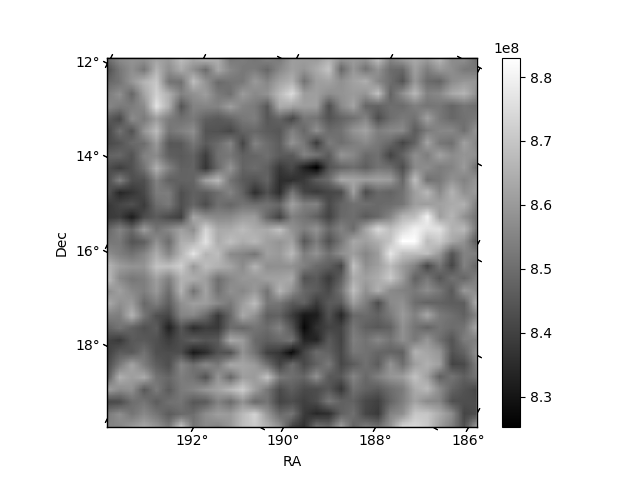
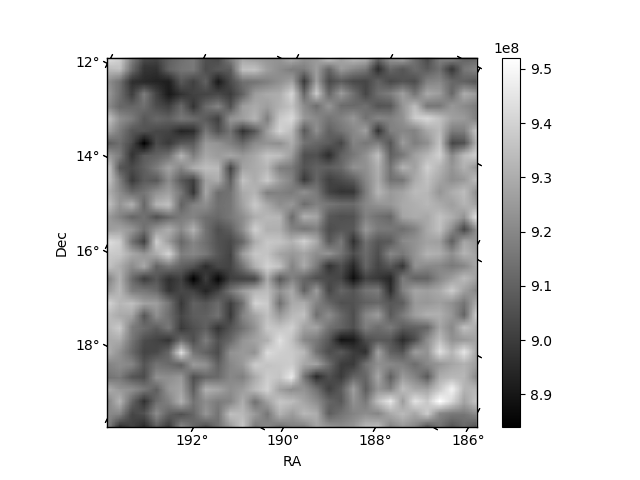
Histogram calculated using DETX and DETY for each event in the final _common_clean file
| Quadrant A | 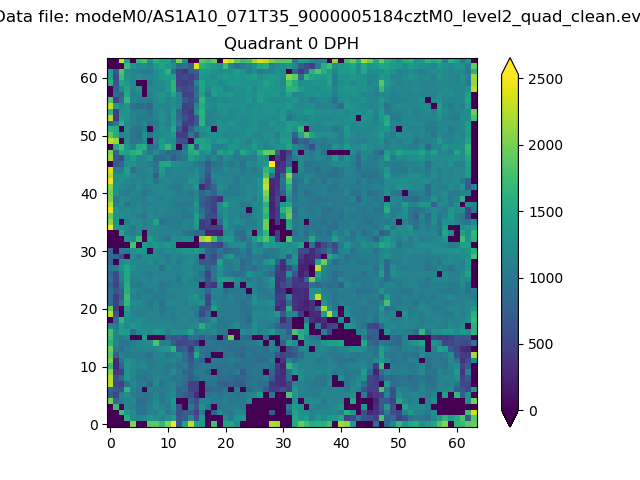 |
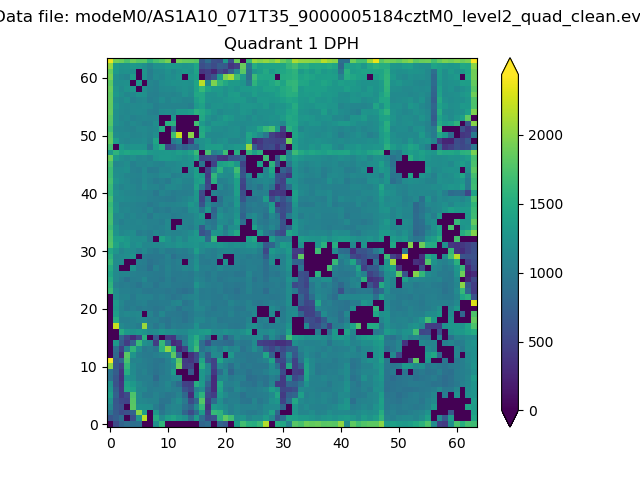 |
Quadrant B |
|---|---|---|---|
| Quadrant D | 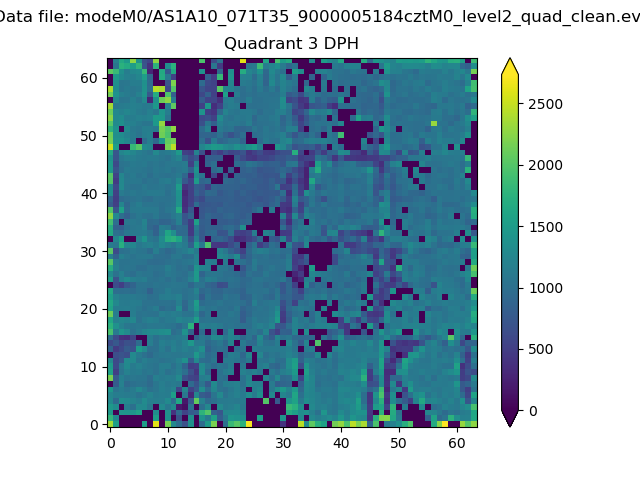 |
 |
Quadrant C |
| Plot type | Count rate plots | Images |
|---|---|---|
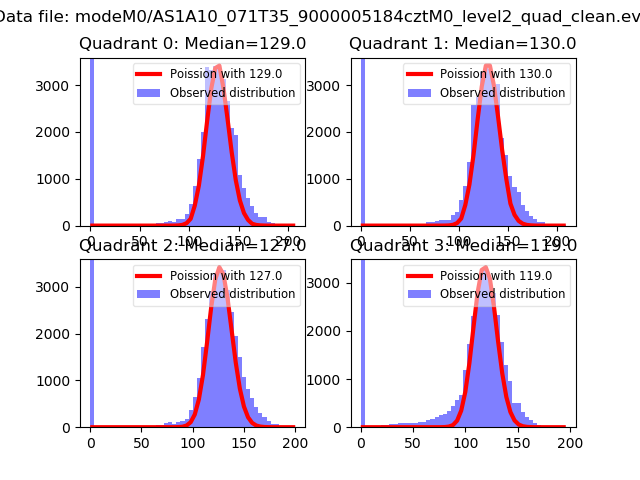
| Comparison with Poisson distribution Blue bars denote a histogram of data divided into 1 sec bins. Red curve is a Poisson curve with rate = median count rate of data. |
 |
 |
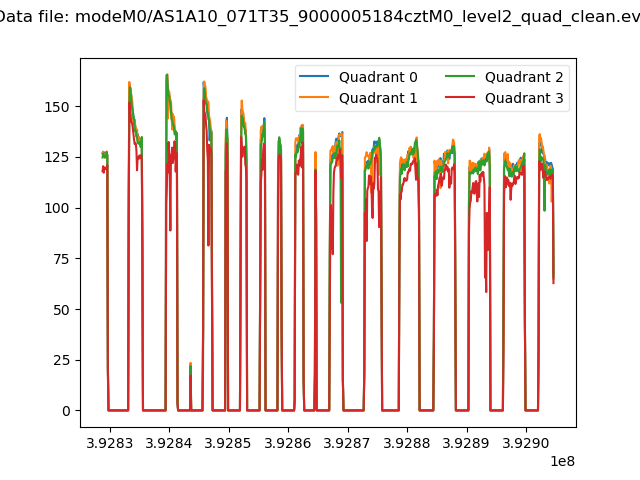
| Quadrant-wise count rates Data is divided into 100 sec bins |
 |
|
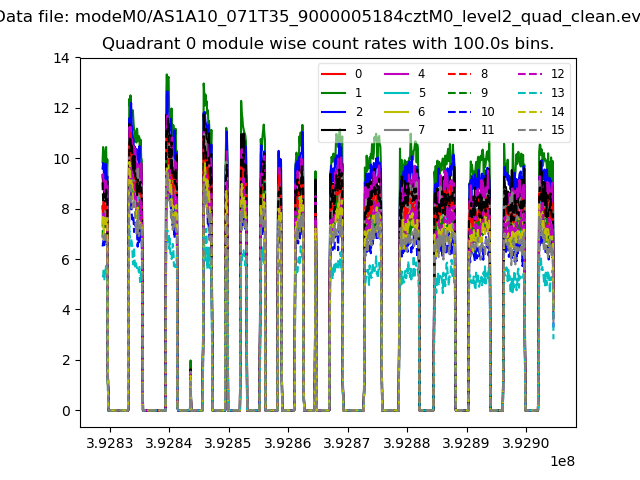
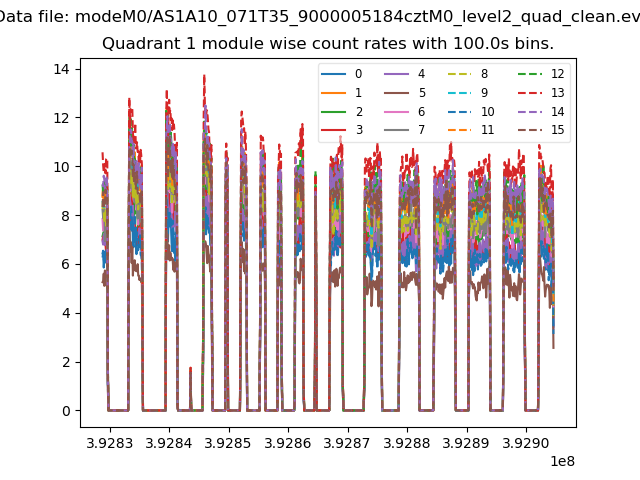
| Module-wise count rates for Quadrant A Data is divided into 100 sec bins |
 |
 |
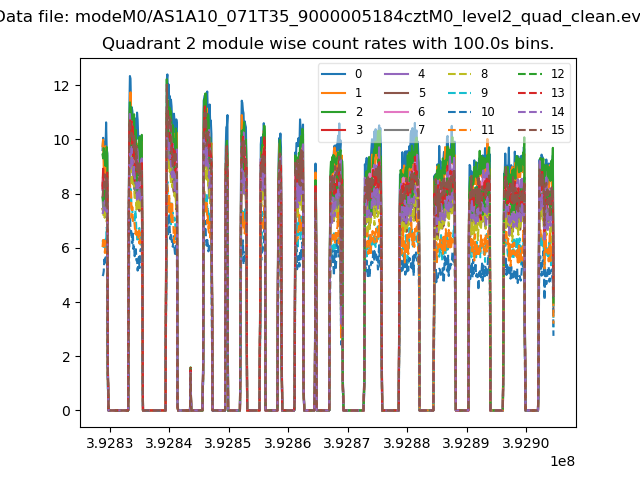
| Module-wise count rates for Quadrant B Data is divided into 100 sec bins |
 |
 |
| Module-wise count rates for Quadrant C Data is divided into 100 sec bins |
 |
 |
| Module-wise count rates for Quadrant D Data is divided into 100 sec bins |
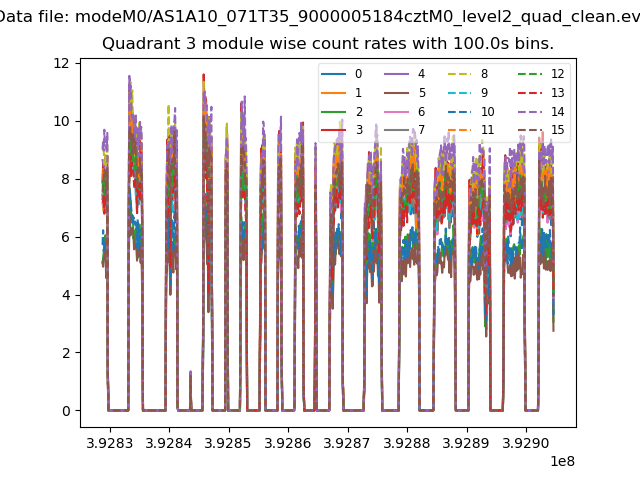 |
 |
| Parameter | Plot |
|---|---|
| CZT HV Monitor | 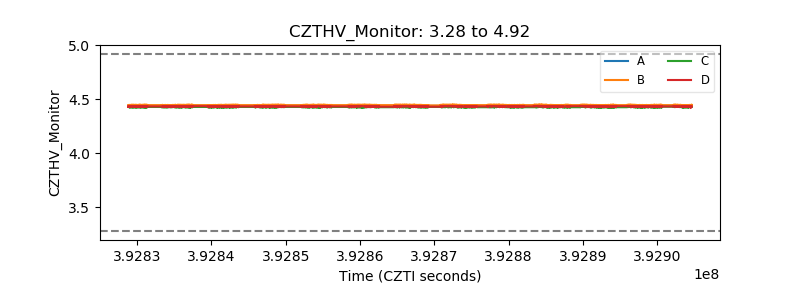 |
| D_VDD | 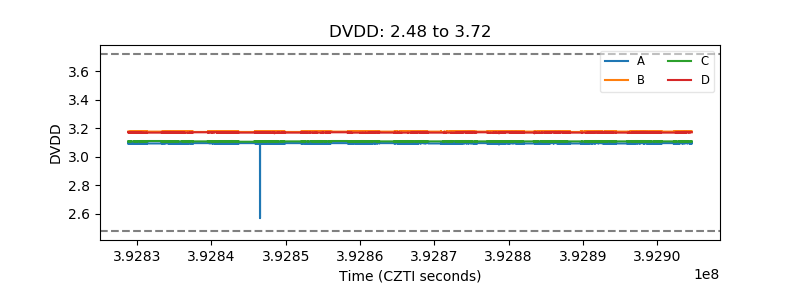 |
| Temperature 1 | 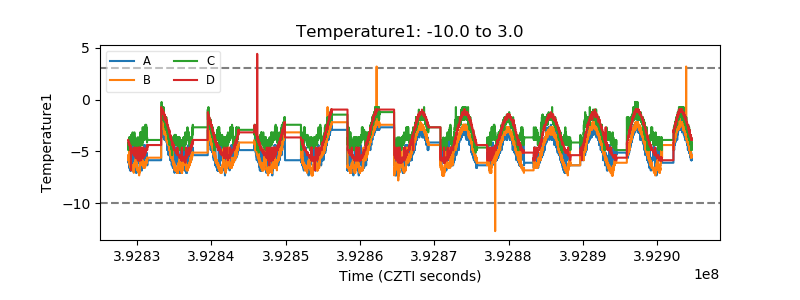 |
| Veto HV Monitor | 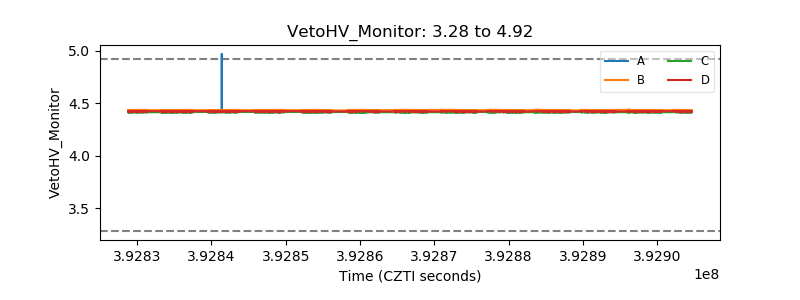 |
| Veto LLD | 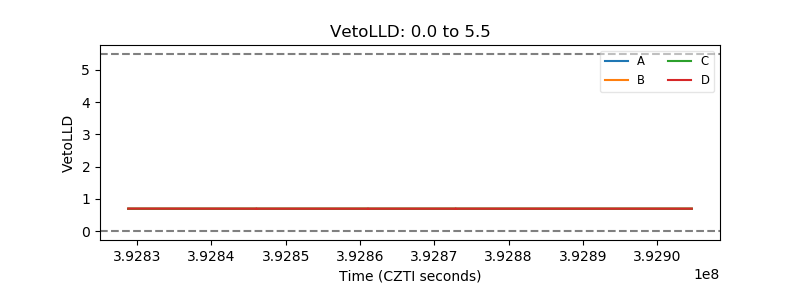 |
| Alpha Counter | 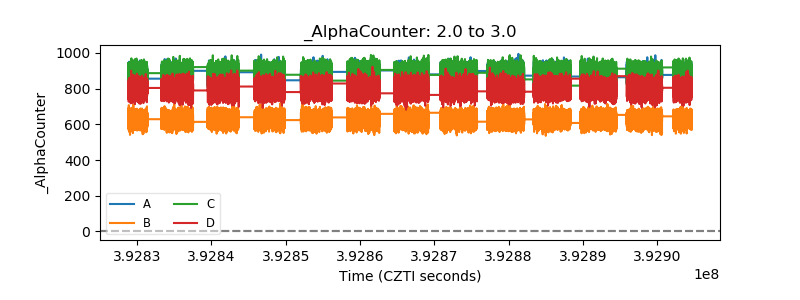 |
| _CPM_Rate | 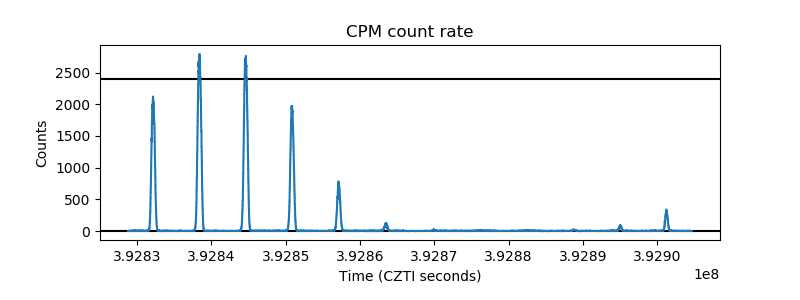 |
| CZT Counter | 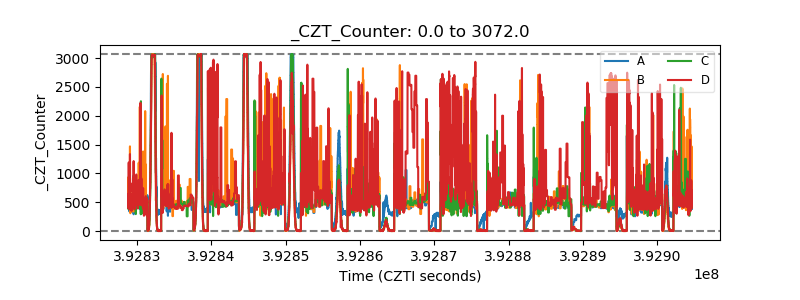 |
| +2.5 Volts monitor | 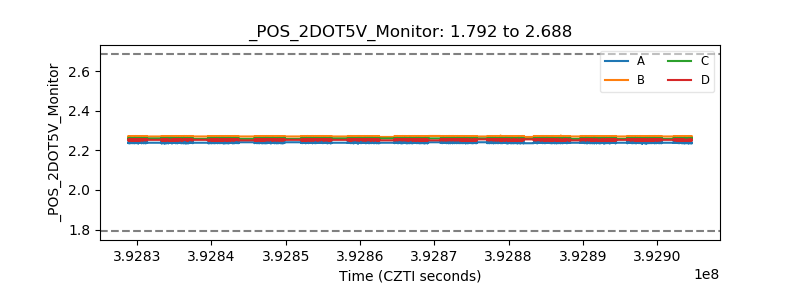 |
| +5 Volts monitor | 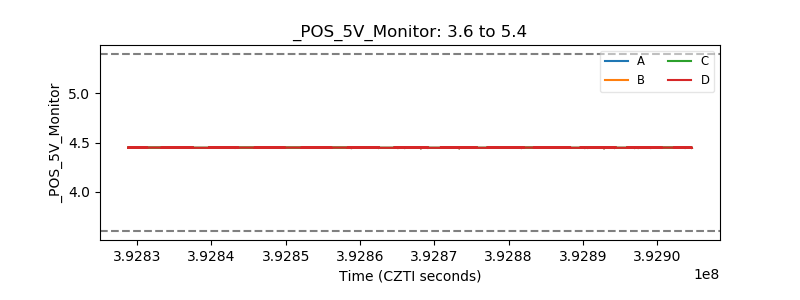 |
| _ROLL_ROT | 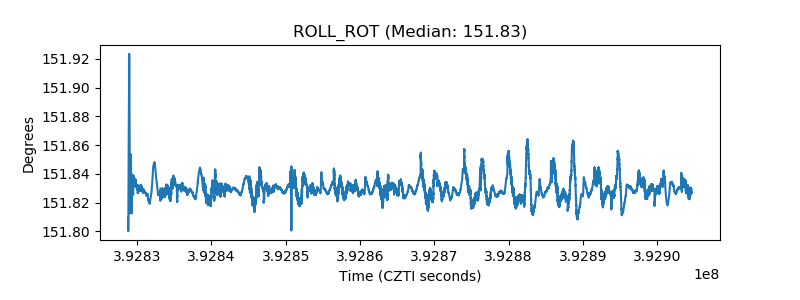 |
| _Roll_DEC | 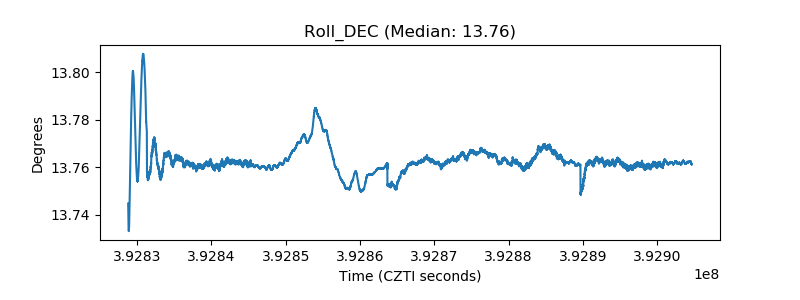 |
| _Roll_RA | 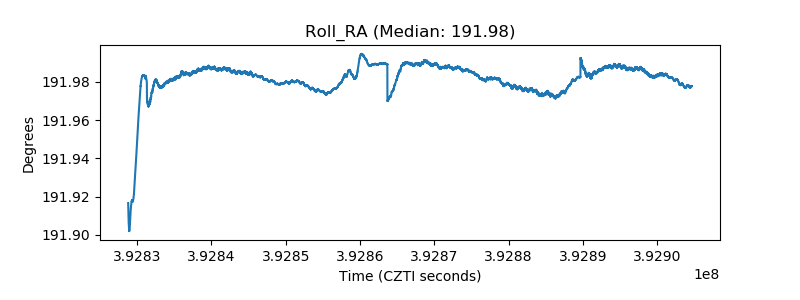 |
| Veto Counter | 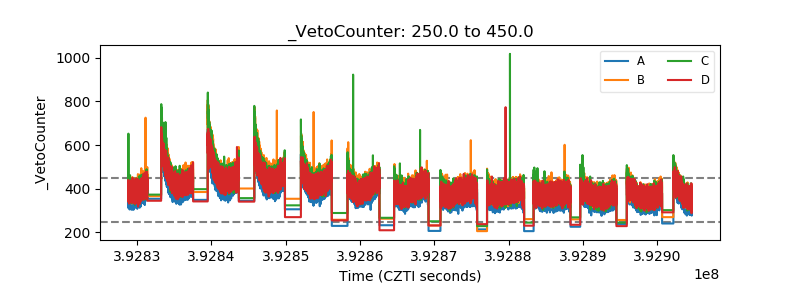 |