| Param | Original file | Final file |
|---|---|---|
| Filename | modeM0/AS1A10_071T36_9000005182_36273cztM0_level2.evt | modeM0/AS1A10_071T36_9000005182_36273cztM0_level2_quad_clean.evt |
| Size (bytes) | 125,582,400 | 29,989,440 |
| Size | 119.8 MB | 28.6 MB |
| Events in quadrant A | 790,741 | 204,606 |
| Events in quadrant B | 922,572 | 204,821 |
| Events in quadrant C | 910,003 | 198,779 |
| Events in quadrant D | 1,077,246 | 190,260 |
| Mode SS | |||
|---|---|---|---|
| Quadrant | BADHDUFLAG | Total packets | Discarded packets |
| A | 0 | 30 | 0 |
| B | 0 | 30 | 0 |
| C | 0 | 30 | 0 |
| D | 0 | 30 | 0 |
| Mode M9 | |||
|---|---|---|---|
| Quadrant | BADHDUFLAG | Total packets | Discarded packets |
| A | 0 | 2 | 0 |
| B | 0 | 2 | 0 |
| C | 0 | 2 | 0 |
| D | 0 | 3 | 0 |
| Mode M0 | |||
|---|---|---|---|
| Quadrant | BADHDUFLAG | Total packets | Discarded packets |
| A | 0 | 3262 | 1 |
| B | 0 | 3728 | 1 |
| C | 0 | 3565 | 1 |
| D | 0 | 4211 | 1 |
| Quadrant | Total seconds | Saturated seconds | Saturation percentage |
|---|---|---|---|
| A | 1471 | 5 | 0.339905% |
| B | 1471 | 31 | 2.107410% |
| C | 1471 | 49 | 3.331067% |
| D | 1471 | 26 | 1.767505% |
Noise dominated data is calculated using 1-second bins in cleaned event files. If a bin has >2000 counts, and if more than 50% of those come from <1% of pixels, then it is considered to be noise-dominated and hence unusable.
| Quadrant | # 1 sec bins | Bins with >0 counts | Bins with >2000 counts | High rate bins dominated by noise | Noise dominated (total time) | Noise dominated (detector-on time) | Marked lightcurve |
|---|---|---|---|---|---|---|---|
| A | 1471 | 1471 | 0 | 0 | 0.00% | 0.00% | 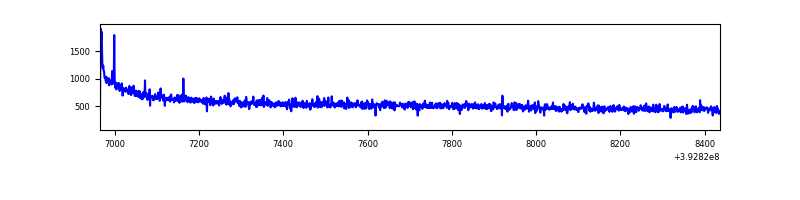 |
| B | 1471 | 1471 | 18 | 18 | 1.22% | 1.22% | 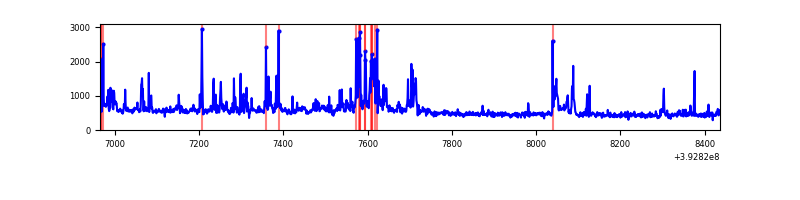 |
| C | 1471 | 1471 | 37 | 37 | 2.52% | 2.52% | 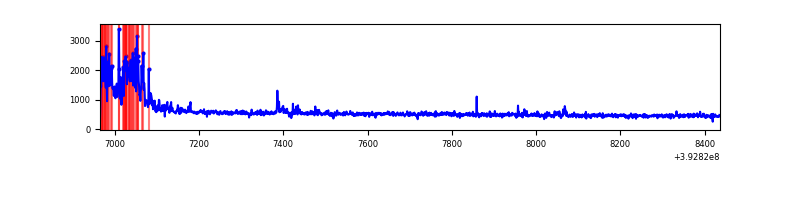 |
| D | 1471 | 1471 | 20 | 20 | 1.36% | 1.36% | 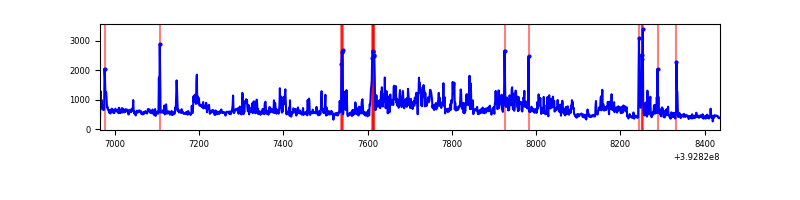 |
Top three noisy pixels from each quadrant. If the there are fewer than three noisy pixels in the level2.evt file, extra rows are filled as -1
| Pixel properties | Quadrant properties | ||||||
|---|---|---|---|---|---|---|---|
| Quadrant | DetID | PixID | Counts | Sigma | Mean | Median | Sigma |
| A | 10 | 83 | 74789 | 1978.66 | 183 | 179 | 37.7 |
| A | 13 | 6 | 4848 | 123.82 | 183 | 179 | 37.7 |
| A | 9 | 143 | 2914 | 72.53 | 183 | 179 | 37.7 |
| B | 5 | 236 | 59794 | 1672.08 | 178 | 173 | 35.7 |
| B | 0 | 190 | 47890 | 1338.23 | 178 | 173 | 35.7 |
| B | 5 | 172 | 46388 | 1296.11 | 178 | 173 | 35.7 |
| C | 0 | 10 | 158060 | 3730.56 | 175 | 176 | 42.3 |
| C | 15 | 214 | 63745 | 1502.04 | 175 | 176 | 42.3 |
| C | 0 | 207 | 2327 | 50.82 | 175 | 176 | 42.3 |
| D | 12 | 6 | 211277 | 4737.12 | 179 | 173 | 44.6 |
| D | 2 | 153 | 46037 | 1029.18 | 179 | 173 | 44.6 |
| D | 13 | 249 | 35158 | 785.05 | 179 | 173 | 44.6 |
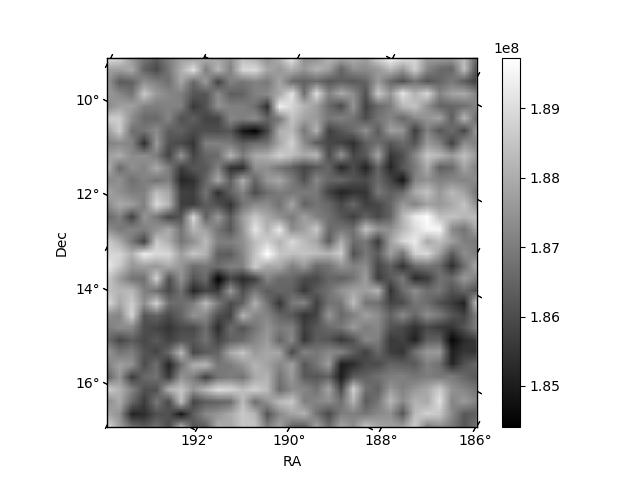
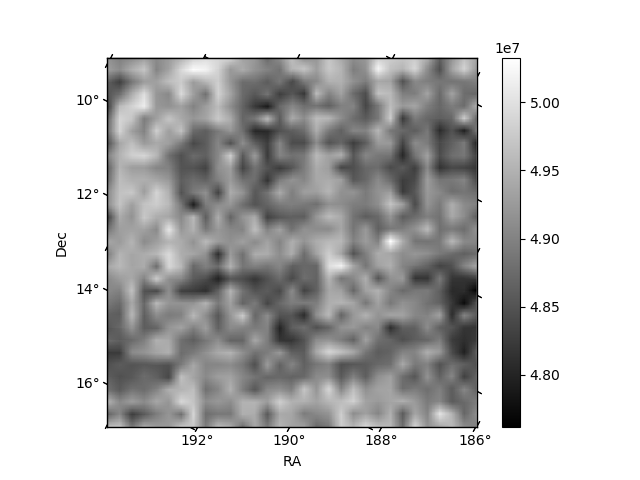
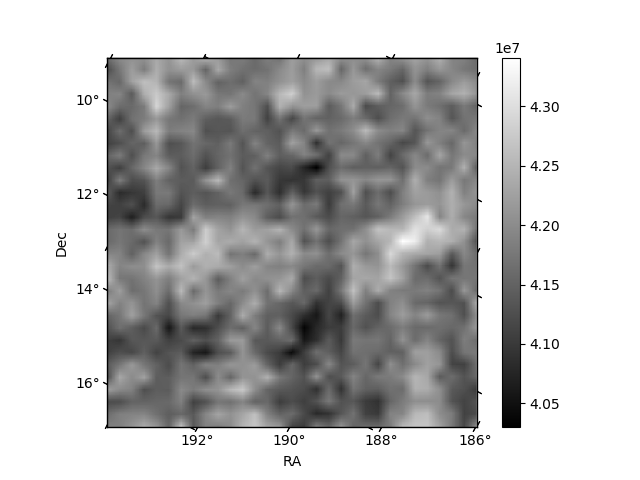
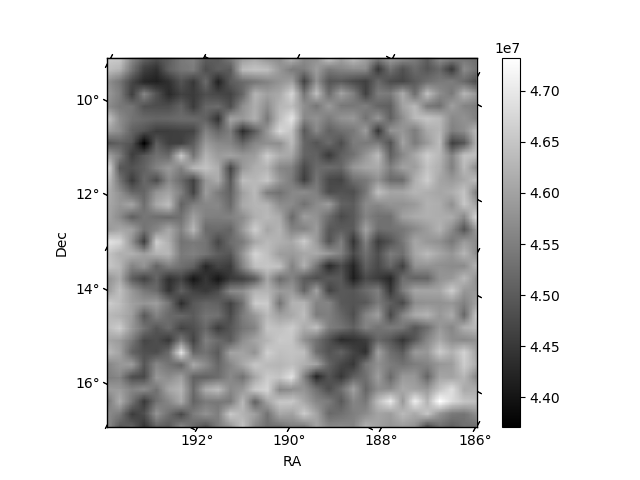
Histogram calculated using DETX and DETY for each event in the final _common_clean file
| Quadrant A | 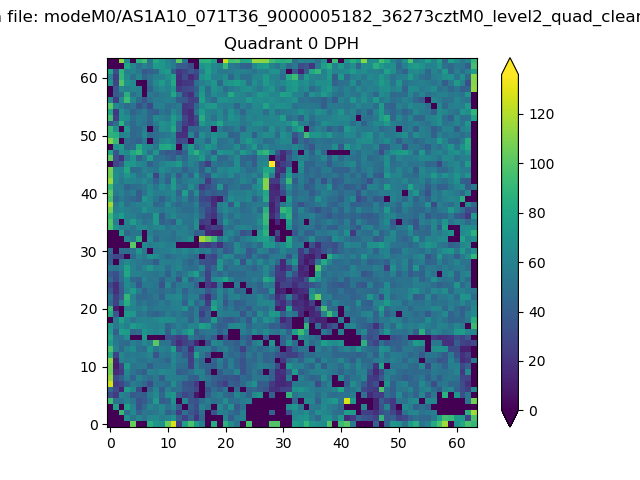 |
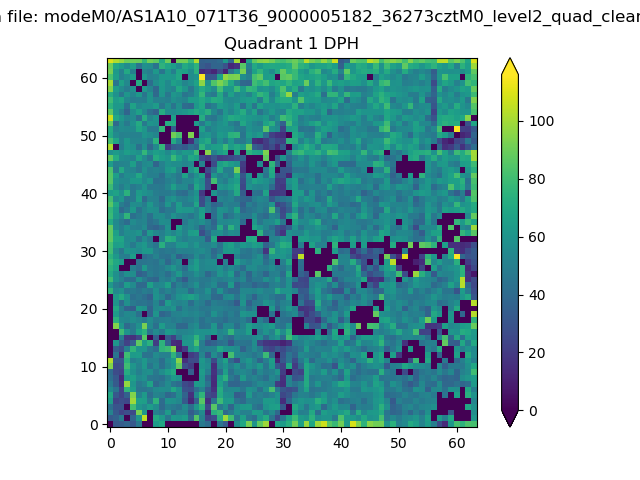 |
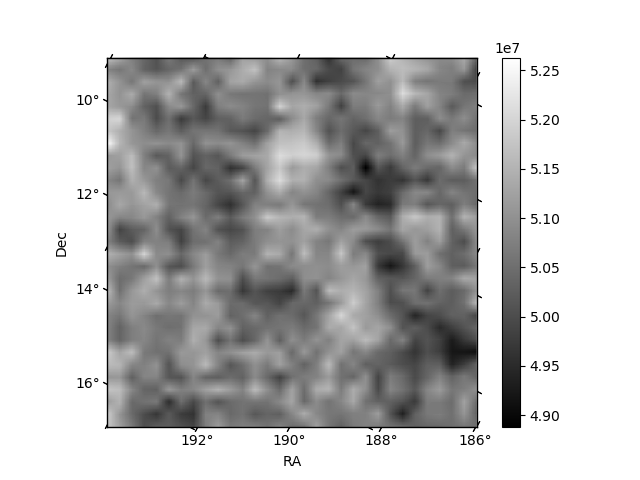
Quadrant B |
|---|---|---|---|
| Quadrant D | 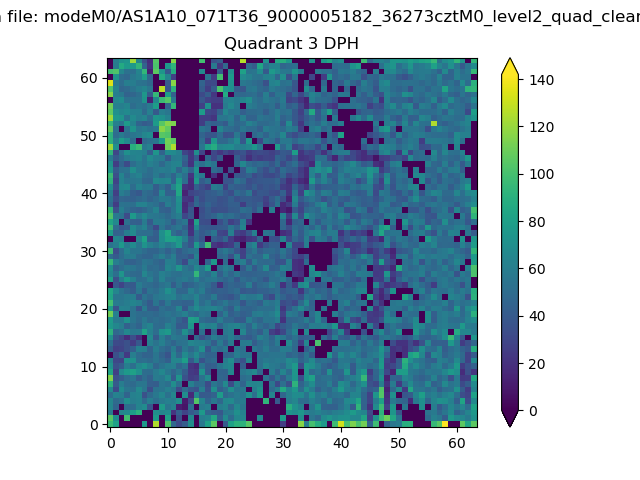 |
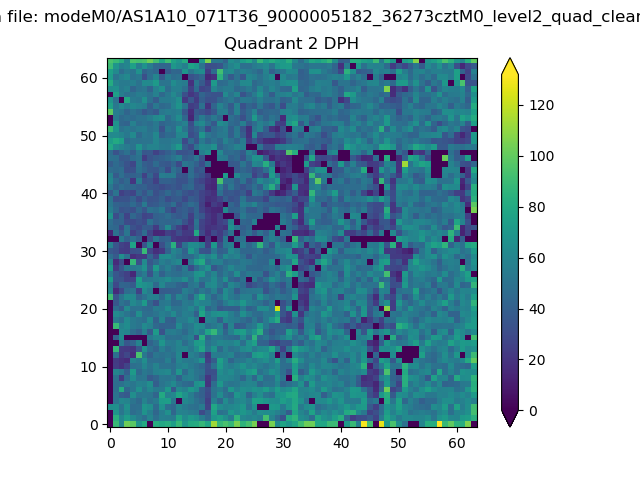 |
Quadrant C |
| Plot type | Count rate plots | Images |
|---|---|---|
| Comparison with Poisson distribution Blue bars denote a histogram of data divided into 1 sec bins. Red curve is a Poisson curve with rate = median count rate of data. |
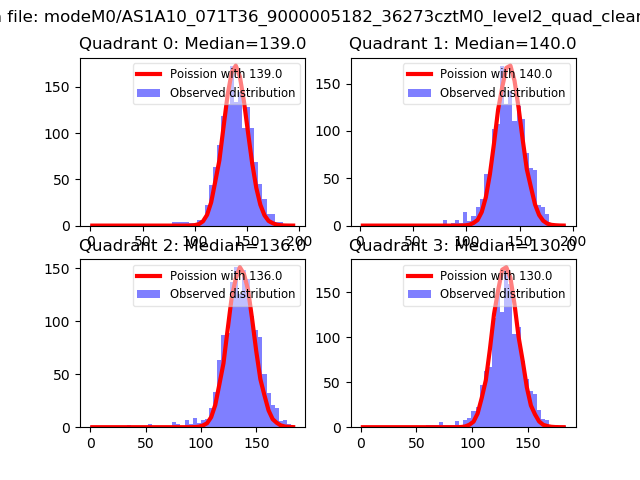 |
 |
| Quadrant-wise count rates Data is divided into 100 sec bins |
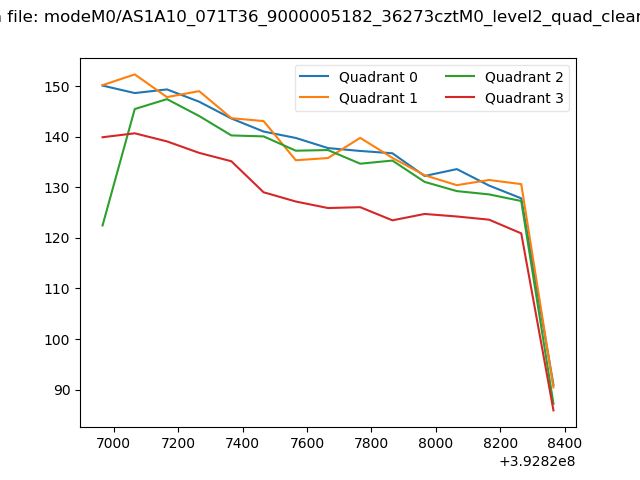 |
|
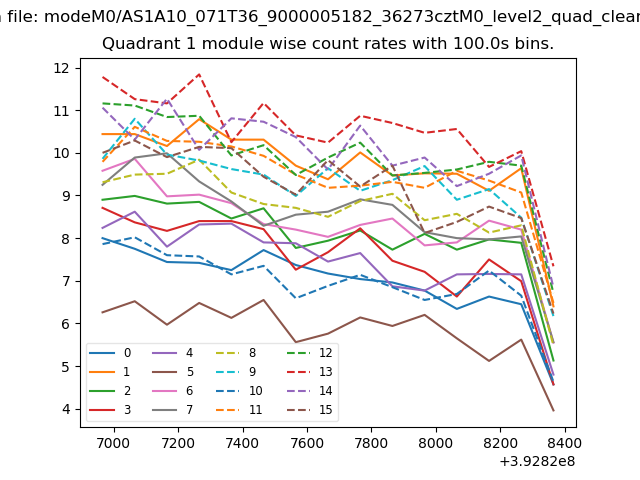
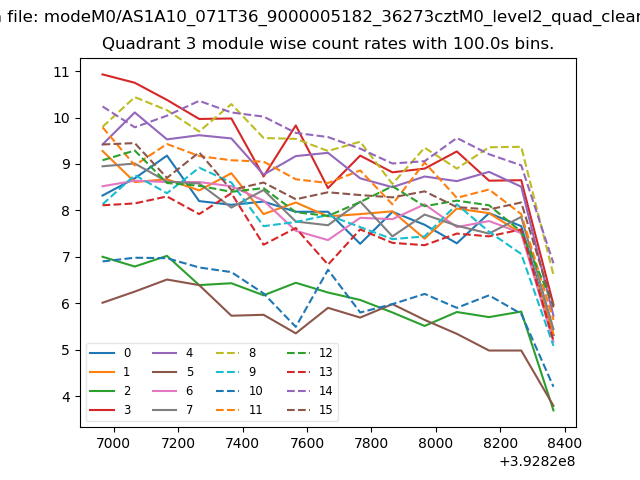
| Module-wise count rates for Quadrant A Data is divided into 100 sec bins |
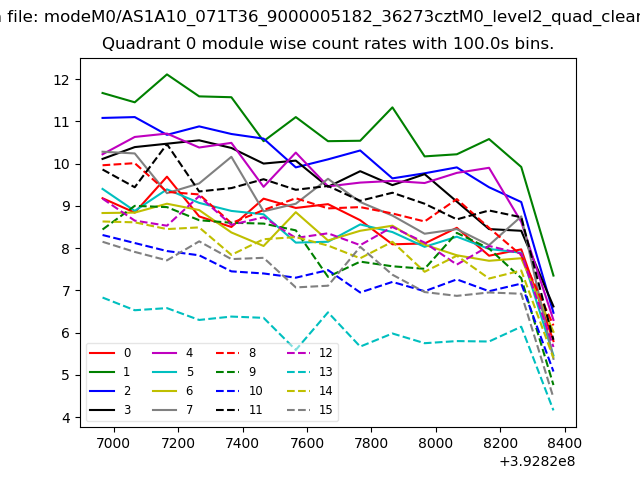 |
 |
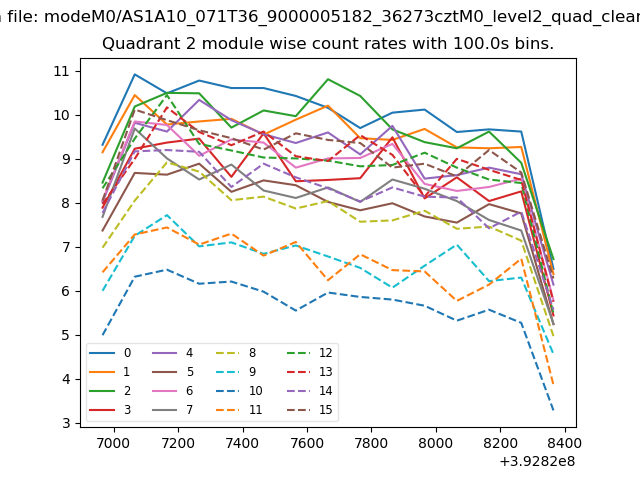
| Module-wise count rates for Quadrant B Data is divided into 100 sec bins |
 |
 |
| Module-wise count rates for Quadrant C Data is divided into 100 sec bins |
 |
 |
| Module-wise count rates for Quadrant D Data is divided into 100 sec bins |
 |
 |
| Parameter | Plot |
|---|---|
| CZT HV Monitor | 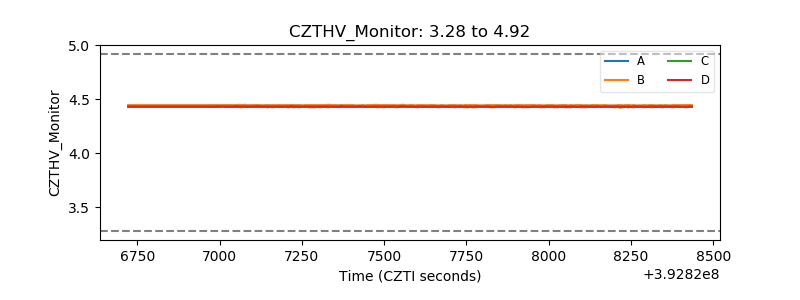 |
| D_VDD | 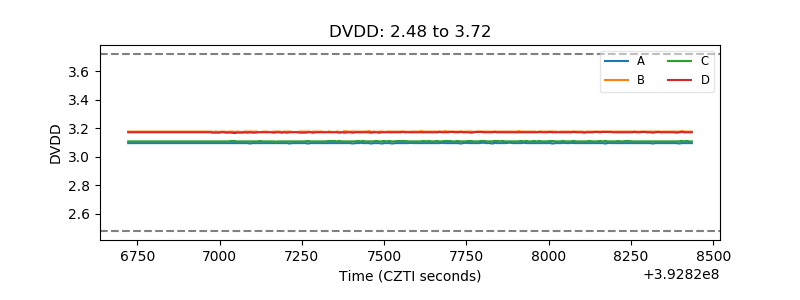 |
| Temperature 1 | 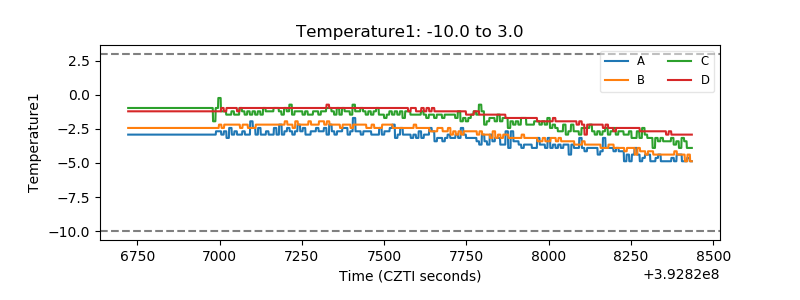 |
| Veto HV Monitor | 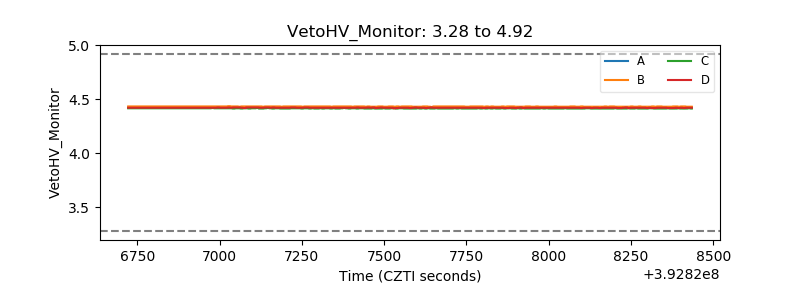 |
| Veto LLD | 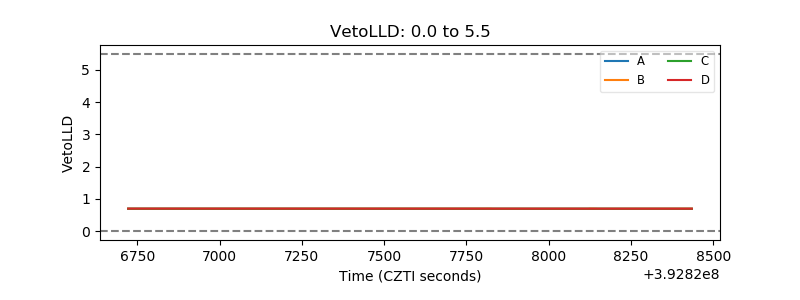 |
| Alpha Counter | 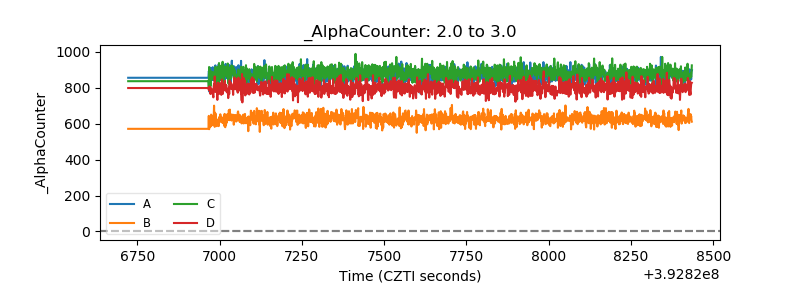 |
| _CPM_Rate | 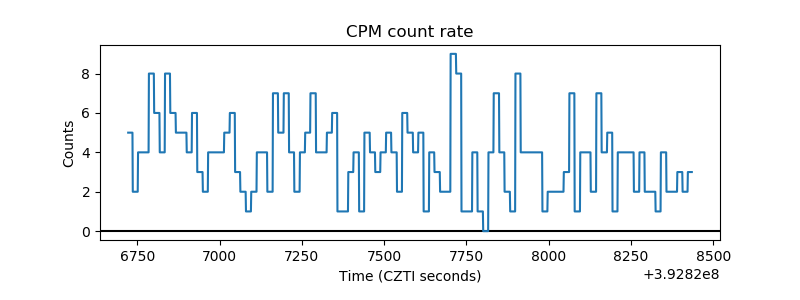 |
| CZT Counter | 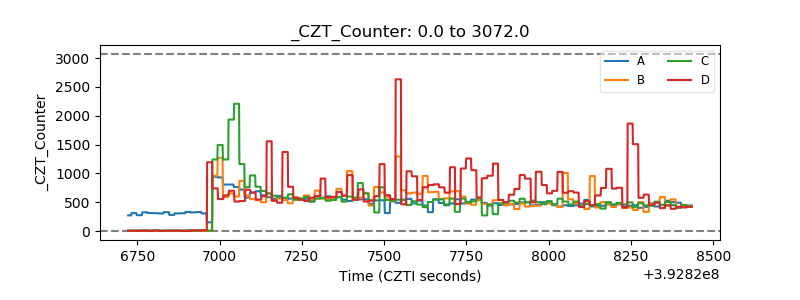 |
| +2.5 Volts monitor | 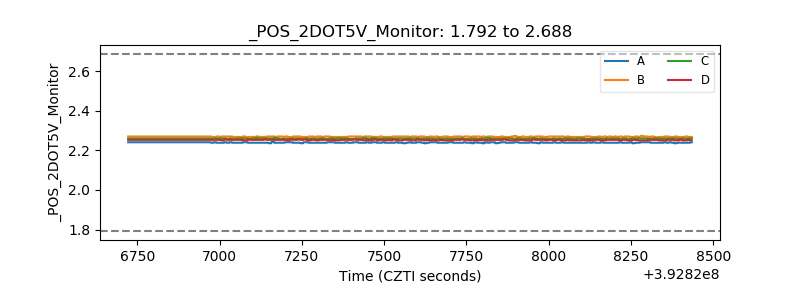 |
| +5 Volts monitor | 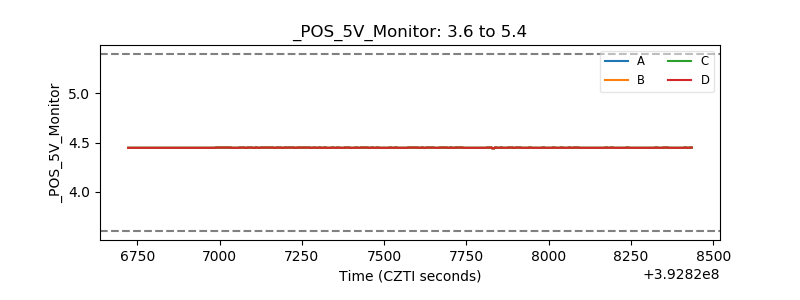 |
| _ROLL_ROT | 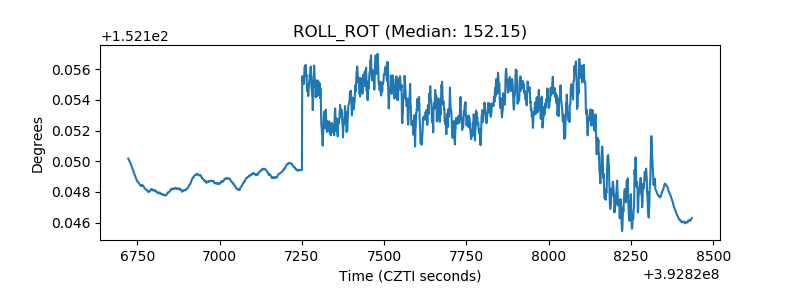 |
| _Roll_DEC | 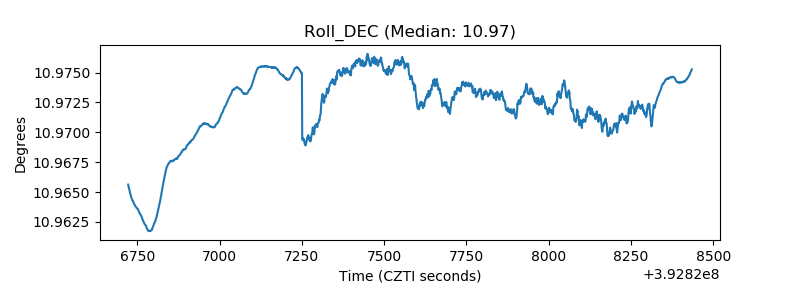 |
| _Roll_RA | 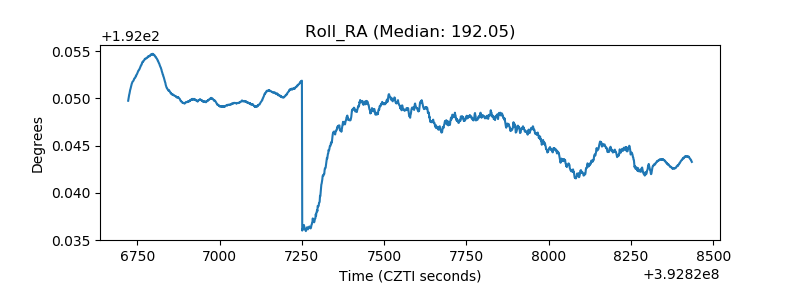 |
| Veto Counter | 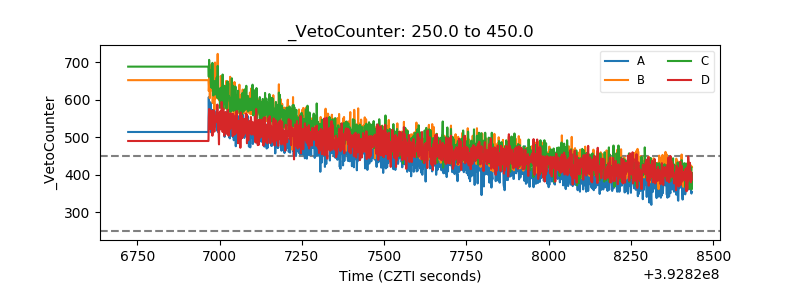 |