| Param | Original file | Final file |
|---|---|---|
| Filename | modeM0/AS1A10_071T36_9000005182_36271cztM0_level2.evt | modeM0/AS1A10_071T36_9000005182_36271cztM0_level2_quad_clean.evt |
| Size (bytes) | 490,104,000 | 81,558,720 |
| Size | 467.4 MB | 77.8 MB |
| Events in quadrant A | 2,770,945 | 542,465 |
| Events in quadrant B | 3,925,955 | 534,734 |
| Events in quadrant C | 3,245,962 | 525,857 |
| Events in quadrant D | 4,524,470 | 479,137 |
| Mode SS | |||
|---|---|---|---|
| Quadrant | BADHDUFLAG | Total packets | Discarded packets |
| A | 0 | 114 | 0 |
| B | 0 | 114 | 0 |
| C | 0 | 114 | 0 |
| D | 0 | 114 | 0 |
| Mode M9 | |||
|---|---|---|---|
| Quadrant | BADHDUFLAG | Total packets | Discarded packets |
| A | 0 | 17 | 0 |
| B | 0 | 17 | 0 |
| C | 0 | 17 | 0 |
| D | 0 | 17 | 0 |
| Mode M0 | |||
|---|---|---|---|
| Quadrant | BADHDUFLAG | Total packets | Discarded packets |
| A | 0 | 11834 | 3 |
| B | 0 | 15341 | 2 |
| C | 0 | 13001 | 2 |
| D | 0 | 17153 | 2 |
| Quadrant | Total seconds | Saturated seconds | Saturation percentage |
|---|---|---|---|
| A | 5531 | 20 | 0.361598% |
| B | 5531 | 262 | 4.736937% |
| C | 5531 | 104 | 1.880311% |
| D | 5532 | 501 | 9.056399% |
Noise dominated data is calculated using 1-second bins in cleaned event files. If a bin has >2000 counts, and if more than 50% of those come from <1% of pixels, then it is considered to be noise-dominated and hence unusable.
| Quadrant | # 1 sec bins | Bins with >0 counts | Bins with >2000 counts | High rate bins dominated by noise | Noise dominated (total time) | Noise dominated (detector-on time) | Marked lightcurve |
|---|---|---|---|---|---|---|---|
| A | 7264 | 5532 | 10 | 10 | 0.14% | 0.18% | 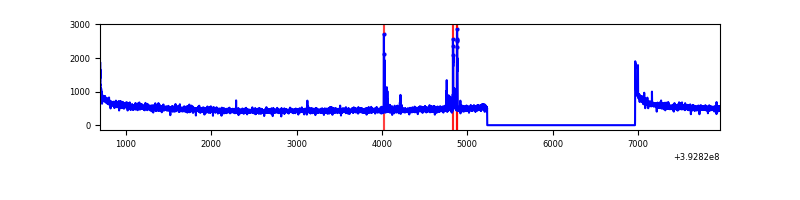 |
| B | 7264 | 5532 | 176 | 176 | 2.42% | 3.18% | 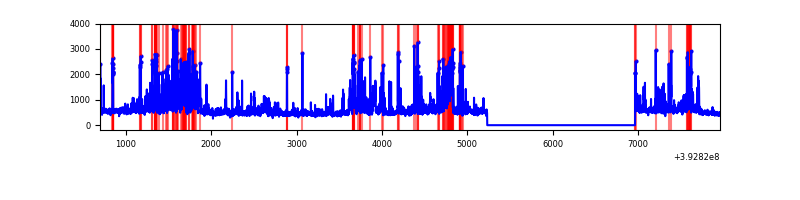 |
| C | 7264 | 5532 | 76 | 76 | 1.05% | 1.37% | 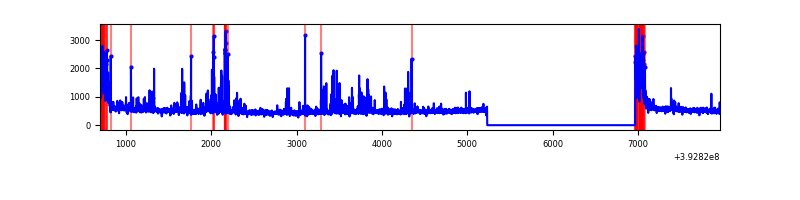 |
| D | 7265 | 5533 | 525 | 525 | 7.23% | 9.49% | 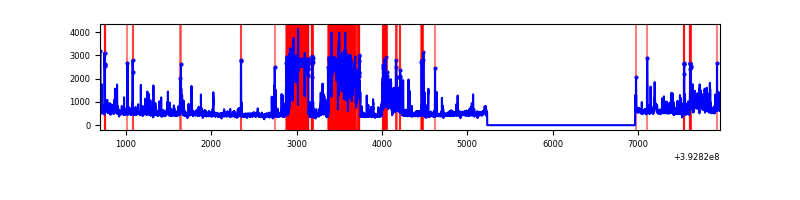 |
Top three noisy pixels from each quadrant. If the there are fewer than three noisy pixels in the level2.evt file, extra rows are filled as -1
| Pixel properties | Quadrant properties | ||||||
|---|---|---|---|---|---|---|---|
| Quadrant | DetID | PixID | Counts | Sigma | Mean | Median | Sigma |
| A | 10 | 83 | 185011 | 1415.71 | 650 | 638 | 130.2 |
| A | 9 | 143 | 56759 | 430.92 | 650 | 638 | 130.2 |
| A | 13 | 6 | 15959 | 117.64 | 650 | 638 | 130.2 |
| B | 5 | 172 | 518851 | 4227.89 | 633 | 616 | 122.6 |
| B | 4 | 171 | 327019 | 2662.88 | 633 | 616 | 122.6 |
| B | 5 | 236 | 263463 | 2144.37 | 633 | 616 | 122.6 |
| C | 0 | 10 | 351076 | 2383.32 | 628 | 633 | 147.0 |
| C | 15 | 214 | 229050 | 1553.44 | 628 | 633 | 147.0 |
| C | 0 | 207 | 205877 | 1395.84 | 628 | 633 | 147.0 |
| D | 7 | 223 | 1543252 | 10272.78 | 612 | 594 | 150.2 |
| D | 12 | 6 | 238566 | 1584.69 | 612 | 594 | 150.2 |
| D | 2 | 153 | 123749 | 820.11 | 612 | 594 | 150.2 |
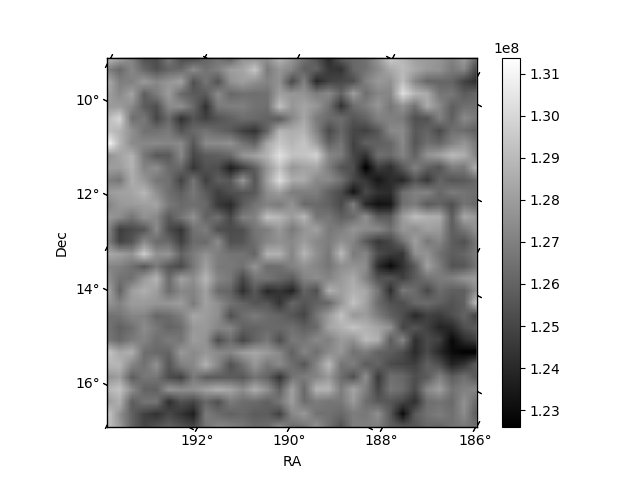
Histogram calculated using DETX and DETY for each event in the final _common_clean file
| Quadrant A | 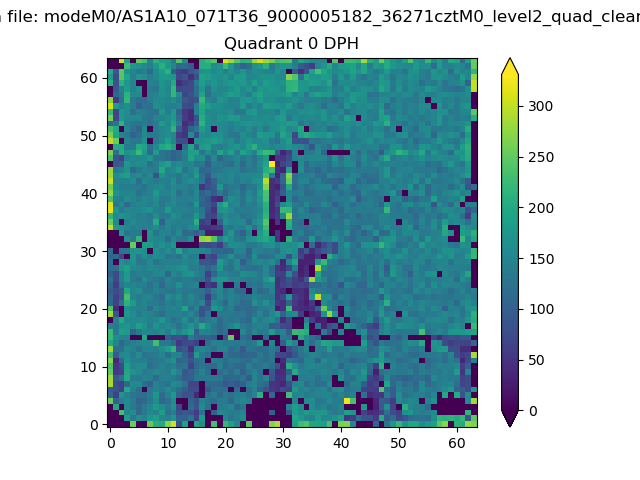 |
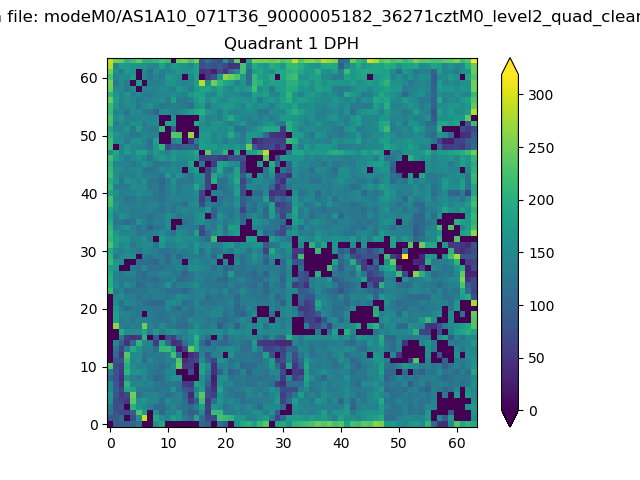 |
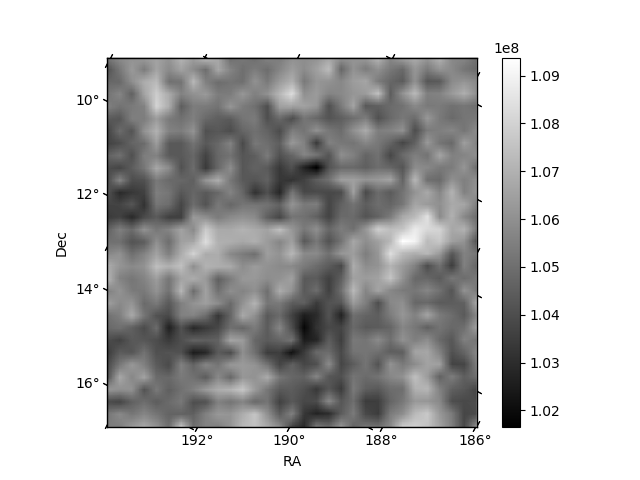
Quadrant B |
|---|---|---|---|
| Quadrant D | 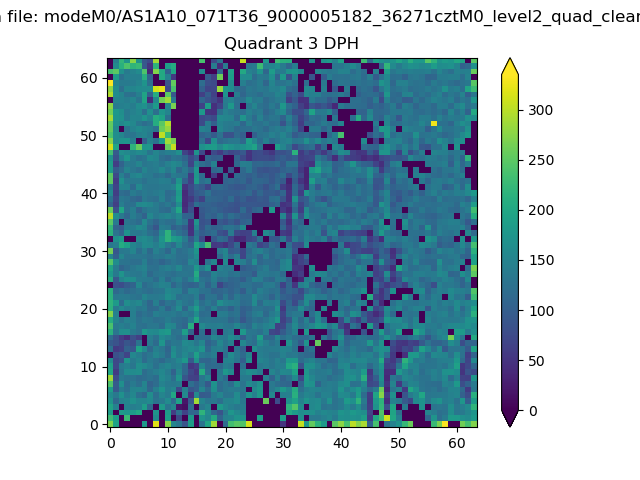 |
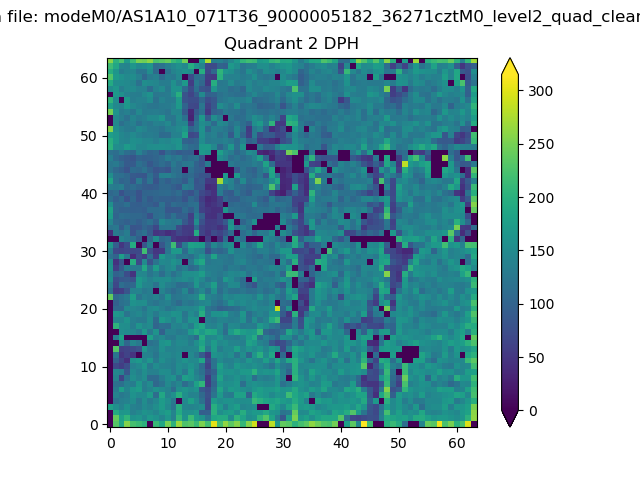 |
Quadrant C |
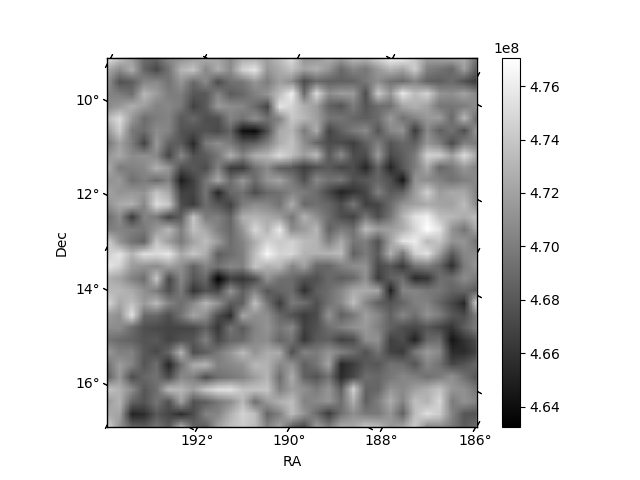
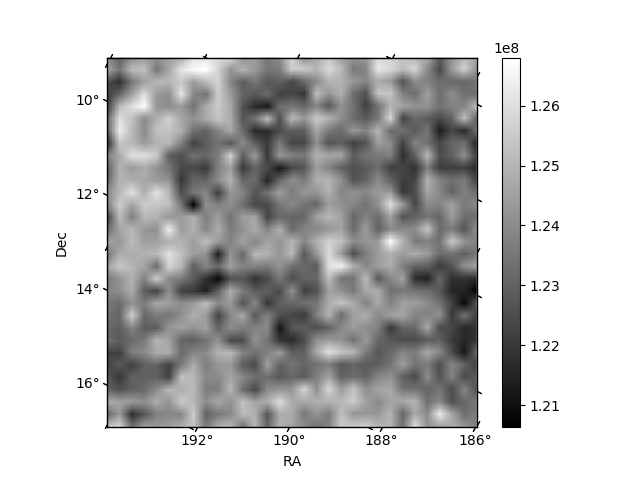
| Plot type | Count rate plots | Images |
|---|---|---|
| Comparison with Poisson distribution Blue bars denote a histogram of data divided into 1 sec bins. Red curve is a Poisson curve with rate = median count rate of data. |
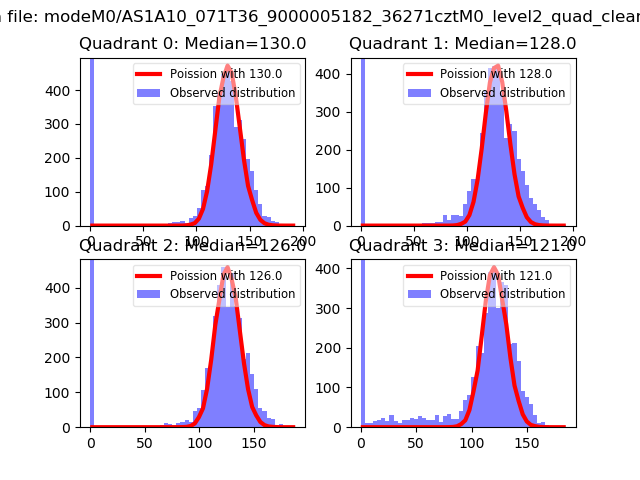 |
 |
| Quadrant-wise count rates Data is divided into 100 sec bins |
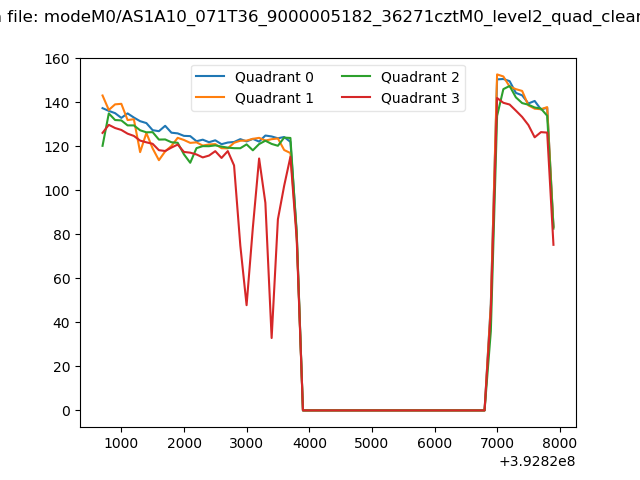 |
|
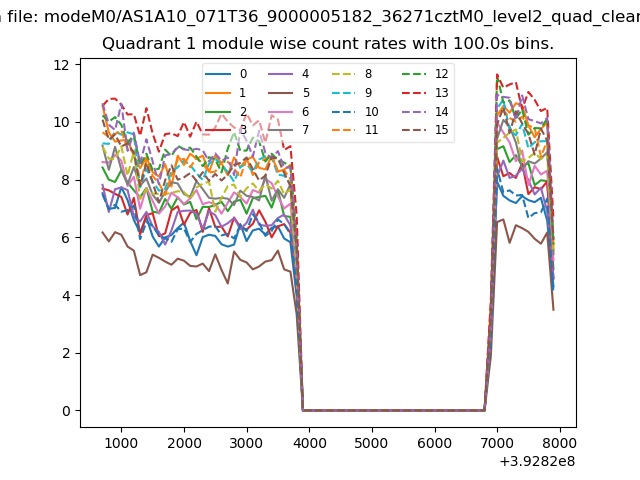
| Module-wise count rates for Quadrant A Data is divided into 100 sec bins |
 |
 |
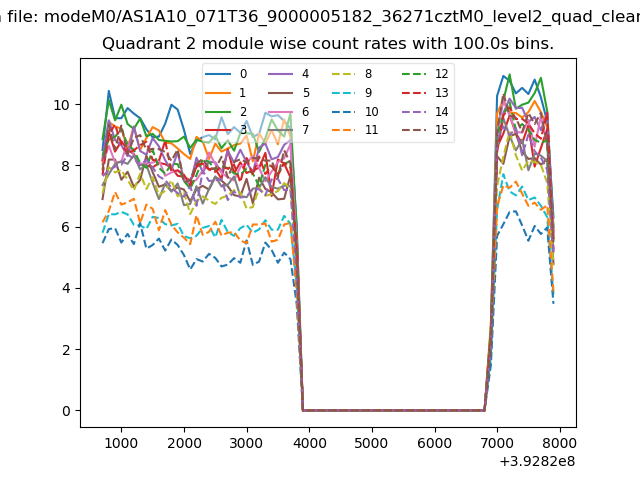
| Module-wise count rates for Quadrant B Data is divided into 100 sec bins |
 |
 |
| Module-wise count rates for Quadrant C Data is divided into 100 sec bins |
 |
 |
| Module-wise count rates for Quadrant D Data is divided into 100 sec bins |
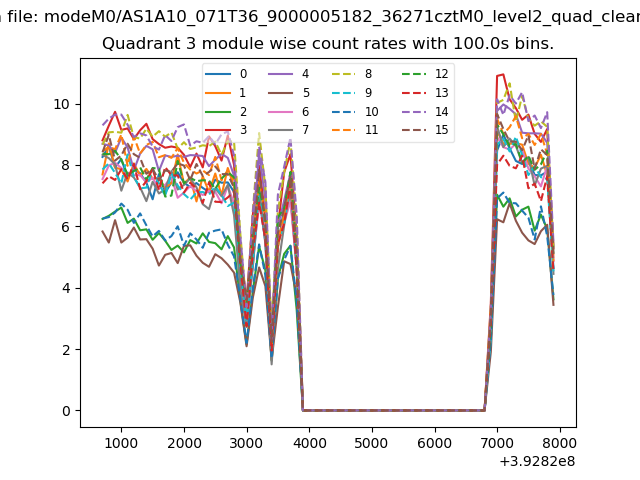 |
 |
| Parameter | Plot |
|---|---|
| CZT HV Monitor |  |
| D_VDD | 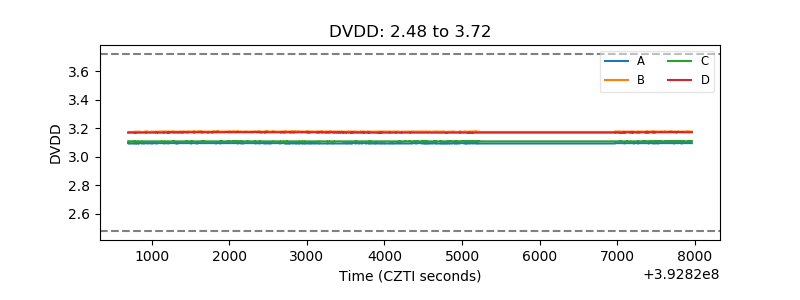 |
| Temperature 1 | 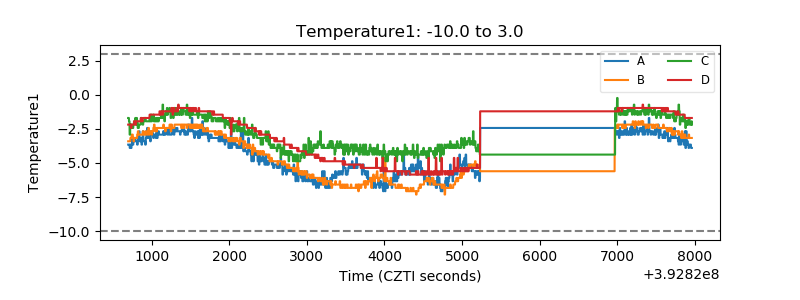 |
| Veto HV Monitor | 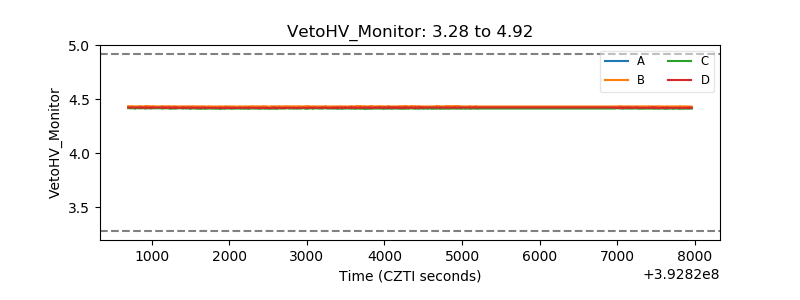 |
| Veto LLD | 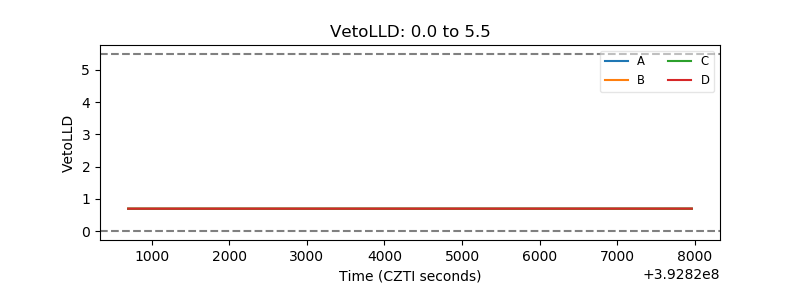 |
| Alpha Counter | 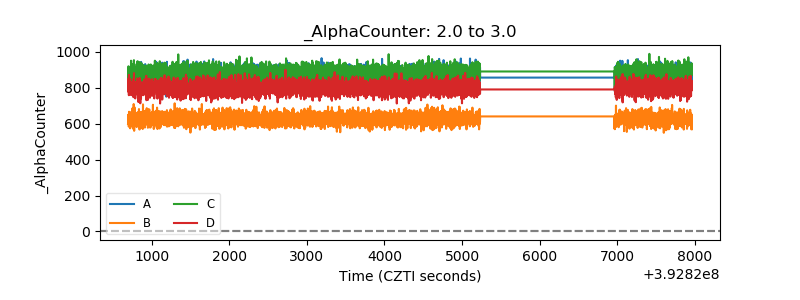 |
| _CPM_Rate | 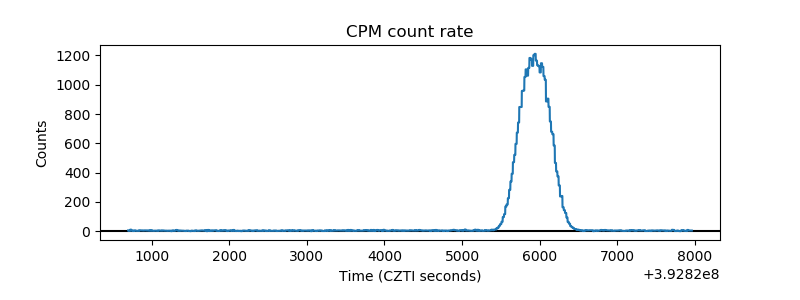 |
| CZT Counter | 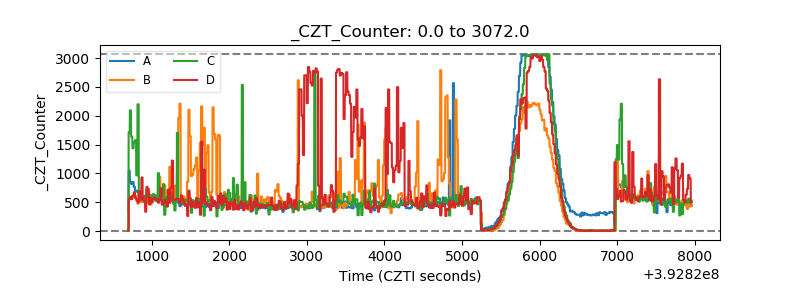 |
| +2.5 Volts monitor | 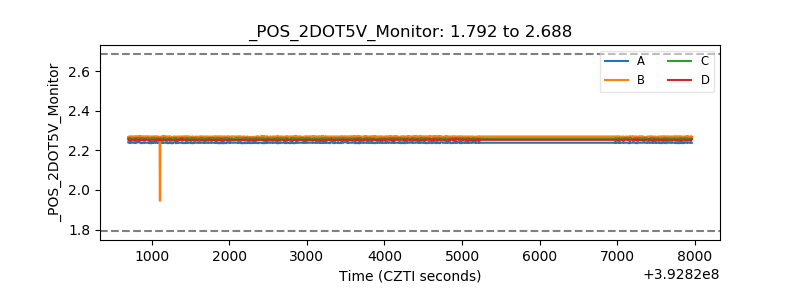 |
| +5 Volts monitor | 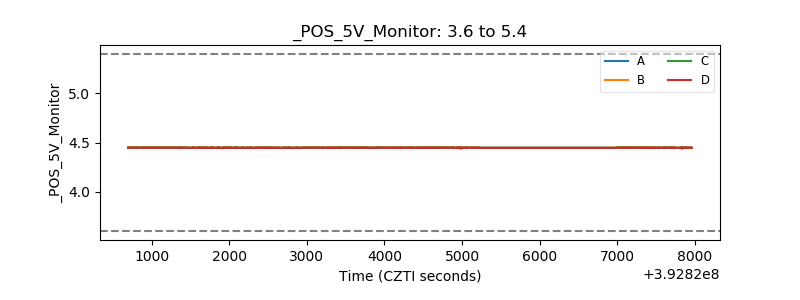 |
| _ROLL_ROT | 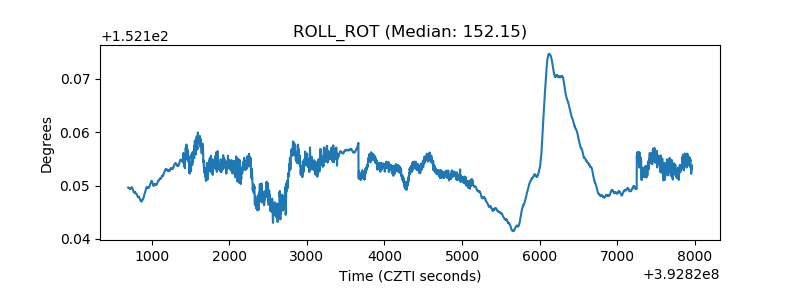 |
| _Roll_DEC | 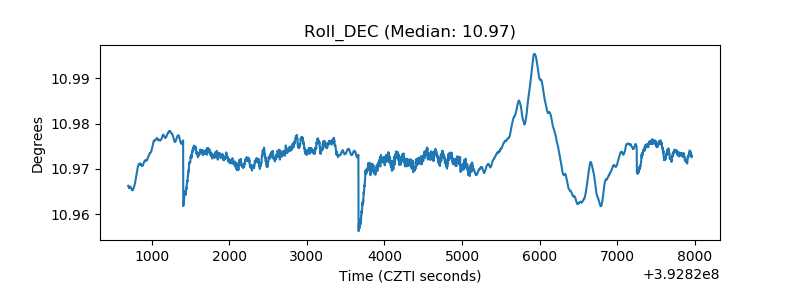 |
| _Roll_RA | 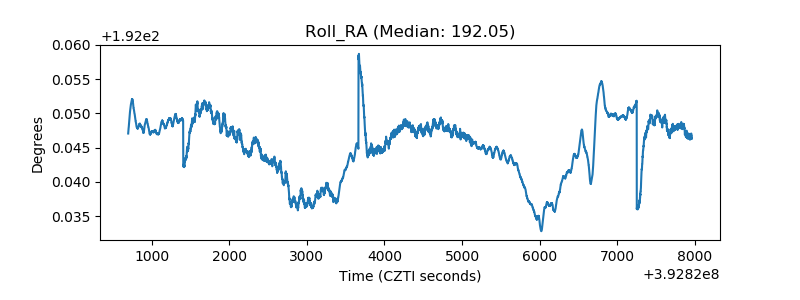 |
| Veto Counter | 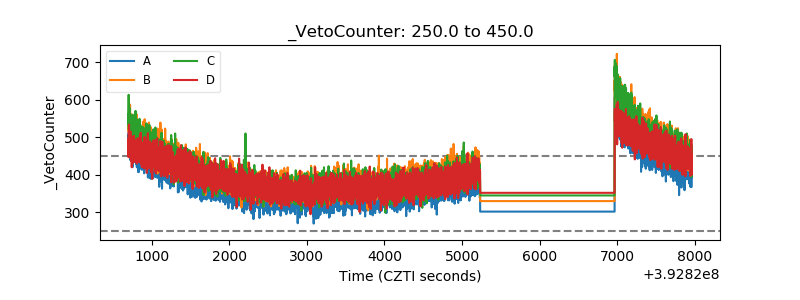 |