| Param | Original file | Final file |
|---|---|---|
| Filename | modeM0/AS1A10_071T36_9000005182_36270cztM0_level2.evt | modeM0/AS1A10_071T36_9000005182_36270cztM0_level2_quad_clean.evt |
| Size (bytes) | 464,555,520 | 84,300,480 |
| Size | 443.0 MB | 80.4 MB |
| Events in quadrant A | 2,701,194 | 557,868 |
| Events in quadrant B | 4,443,118 | 539,246 |
| Events in quadrant C | 3,172,850 | 545,608 |
| Events in quadrant D | 3,374,629 | 521,133 |
| Mode SS | |||
|---|---|---|---|
| Quadrant | BADHDUFLAG | Total packets | Discarded packets |
| A | 0 | 112 | 0 |
| B | 0 | 112 | 0 |
| C | 0 | 112 | 0 |
| D | 0 | 112 | 0 |
| Mode M9 | |||
|---|---|---|---|
| Quadrant | BADHDUFLAG | Total packets | Discarded packets |
| A | 0 | 16 | 0 |
| B | 0 | 16 | 0 |
| C | 0 | 16 | 0 |
| D | 0 | 16 | 0 |
| Mode M0 | |||
|---|---|---|---|
| Quadrant | BADHDUFLAG | Total packets | Discarded packets |
| A | 0 | 11645 | 3 |
| B | 0 | 16789 | 2 |
| C | 0 | 12847 | 2 |
| D | 0 | 13756 | 2 |
| Quadrant | Total seconds | Saturated seconds | Saturation percentage |
|---|---|---|---|
| A | 5562 | 8 | 0.143833% |
| B | 5562 | 422 | 7.587199% |
| C | 5562 | 70 | 1.258540% |
| D | 5562 | 129 | 2.319310% |
Noise dominated data is calculated using 1-second bins in cleaned event files. If a bin has >2000 counts, and if more than 50% of those come from <1% of pixels, then it is considered to be noise-dominated and hence unusable.
| Quadrant | # 1 sec bins | Bins with >0 counts | Bins with >2000 counts | High rate bins dominated by noise | Noise dominated (total time) | Noise dominated (detector-on time) | Marked lightcurve |
|---|---|---|---|---|---|---|---|
| A | 7145 | 5563 | 1 | 1 | 0.01% | 0.02% | 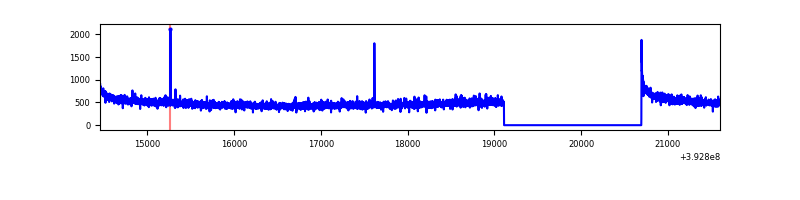 |
| B | 7145 | 5563 | 345 | 345 | 4.83% | 6.20% | 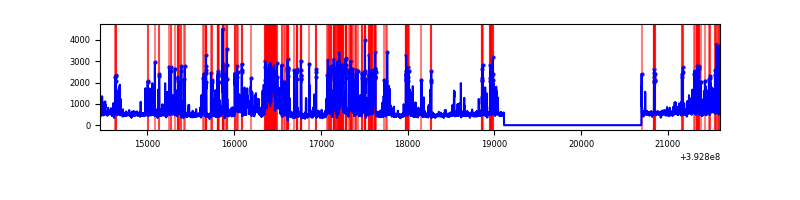 |
| C | 7145 | 5563 | 44 | 44 | 0.62% | 0.79% | 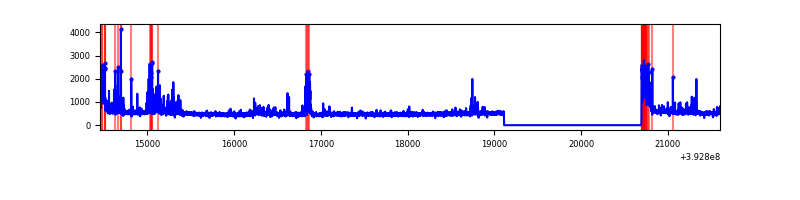 |
| D | 7145 | 5563 | 115 | 115 | 1.61% | 2.07% | 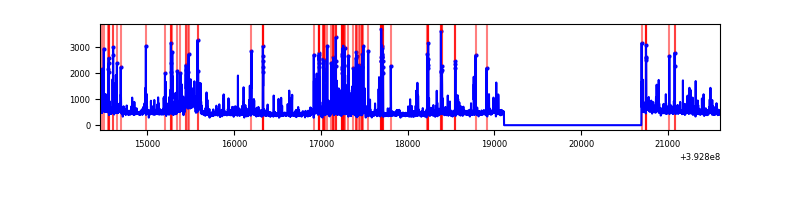 |
Top three noisy pixels from each quadrant. If the there are fewer than three noisy pixels in the level2.evt file, extra rows are filled as -1
| Pixel properties | Quadrant properties | ||||||
|---|---|---|---|---|---|---|---|
| Quadrant | DetID | PixID | Counts | Sigma | Mean | Median | Sigma |
| A | 10 | 83 | 167112 | 1256.24 | 650 | 636 | 132.5 |
| A | 9 | 143 | 8438 | 58.87 | 650 | 636 | 132.5 |
| A | 13 | 254 | 8166 | 56.82 | 650 | 636 | 132.5 |
| B | 5 | 172 | 1325175 | 10798.46 | 627 | 611 | 122.7 |
| B | 5 | 236 | 270398 | 2199.43 | 627 | 611 | 122.7 |
| B | 4 | 171 | 124020 | 1006.09 | 627 | 611 | 122.7 |
| C | 0 | 10 | 238978 | 1616.83 | 628 | 634 | 147.4 |
| C | 15 | 214 | 230969 | 1562.5 | 628 | 634 | 147.4 |
| C | 0 | 207 | 206381 | 1395.71 | 628 | 634 | 147.4 |
| D | 13 | 171 | 282340 | 1833.61 | 628 | 610 | 153.6 |
| D | 12 | 6 | 262425 | 1704.0 | 628 | 610 | 153.6 |
| D | 2 | 153 | 125326 | 811.7 | 628 | 610 | 153.6 |
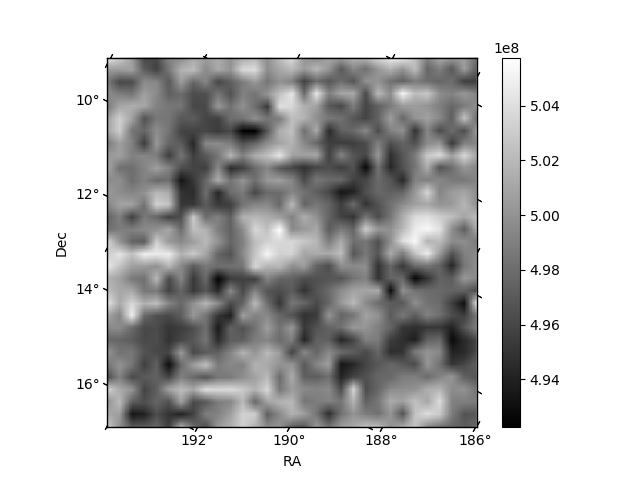
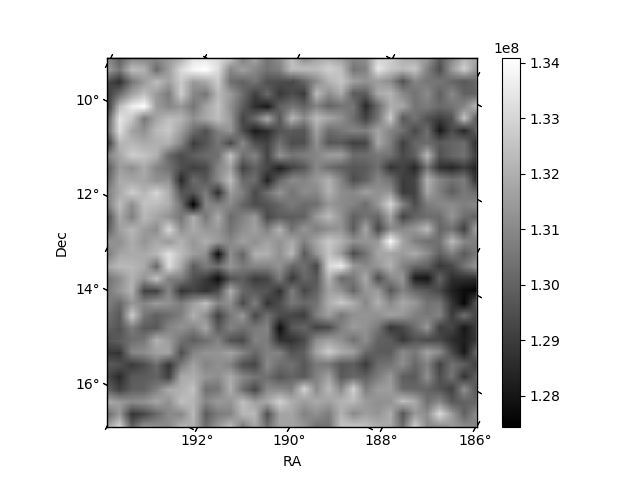
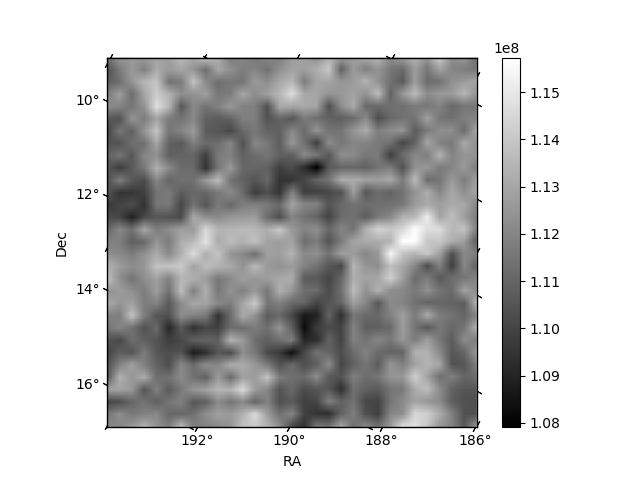
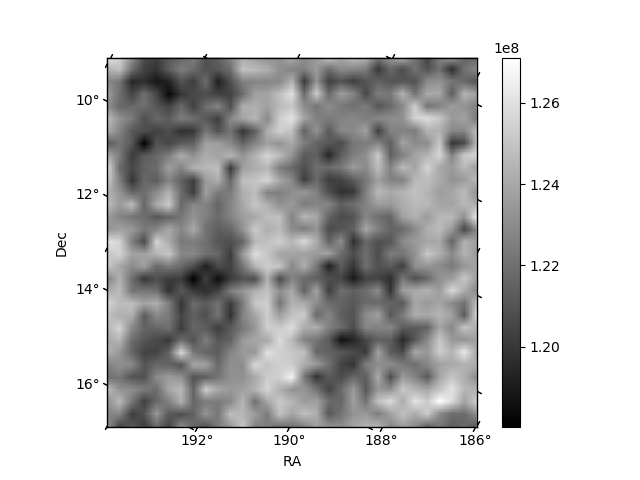
Histogram calculated using DETX and DETY for each event in the final _common_clean file
| Quadrant A | 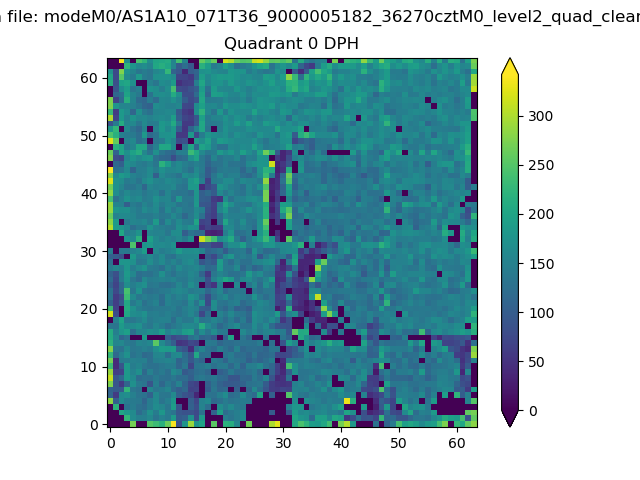 |
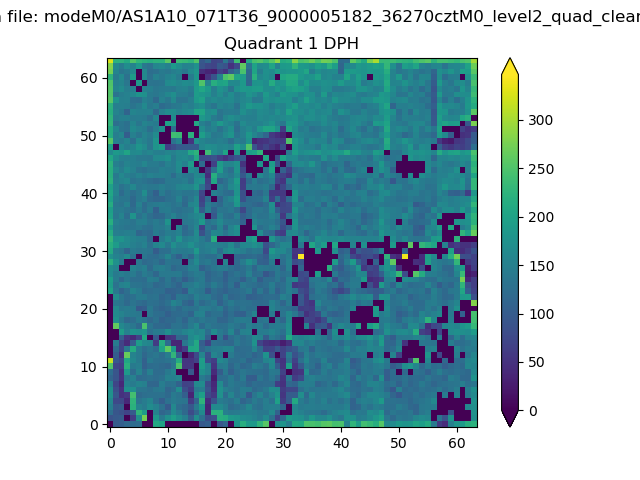 |
Quadrant B |
|---|---|---|---|
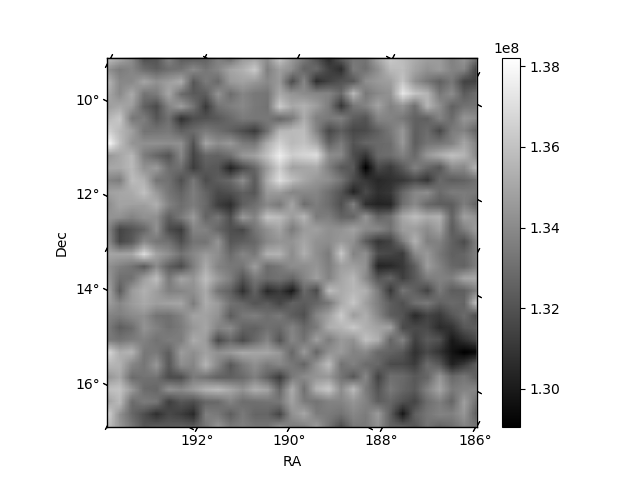
| Quadrant D | 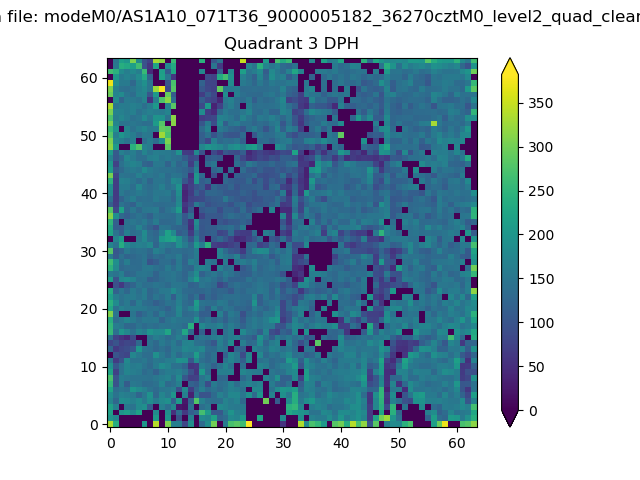 |
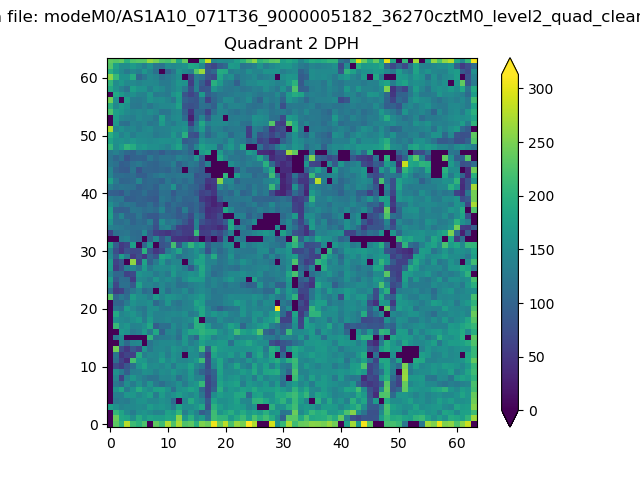 |
Quadrant C |
| Plot type | Count rate plots | Images |
|---|---|---|
| Comparison with Poisson distribution Blue bars denote a histogram of data divided into 1 sec bins. Red curve is a Poisson curve with rate = median count rate of data. |
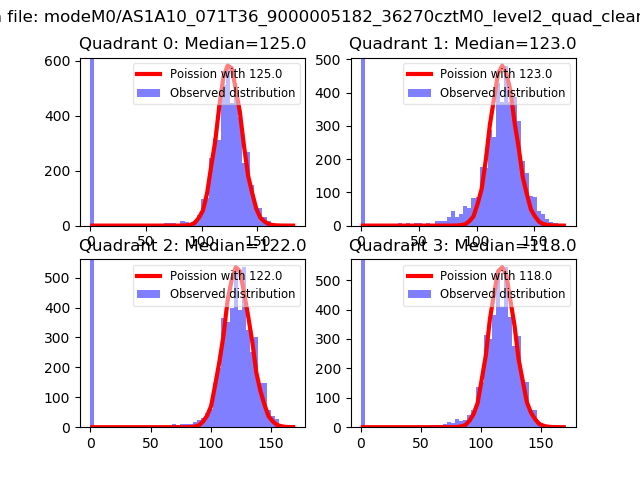 |
 |
| Quadrant-wise count rates Data is divided into 100 sec bins |
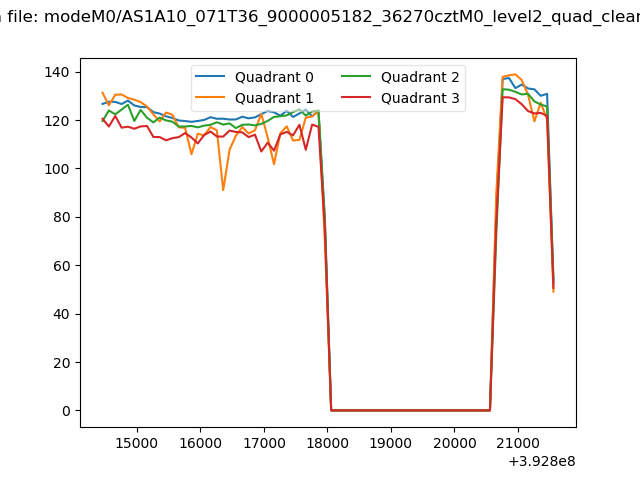 |
|
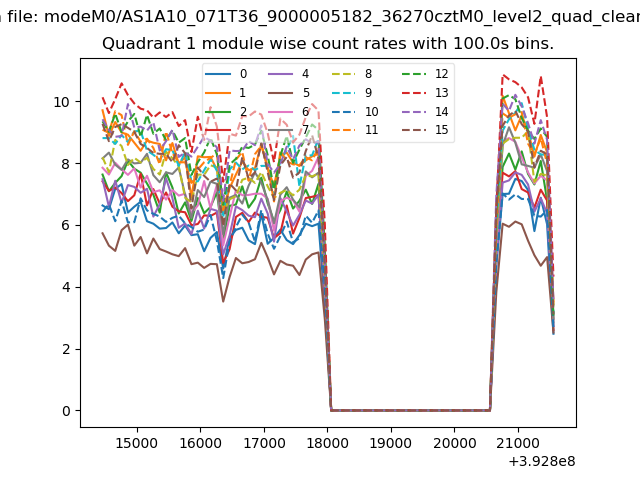
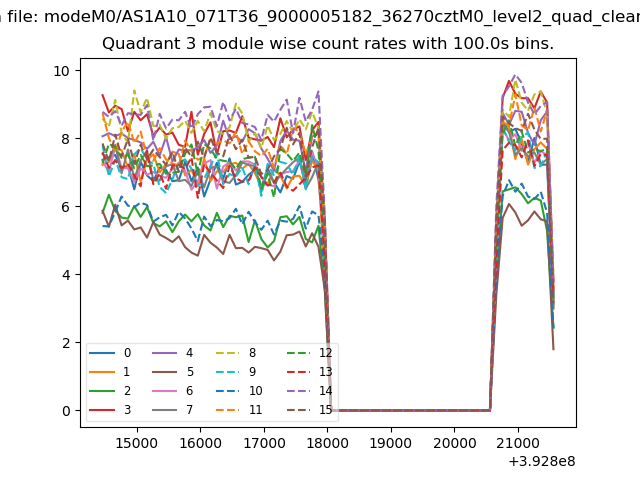
| Module-wise count rates for Quadrant A Data is divided into 100 sec bins |
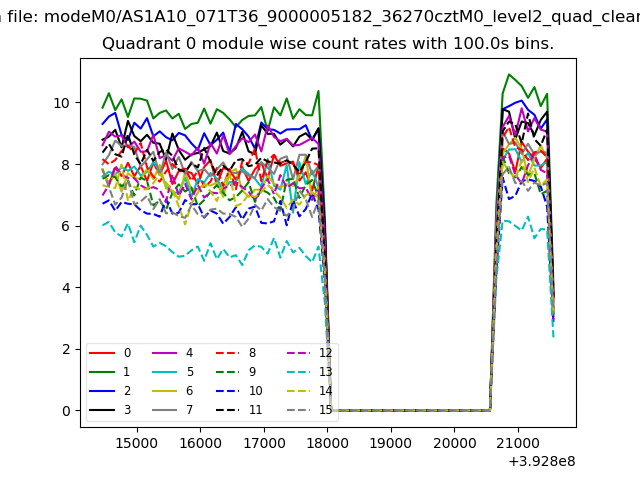 |
 |
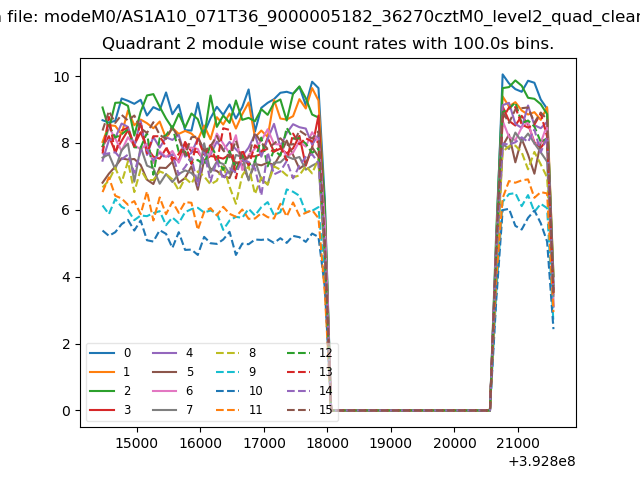
| Module-wise count rates for Quadrant B Data is divided into 100 sec bins |
 |
 |
| Module-wise count rates for Quadrant C Data is divided into 100 sec bins |
 |
 |
| Module-wise count rates for Quadrant D Data is divided into 100 sec bins |
 |
 |
| Parameter | Plot |
|---|---|
| CZT HV Monitor | 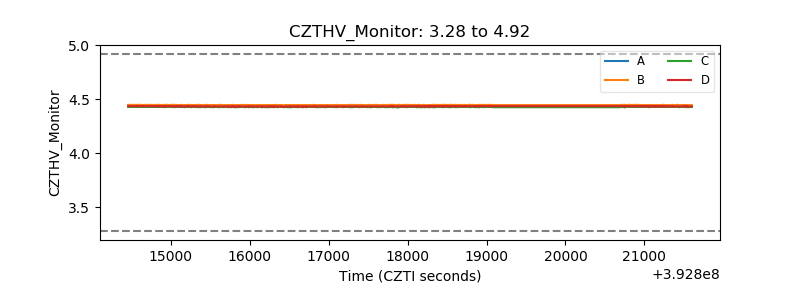 |
| D_VDD | 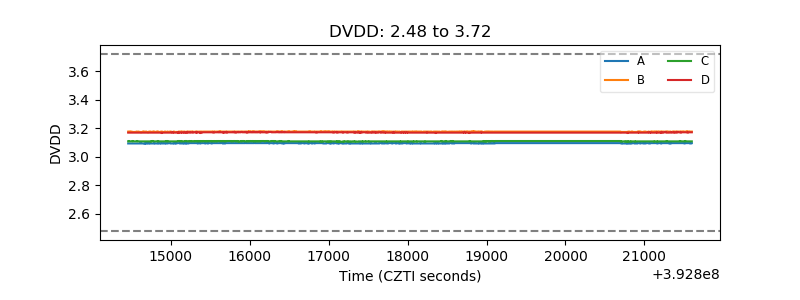 |
| Temperature 1 | 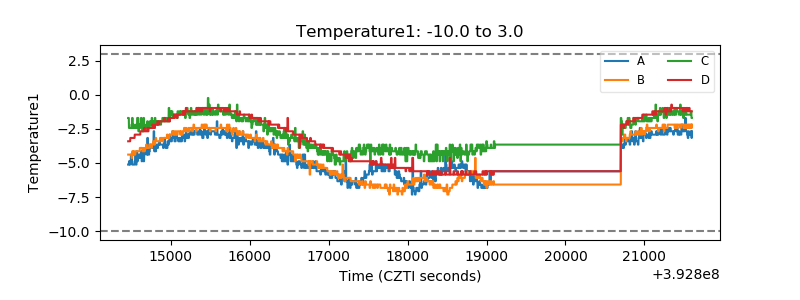 |
| Veto HV Monitor | 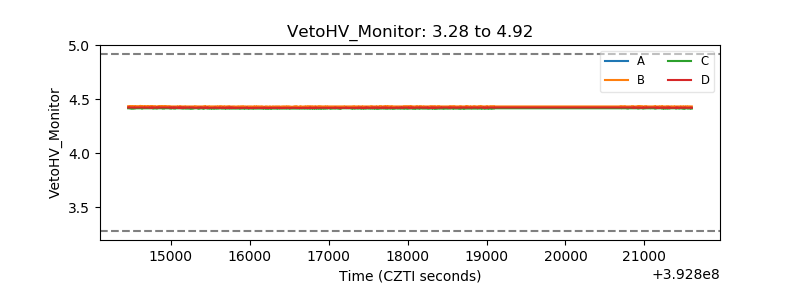 |
| Veto LLD | 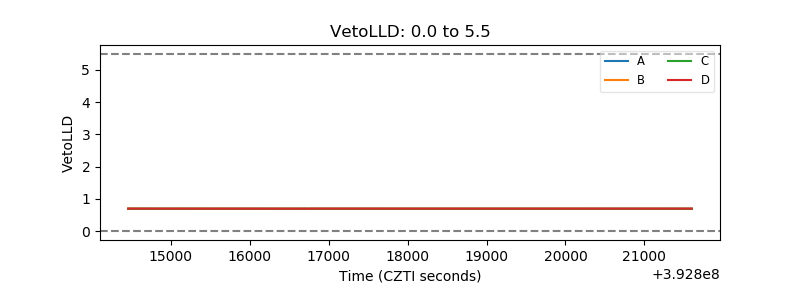 |
| Alpha Counter | 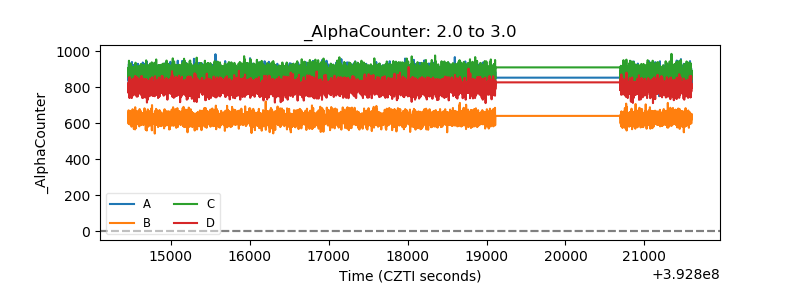 |
| _CPM_Rate | 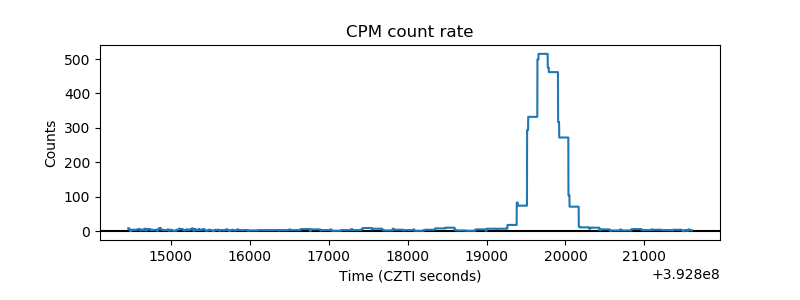 |
| CZT Counter | 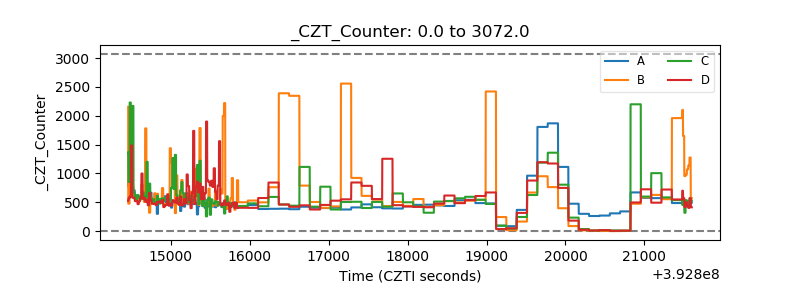 |
| +2.5 Volts monitor | 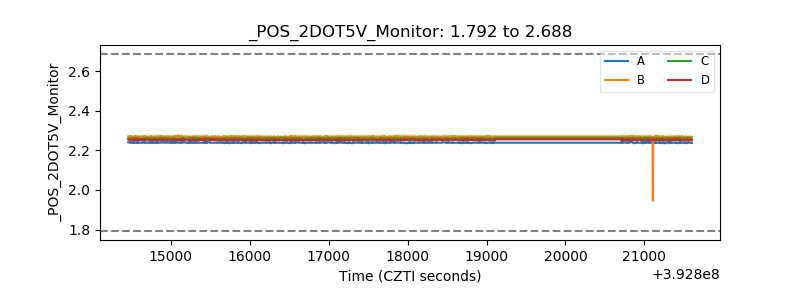 |
| +5 Volts monitor | 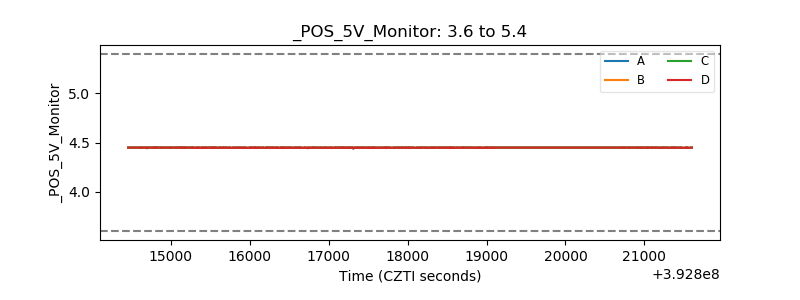 |
| _ROLL_ROT | 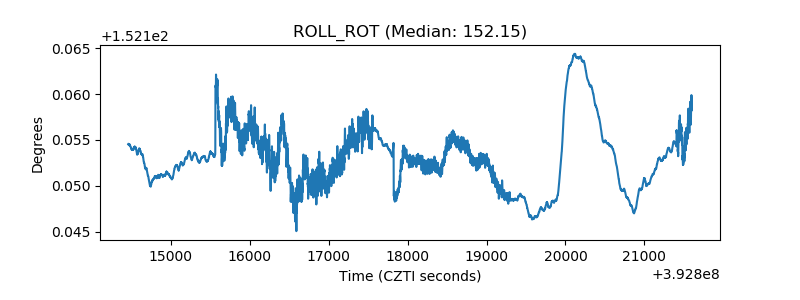 |
| _Roll_DEC | 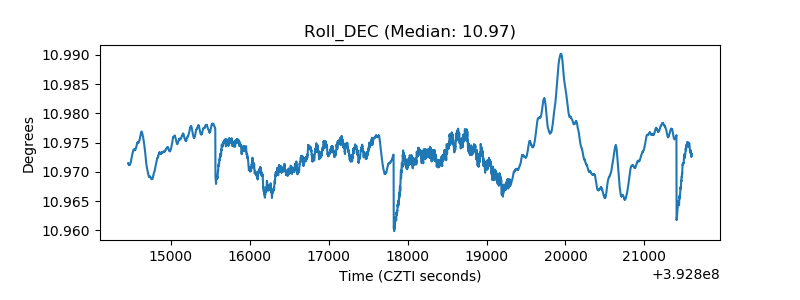 |
| _Roll_RA | 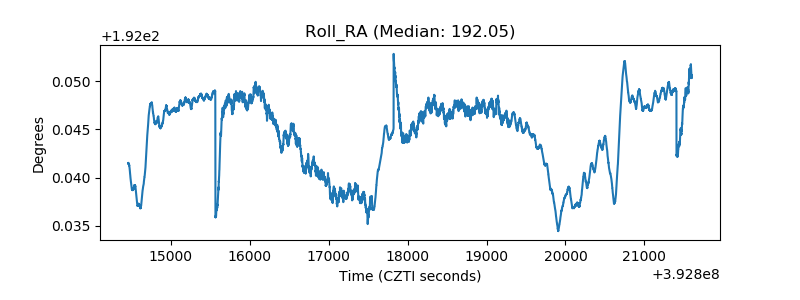 |
| Veto Counter | 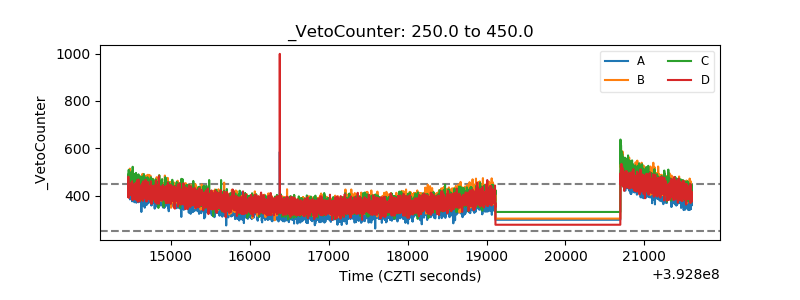 |