| Param | Original file | Final file |
|---|---|---|
| Filename | modeM0/AS1A10_071T36_9000005182_36267cztM0_level2.evt | modeM0/AS1A10_071T36_9000005182_36267cztM0_level2_quad_clean.evt |
| Size (bytes) | 555,197,760 | 86,402,880 |
| Size | 529.5 MB | 82.4 MB |
| Events in quadrant A | 3,255,237 | 556,886 |
| Events in quadrant B | 4,898,909 | 524,347 |
| Events in quadrant C | 3,719,147 | 549,172 |
| Events in quadrant D | 4,487,443 | 519,491 |
| Mode SS | |||
|---|---|---|---|
| Quadrant | BADHDUFLAG | Total packets | Discarded packets |
| A | 0 | 138 | 0 |
| B | 0 | 138 | 0 |
| C | 0 | 138 | 0 |
| D | 0 | 138 | 0 |
| Mode M9 | |||
|---|---|---|---|
| Quadrant | BADHDUFLAG | Total packets | Discarded packets |
| A | 0 | 26 | 0 |
| B | 0 | 26 | 0 |
| C | 0 | 26 | 0 |
| D | 0 | 26 | 0 |
| Mode M0 | |||
|---|---|---|---|
| Quadrant | BADHDUFLAG | Total packets | Discarded packets |
| A | 0 | 13773 | 3 |
| B | 0 | 18828 | 2 |
| C | 0 | 15034 | 2 |
| D | 0 | 17737 | 2 |
| Quadrant | Total seconds | Saturated seconds | Saturation percentage |
|---|---|---|---|
| A | 6689 | 12 | 0.179399% |
| B | 6689 | 550 | 8.222455% |
| C | 6689 | 58 | 0.867095% |
| D | 6689 | 169 | 2.526536% |
Noise dominated data is calculated using 1-second bins in cleaned event files. If a bin has >2000 counts, and if more than 50% of those come from <1% of pixels, then it is considered to be noise-dominated and hence unusable.
| Quadrant | # 1 sec bins | Bins with >0 counts | Bins with >2000 counts | High rate bins dominated by noise | Noise dominated (total time) | Noise dominated (detector-on time) | Marked lightcurve |
|---|---|---|---|---|---|---|---|
| A | 9315 | 6691 | 1 | 1 | 0.01% | 0.01% | 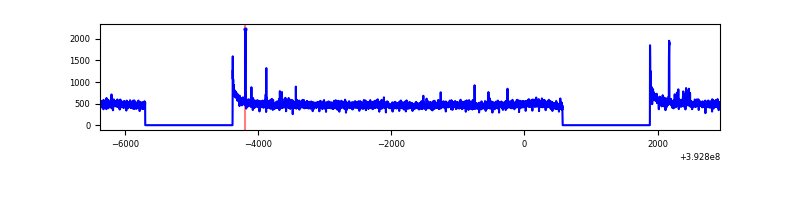 |
| B | 9315 | 6691 | 433 | 433 | 4.65% | 6.47% | 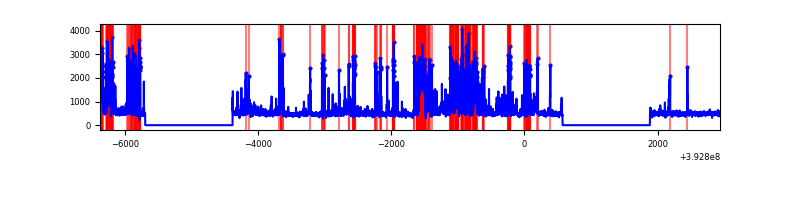 |
| C | 9315 | 6691 | 44 | 44 | 0.47% | 0.66% | 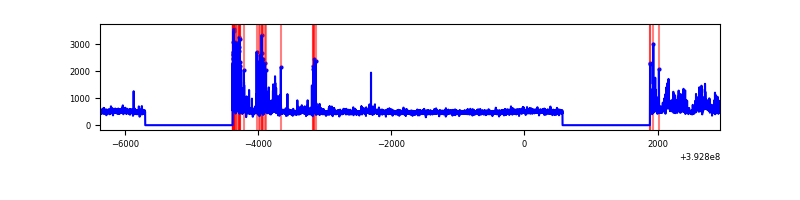 |
| D | 9315 | 6691 | 149 | 149 | 1.60% | 2.23% | 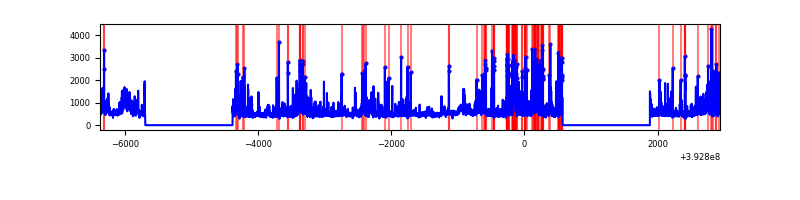 |
Top three noisy pixels from each quadrant. If the there are fewer than three noisy pixels in the level2.evt file, extra rows are filled as -1
| Pixel properties | Quadrant properties | ||||||
|---|---|---|---|---|---|---|---|
| Quadrant | DetID | PixID | Counts | Sigma | Mean | Median | Sigma |
| A | 10 | 83 | 196222 | 1226.43 | 781 | 765 | 159.4 |
| A | 9 | 143 | 20511 | 123.9 | 781 | 765 | 159.4 |
| A | 12 | 189 | 16114 | 96.31 | 781 | 765 | 159.4 |
| B | 5 | 172 | 1552399 | 10780.51 | 746 | 727 | 143.9 |
| B | 5 | 236 | 172824 | 1195.67 | 746 | 727 | 143.9 |
| B | 8 | 128 | 82476 | 567.97 | 746 | 727 | 143.9 |
| C | 0 | 10 | 449624 | 2514.1 | 755 | 760 | 178.5 |
| C | 15 | 214 | 277748 | 1551.41 | 755 | 760 | 178.5 |
| C | 0 | 207 | 48614 | 268.03 | 755 | 760 | 178.5 |
| D | 12 | 6 | 589993 | 3233.84 | 747 | 727 | 182.2 |
| D | 13 | 171 | 390724 | 2140.27 | 747 | 727 | 182.2 |
| D | 13 | 249 | 210957 | 1153.72 | 747 | 727 | 182.2 |
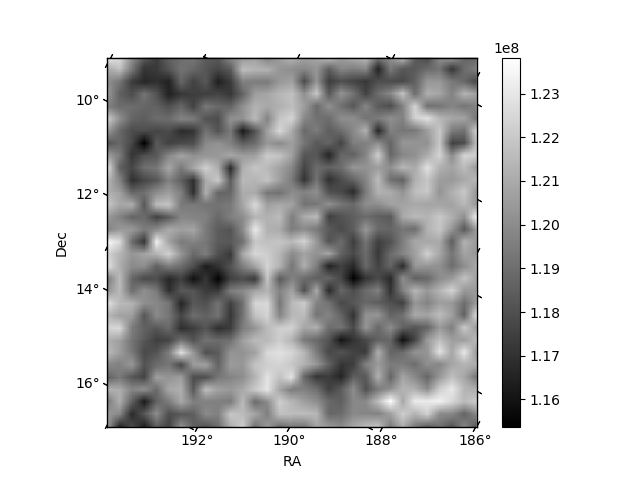
Histogram calculated using DETX and DETY for each event in the final _common_clean file
| Quadrant A | 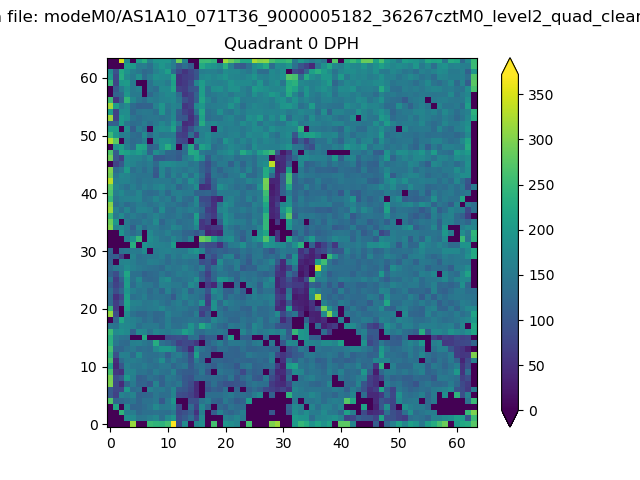 |
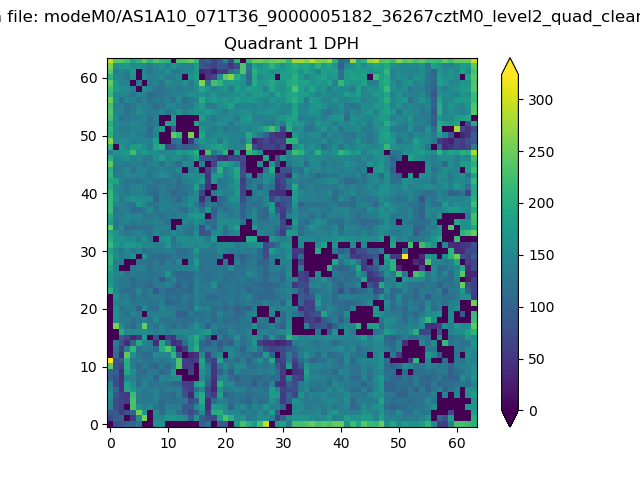 |
Quadrant B |
|---|---|---|---|
| Quadrant D | 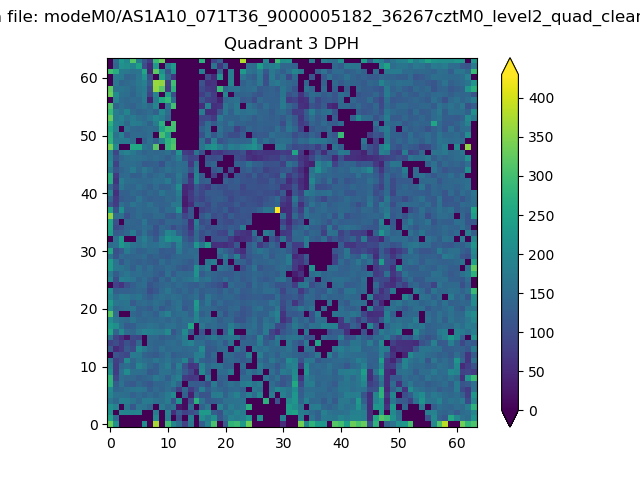 |
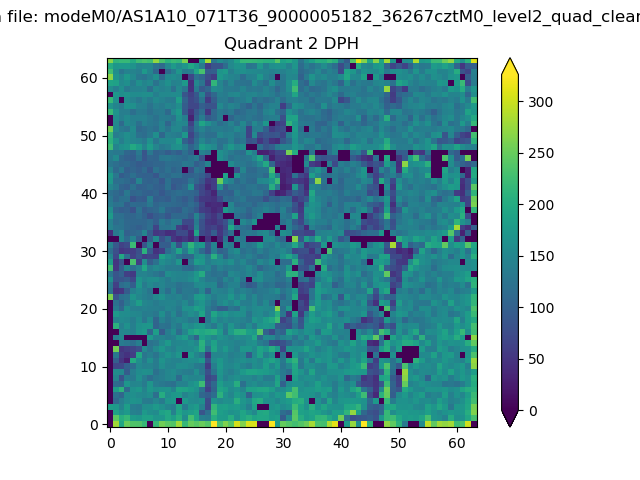 |
Quadrant C |
| Plot type | Count rate plots | Images |
|---|---|---|
| Comparison with Poisson distribution Blue bars denote a histogram of data divided into 1 sec bins. Red curve is a Poisson curve with rate = median count rate of data. |
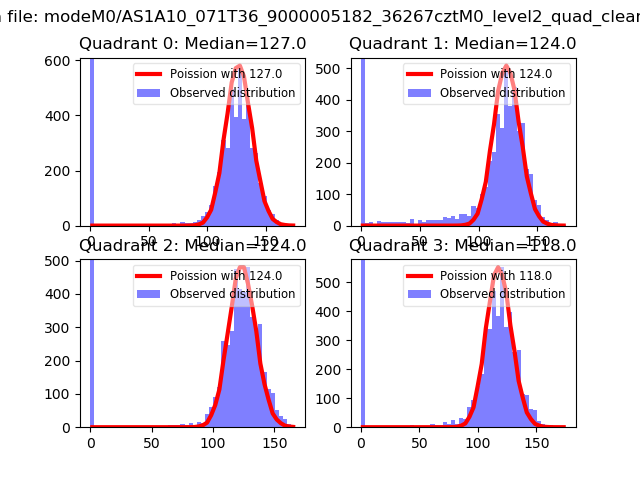 |
 |
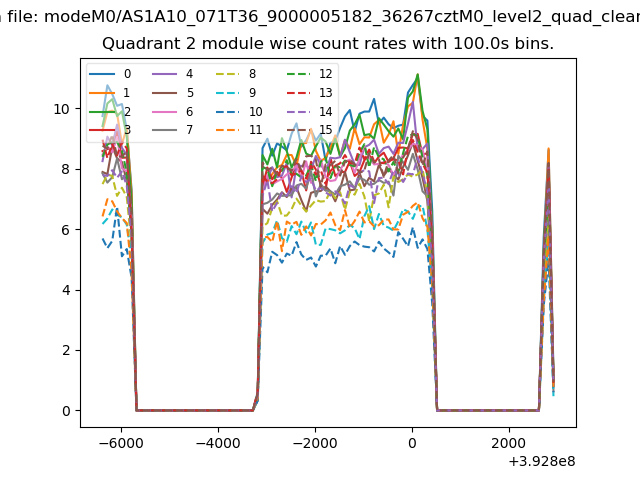
| Quadrant-wise count rates Data is divided into 100 sec bins |
 |
|
| Module-wise count rates for Quadrant A Data is divided into 100 sec bins |
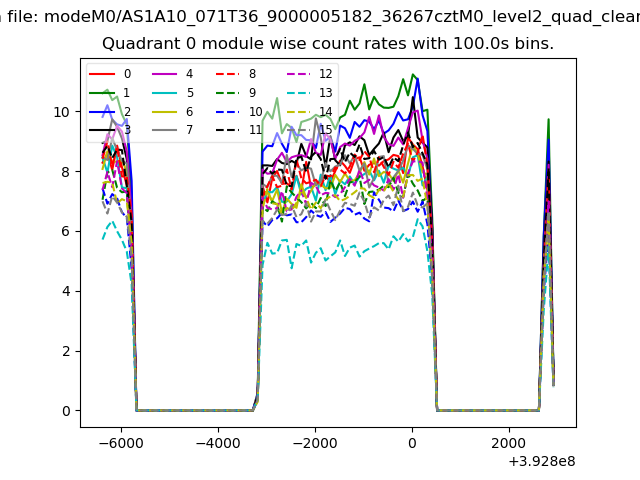 |
 |
| Module-wise count rates for Quadrant B Data is divided into 100 sec bins |
 |
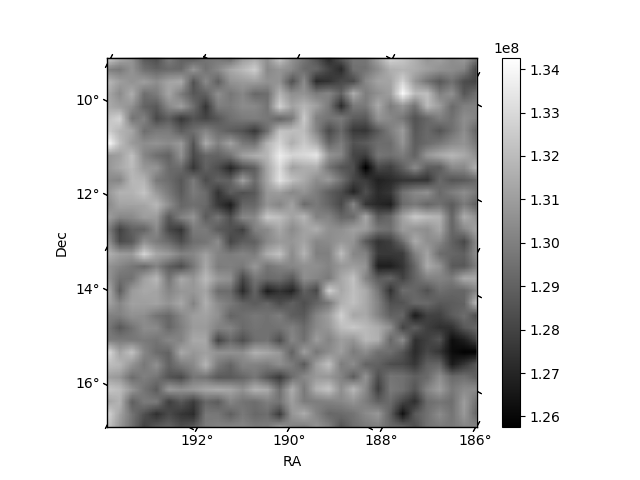 |
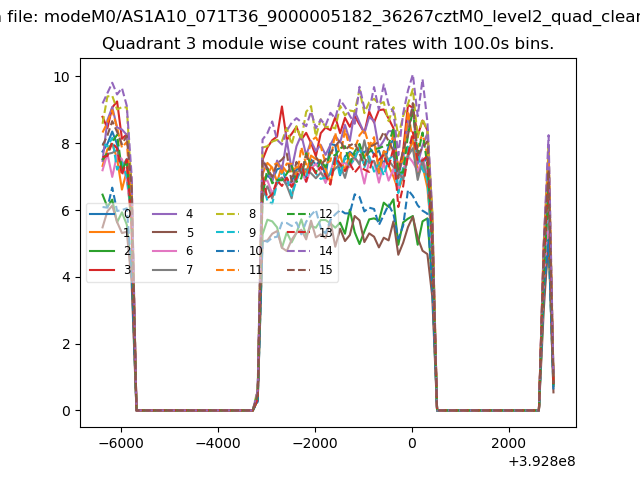
| Module-wise count rates for Quadrant C Data is divided into 100 sec bins |
 |
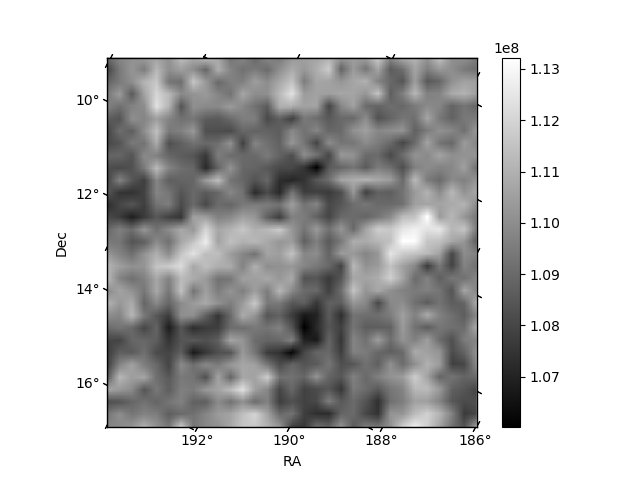 |
| Module-wise count rates for Quadrant D Data is divided into 100 sec bins |
 |
 |
| Parameter | Plot |
|---|---|
| CZT HV Monitor |  |
| D_VDD | 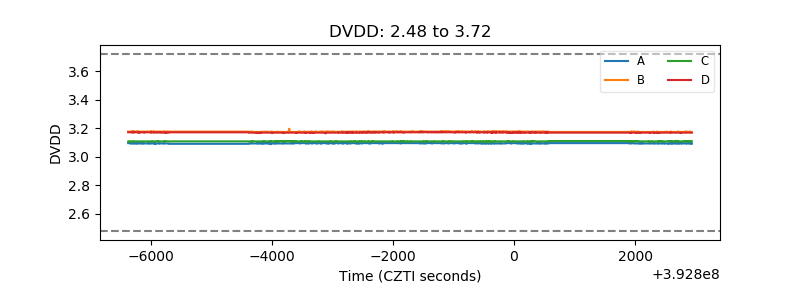 |
| Temperature 1 | 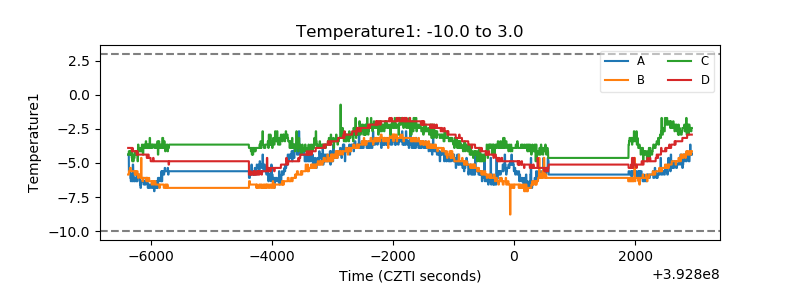 |
| Veto HV Monitor | 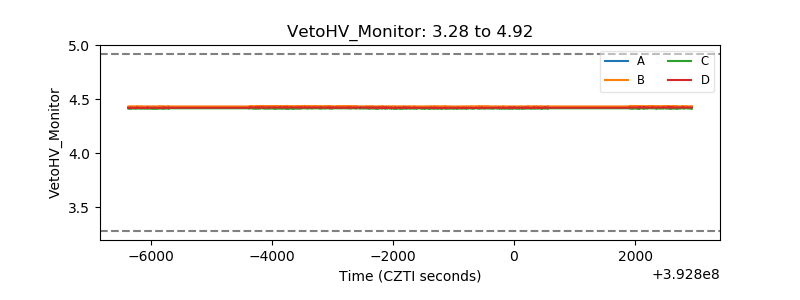 |
| Veto LLD | 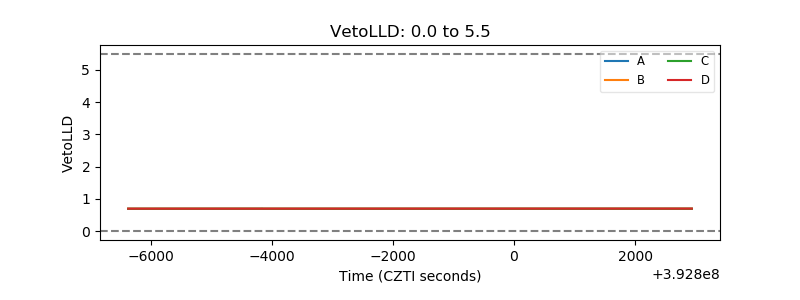 |
| Alpha Counter | 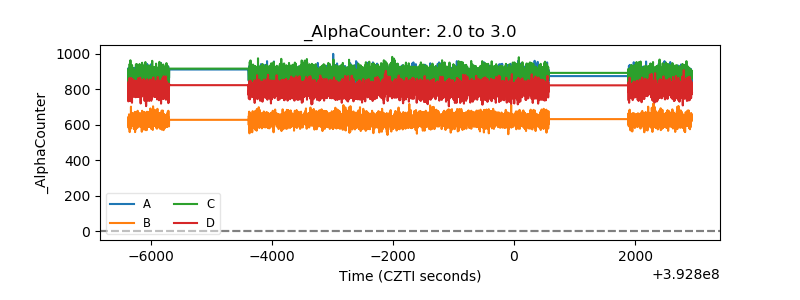 |
| _CPM_Rate | 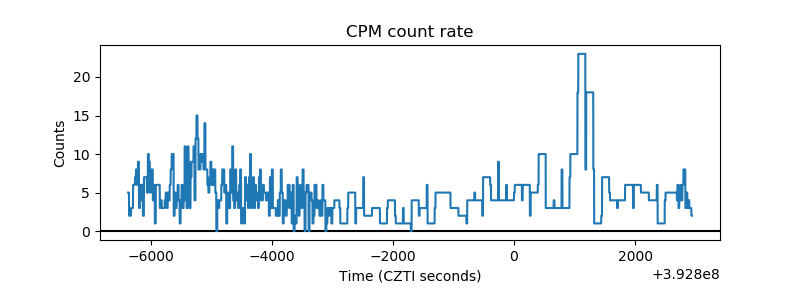 |
| CZT Counter | 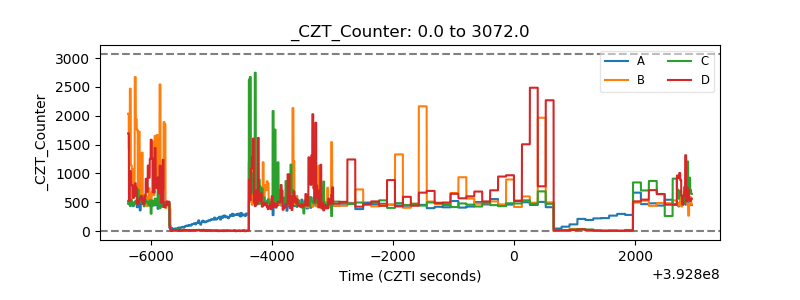 |
| +2.5 Volts monitor | 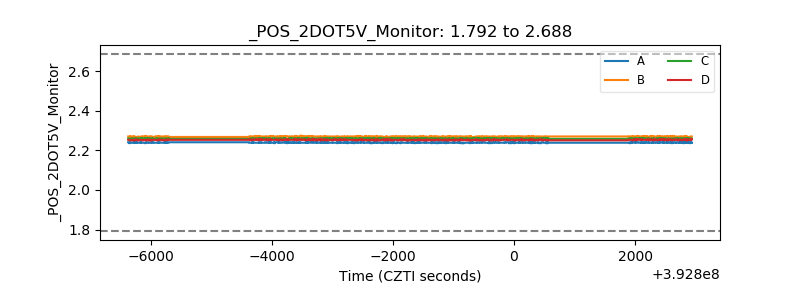 |
| +5 Volts monitor | 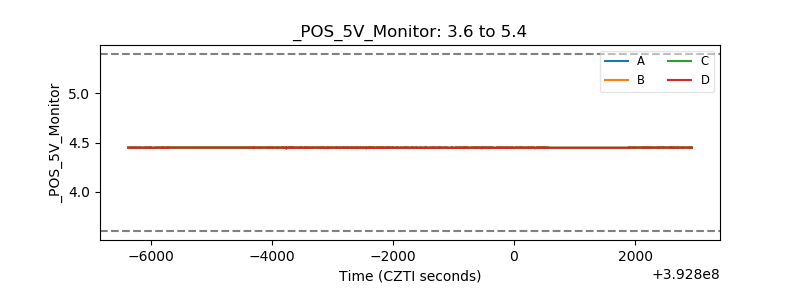 |
| _ROLL_ROT | 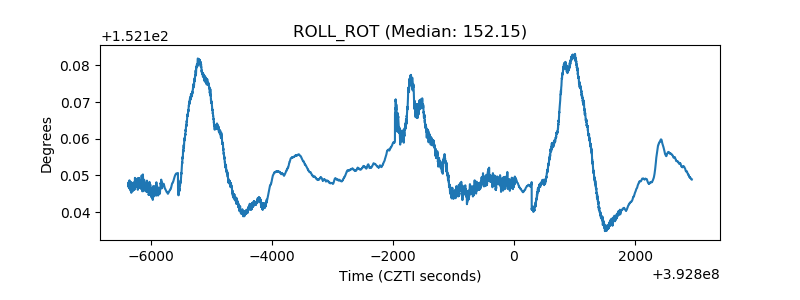 |
| _Roll_DEC | 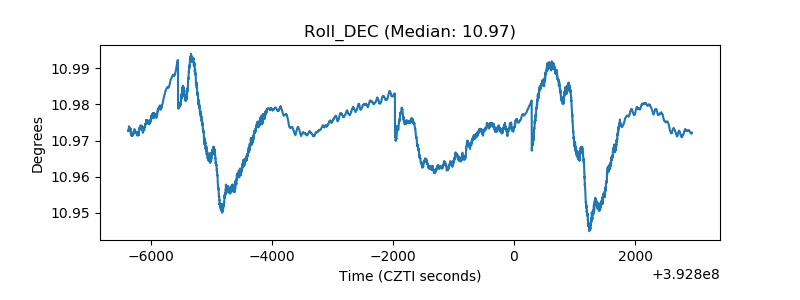 |
| _Roll_RA | 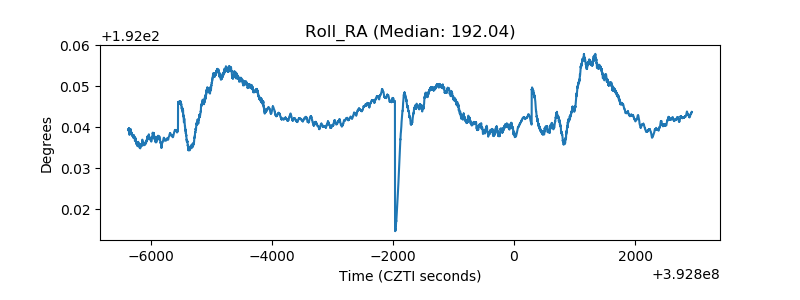 |
| Veto Counter | 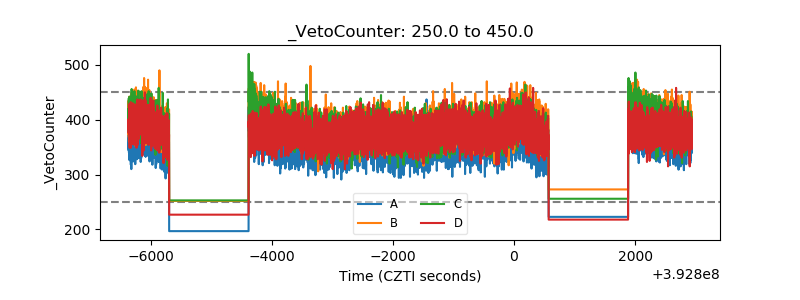 |