| Param | Original file | Final file |
|---|---|---|
| Filename | modeM0/AS1A10_071T36_9000005182_36266cztM0_level2.evt | modeM0/AS1A10_071T36_9000005182_36266cztM0_level2_quad_clean.evt |
| Size (bytes) | 535,124,160 | 77,489,280 |
| Size | 510.3 MB | 73.9 MB |
| Events in quadrant A | 3,195,909 | 488,171 |
| Events in quadrant B | 5,069,552 | 458,268 |
| Events in quadrant C | 3,444,482 | 483,774 |
| Events in quadrant D | 4,052,029 | 458,994 |
| Mode SS | |||
|---|---|---|---|
| Quadrant | BADHDUFLAG | Total packets | Discarded packets |
| A | 0 | 134 | 0 |
| B | 0 | 134 | 0 |
| C | 0 | 134 | 0 |
| D | 0 | 134 | 0 |
| Mode M9 | |||
|---|---|---|---|
| Quadrant | BADHDUFLAG | Total packets | Discarded packets |
| A | 0 | 28 | 0 |
| B | 0 | 28 | 0 |
| C | 0 | 28 | 0 |
| D | 0 | 28 | 0 |
| Mode M0 | |||
|---|---|---|---|
| Quadrant | BADHDUFLAG | Total packets | Discarded packets |
| A | 0 | 13516 | 3 |
| B | 0 | 19375 | 2 |
| C | 0 | 14038 | 2 |
| D | 0 | 16327 | 2 |
| Quadrant | Total seconds | Saturated seconds | Saturation percentage |
|---|---|---|---|
| A | 6556 | 21 | 0.320317% |
| B | 6556 | 574 | 8.755339% |
| C | 6556 | 62 | 0.945699% |
| D | 6556 | 73 | 1.113484% |
Noise dominated data is calculated using 1-second bins in cleaned event files. If a bin has >2000 counts, and if more than 50% of those come from <1% of pixels, then it is considered to be noise-dominated and hence unusable.
| Quadrant | # 1 sec bins | Bins with >0 counts | Bins with >2000 counts | High rate bins dominated by noise | Noise dominated (total time) | Noise dominated (detector-on time) | Marked lightcurve |
|---|---|---|---|---|---|---|---|
| A | 9332 | 6558 | 6 | 6 | 0.06% | 0.09% | 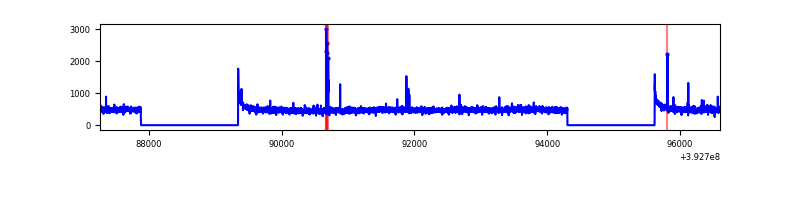 |
| B | 9332 | 6558 | 458 | 458 | 4.91% | 6.98% | 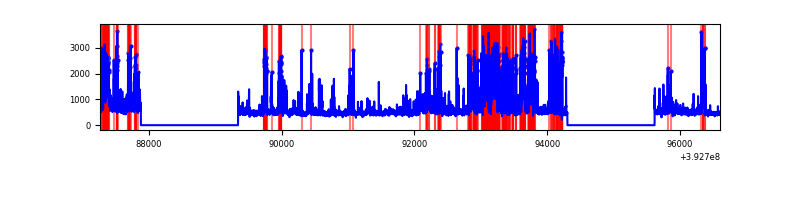 |
| C | 9332 | 6558 | 47 | 47 | 0.50% | 0.72% | 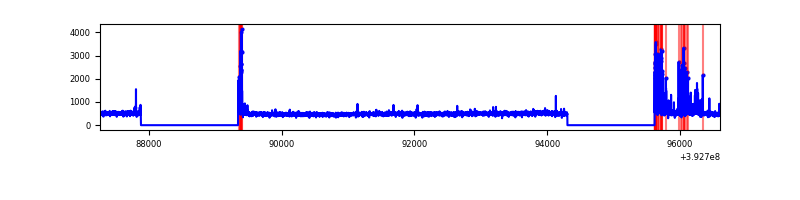 |
| D | 9332 | 6558 | 56 | 56 | 0.60% | 0.85% | 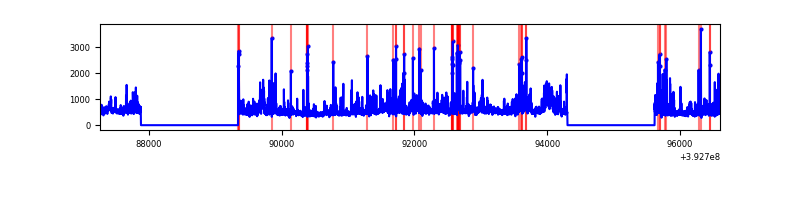 |
Top three noisy pixels from each quadrant. If the there are fewer than three noisy pixels in the level2.evt file, extra rows are filled as -1
| Pixel properties | Quadrant properties | ||||||
|---|---|---|---|---|---|---|---|
| Quadrant | DetID | PixID | Counts | Sigma | Mean | Median | Sigma |
| A | 10 | 83 | 195080 | 1250.71 | 762 | 745 | 155.4 |
| A | 9 | 143 | 48342 | 306.33 | 762 | 745 | 155.4 |
| A | 13 | 254 | 8527 | 50.08 | 762 | 745 | 155.4 |
| B | 5 | 172 | 1223412 | 8650.37 | 730 | 710 | 141.3 |
| B | 5 | 236 | 630086 | 4452.71 | 730 | 710 | 141.3 |
| B | 4 | 171 | 127639 | 898.0 | 730 | 710 | 141.3 |
| C | 15 | 214 | 272215 | 1553.01 | 740 | 747 | 174.8 |
| C | 0 | 10 | 264331 | 1507.9 | 740 | 747 | 174.8 |
| C | 0 | 207 | 26148 | 145.31 | 740 | 747 | 174.8 |
| D | 12 | 6 | 548206 | 2990.12 | 738 | 717 | 183.1 |
| D | 13 | 249 | 161992 | 880.81 | 738 | 717 | 183.1 |
| D | 13 | 171 | 119969 | 651.3 | 738 | 717 | 183.1 |
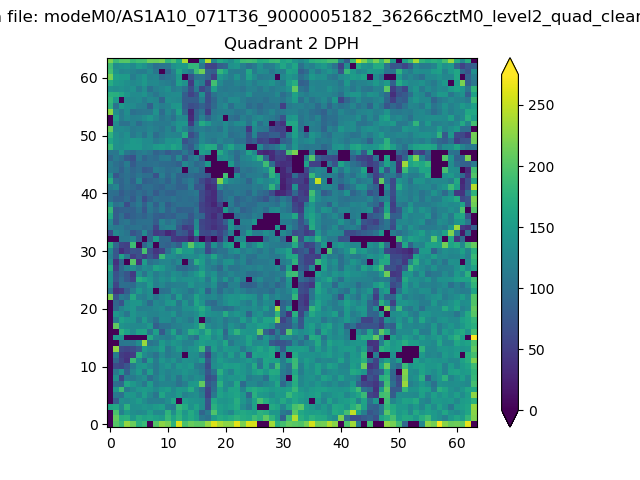
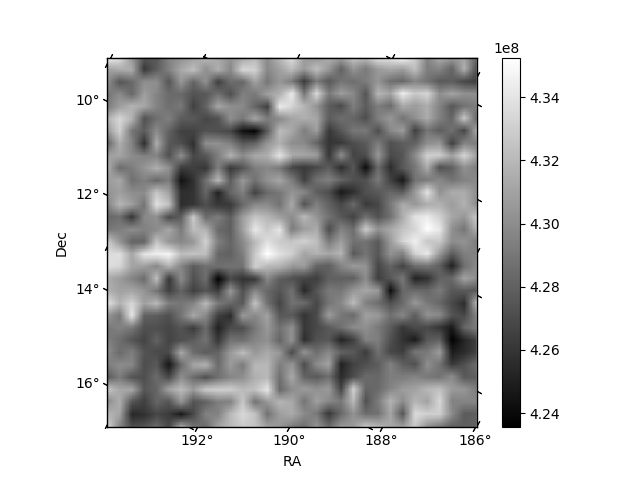
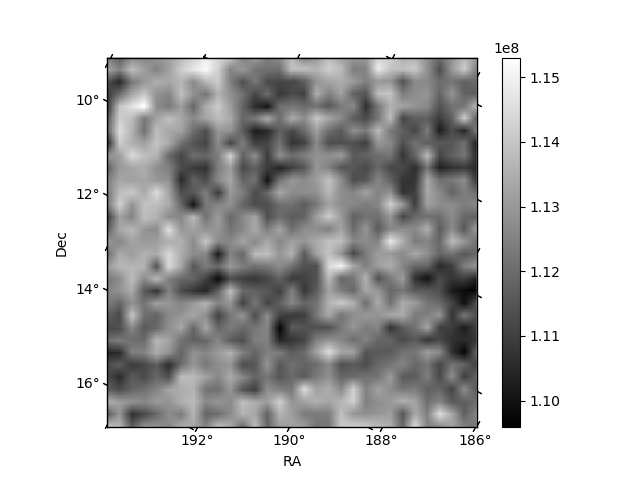
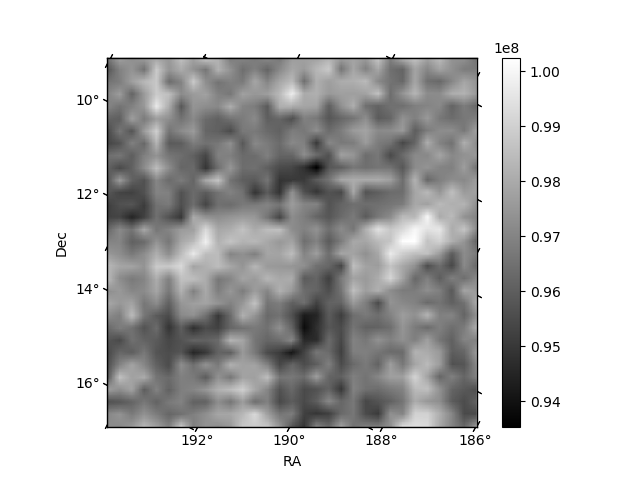
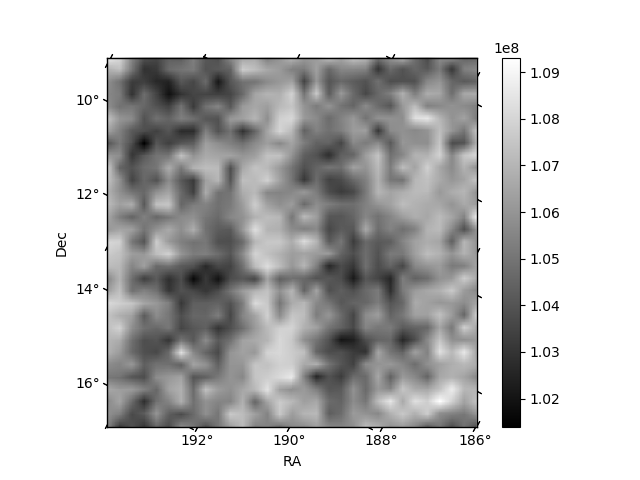
Histogram calculated using DETX and DETY for each event in the final _common_clean file
| Quadrant A | 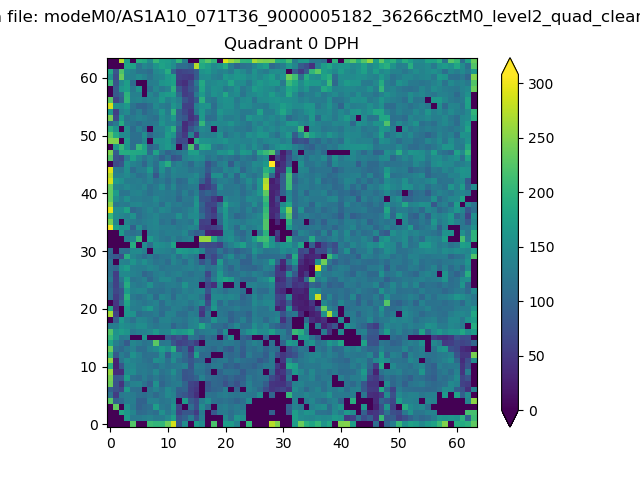 |
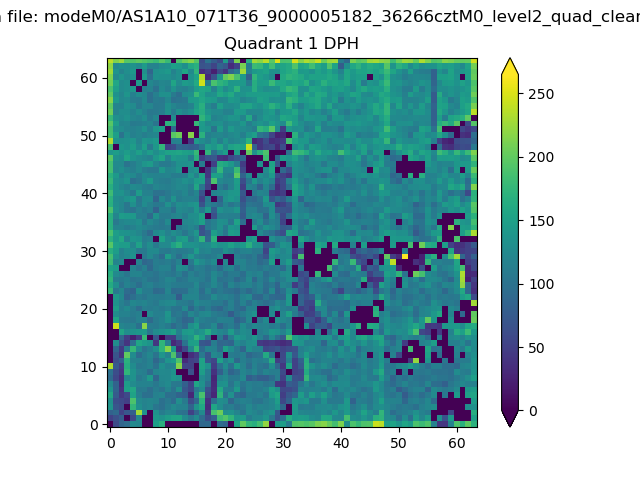 |
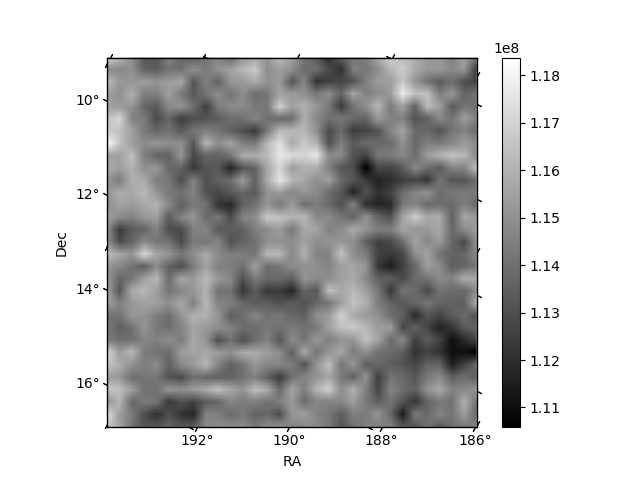
Quadrant B |
|---|---|---|---|
| Quadrant D | 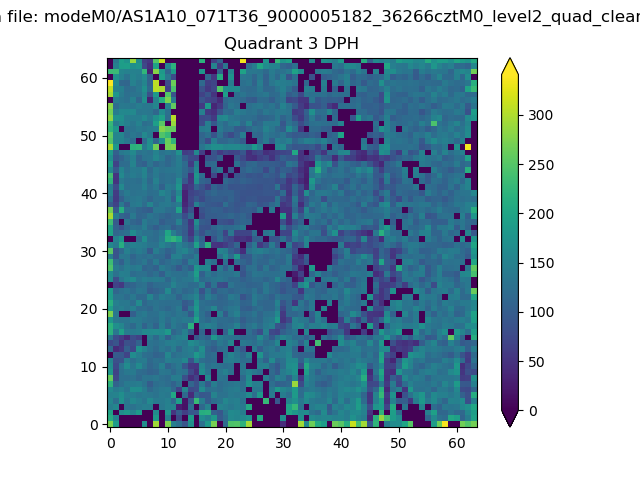 |
 |
Quadrant C |
| Plot type | Count rate plots | Images |
|---|---|---|
| Comparison with Poisson distribution Blue bars denote a histogram of data divided into 1 sec bins. Red curve is a Poisson curve with rate = median count rate of data. |
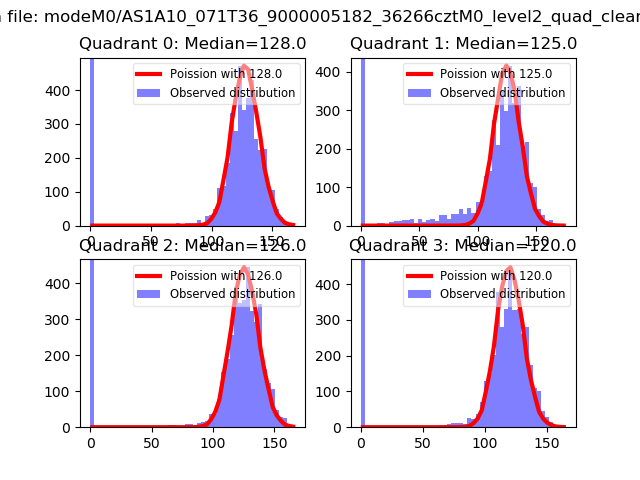 |
 |
| Quadrant-wise count rates Data is divided into 100 sec bins |
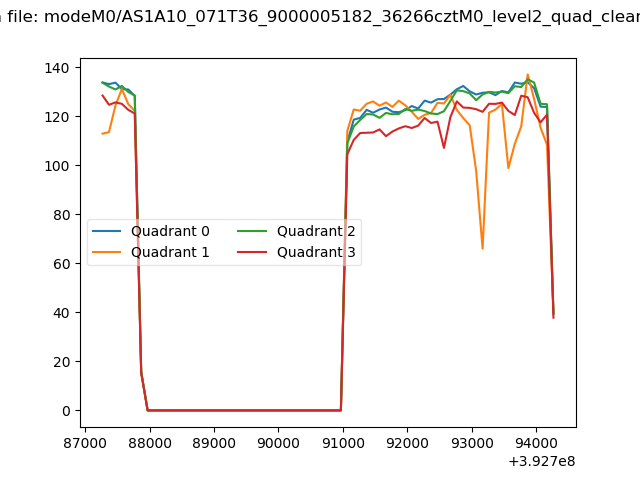 |
|
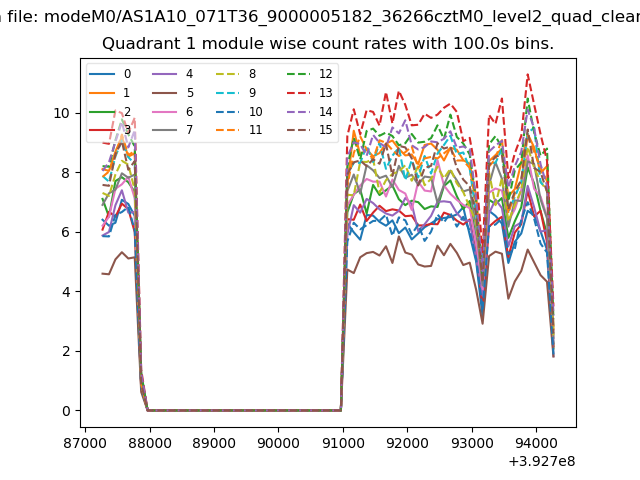
| Module-wise count rates for Quadrant A Data is divided into 100 sec bins |
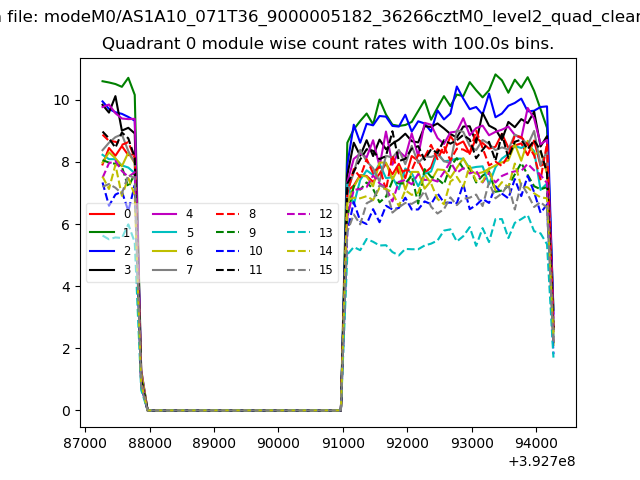 |
 |
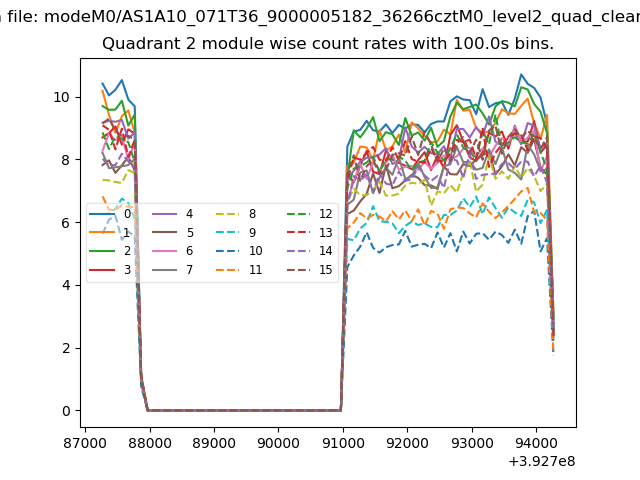
| Module-wise count rates for Quadrant B Data is divided into 100 sec bins |
 |
 |
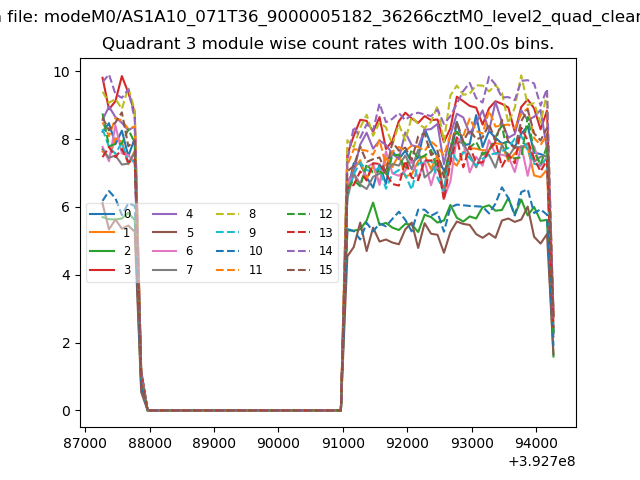
| Module-wise count rates for Quadrant C Data is divided into 100 sec bins |
 |
 |
| Module-wise count rates for Quadrant D Data is divided into 100 sec bins |
 |
 |
| Parameter | Plot |
|---|---|
| CZT HV Monitor | 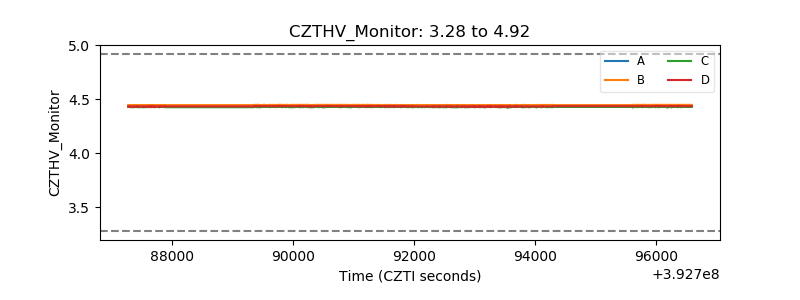 |
| D_VDD | 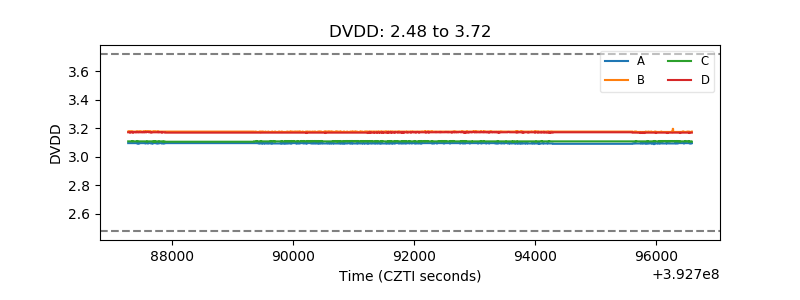 |
| Temperature 1 | 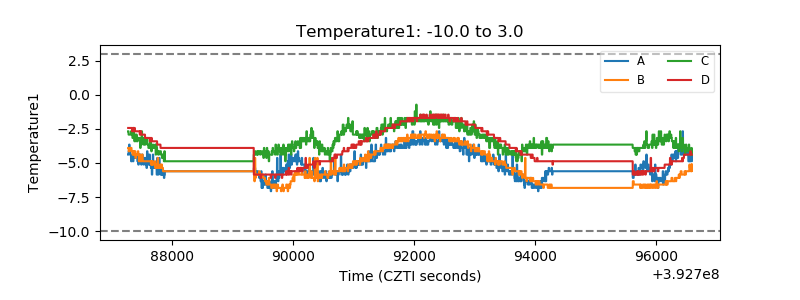 |
| Veto HV Monitor | 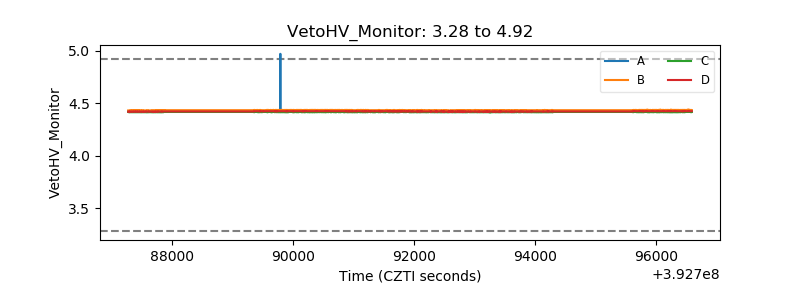 |
| Veto LLD | 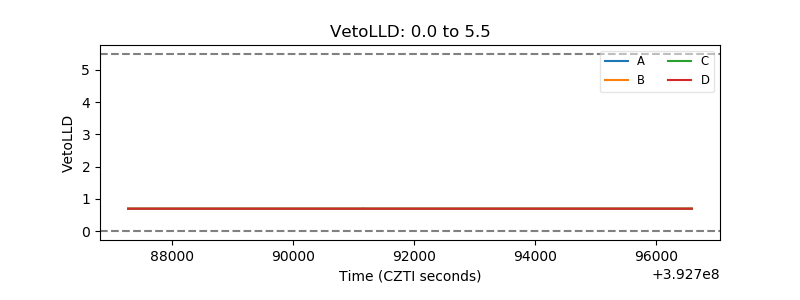 |
| Alpha Counter | 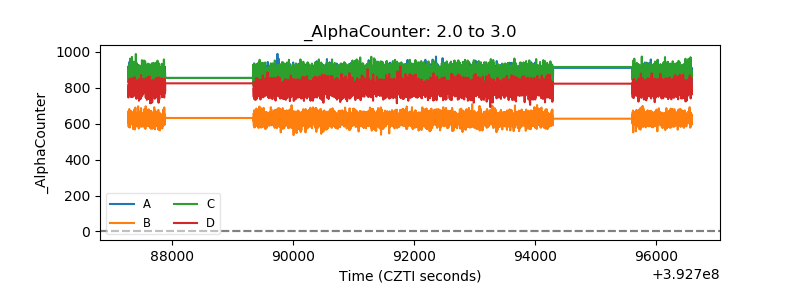 |
| _CPM_Rate | 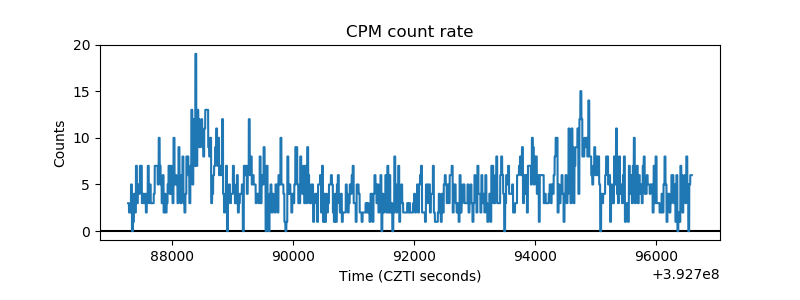 |
| CZT Counter | 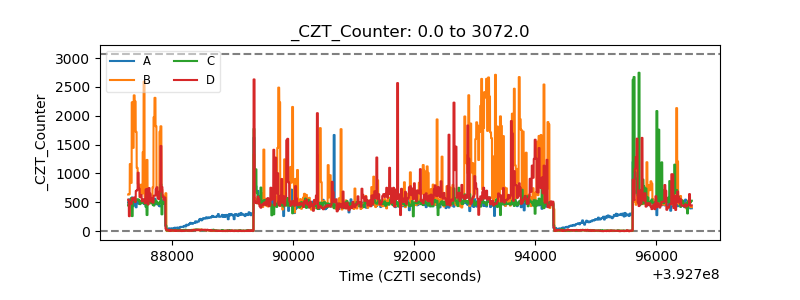 |
| +2.5 Volts monitor | 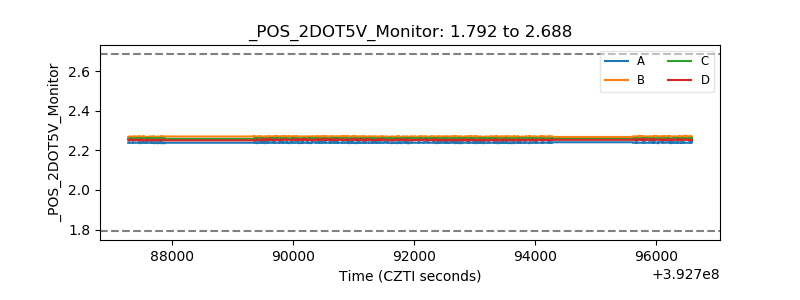 |
| +5 Volts monitor | 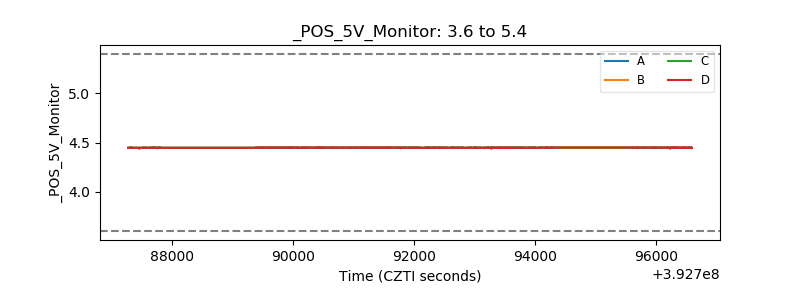 |
| _ROLL_ROT | 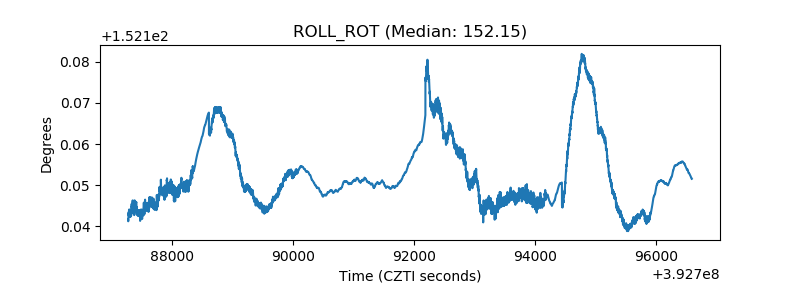 |
| _Roll_DEC | 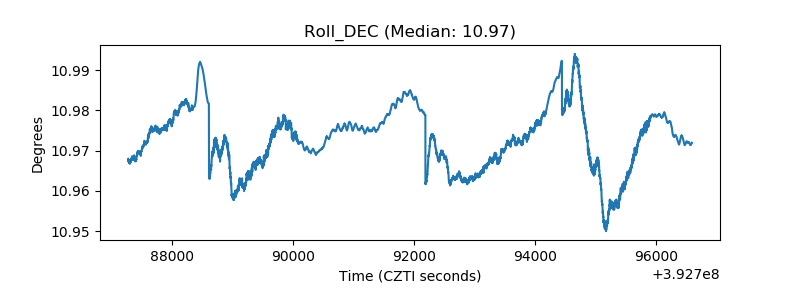 |
| _Roll_RA | 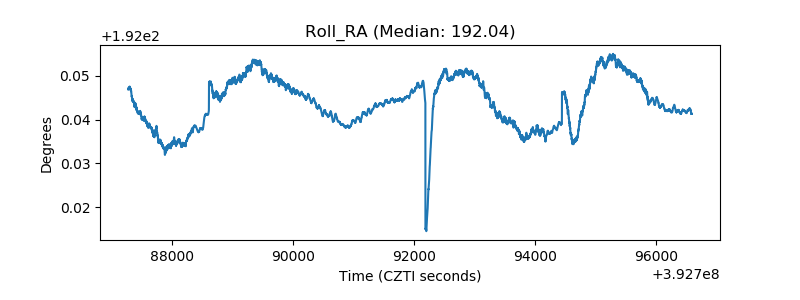 |
| Veto Counter | 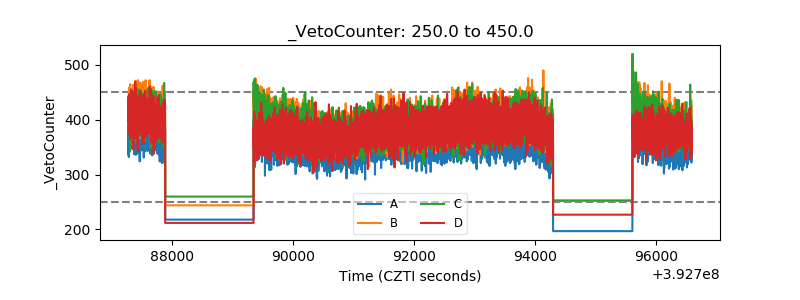 |