| Param | Original file | Final file |
|---|---|---|
| Filename | modeM0/AS1A10_071T36_9000005182_36265cztM0_level2.evt | modeM0/AS1A10_071T36_9000005182_36265cztM0_level2_quad_clean.evt |
| Size (bytes) | 531,763,200 | 66,415,680 |
| Size | 507.1 MB | 63.3 MB |
| Events in quadrant A | 3,001,960 | 409,893 |
| Events in quadrant B | 5,539,022 | 380,118 |
| Events in quadrant C | 3,191,953 | 405,933 |
| Events in quadrant D | 3,952,225 | 382,938 |
| Mode SS | |||
|---|---|---|---|
| Quadrant | BADHDUFLAG | Total packets | Discarded packets |
| A | 0 | 126 | 0 |
| B | 0 | 126 | 0 |
| C | 0 | 126 | 0 |
| D | 0 | 126 | 0 |
| Mode M9 | |||
|---|---|---|---|
| Quadrant | BADHDUFLAG | Total packets | Discarded packets |
| A | 0 | 33 | 0 |
| B | 0 | 33 | 0 |
| C | 0 | 33 | 0 |
| D | 0 | 33 | 0 |
| Mode M0 | |||
|---|---|---|---|
| Quadrant | BADHDUFLAG | Total packets | Discarded packets |
| A | 0 | 12683 | 3 |
| B | 0 | 20562 | 2 |
| C | 0 | 12997 | 2 |
| D | 0 | 15910 | 2 |
| Quadrant | Total seconds | Saturated seconds | Saturation percentage |
|---|---|---|---|
| A | 6191 | 14 | 0.226135% |
| B | 6191 | 822 | 13.277338% |
| C | 6191 | 34 | 0.549184% |
| D | 6191 | 125 | 2.019060% |
Noise dominated data is calculated using 1-second bins in cleaned event files. If a bin has >2000 counts, and if more than 50% of those come from <1% of pixels, then it is considered to be noise-dominated and hence unusable.
| Quadrant | # 1 sec bins | Bins with >0 counts | Bins with >2000 counts | High rate bins dominated by noise | Noise dominated (total time) | Noise dominated (detector-on time) | Marked lightcurve |
|---|---|---|---|---|---|---|---|
| A | 9447 | 6193 | 1 | 1 | 0.01% | 0.02% | 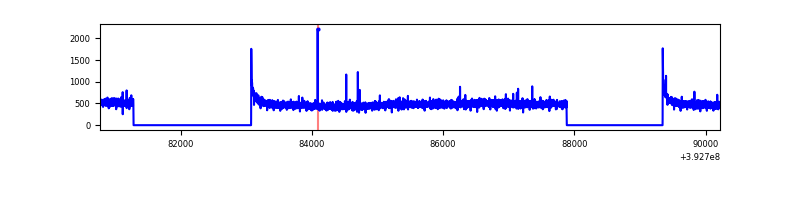 |
| B | 9447 | 6193 | 635 | 635 | 6.72% | 10.25% | 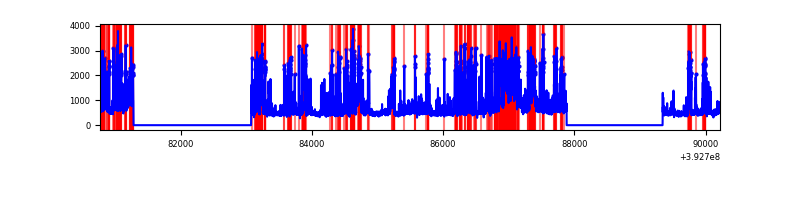 |
| C | 9447 | 6193 | 21 | 21 | 0.22% | 0.34% | 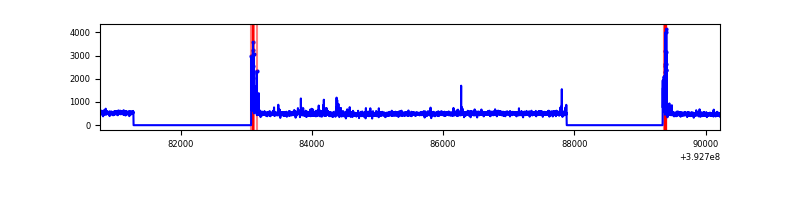 |
| D | 9447 | 6193 | 105 | 105 | 1.11% | 1.70% | 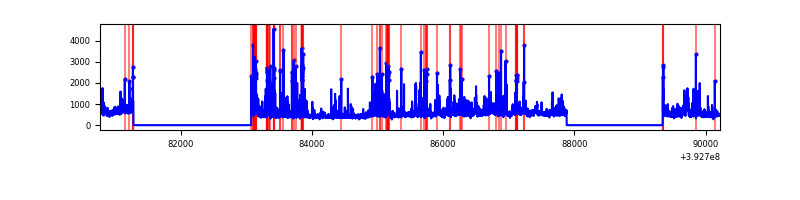 |
Top three noisy pixels from each quadrant. If the there are fewer than three noisy pixels in the level2.evt file, extra rows are filled as -1
| Pixel properties | Quadrant properties | ||||||
|---|---|---|---|---|---|---|---|
| Quadrant | DetID | PixID | Counts | Sigma | Mean | Median | Sigma |
| A | 10 | 83 | 192099 | 1300.48 | 724 | 709 | 147.2 |
| A | 13 | 254 | 8857 | 55.37 | 724 | 709 | 147.2 |
| A | 3 | 137 | 7705 | 47.54 | 724 | 709 | 147.2 |
| B | 5 | 172 | 1451920 | 10997.59 | 683 | 664 | 132.0 |
| B | 4 | 171 | 935557 | 7084.6 | 683 | 664 | 132.0 |
| B | 5 | 236 | 341111 | 2579.9 | 683 | 664 | 132.0 |
| C | 15 | 214 | 260399 | 1576.14 | 703 | 709 | 164.8 |
| C | 0 | 10 | 171263 | 1035.15 | 703 | 709 | 164.8 |
| C | 15 | 208 | 15529 | 89.95 | 703 | 709 | 164.8 |
| D | 12 | 6 | 548539 | 3165.84 | 697 | 677 | 173.1 |
| D | 12 | 235 | 146083 | 840.23 | 697 | 677 | 173.1 |
| D | 13 | 171 | 135123 | 776.9 | 697 | 677 | 173.1 |
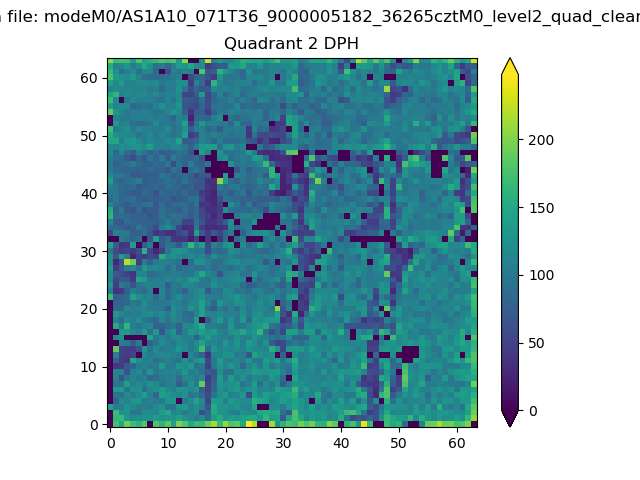
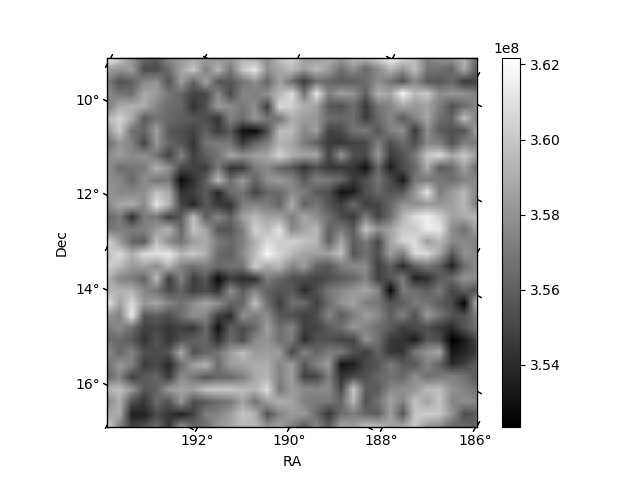
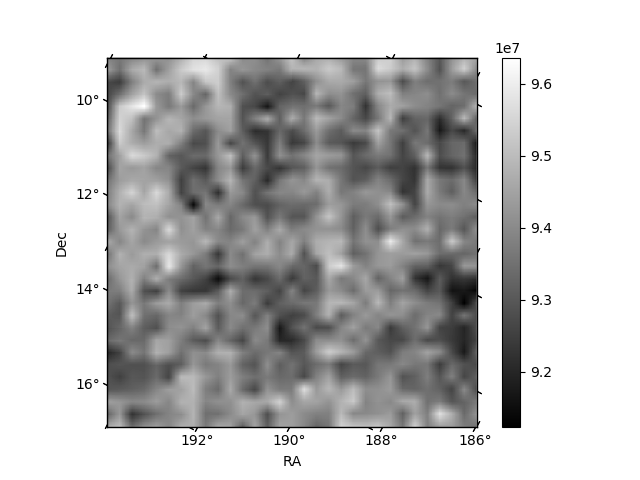
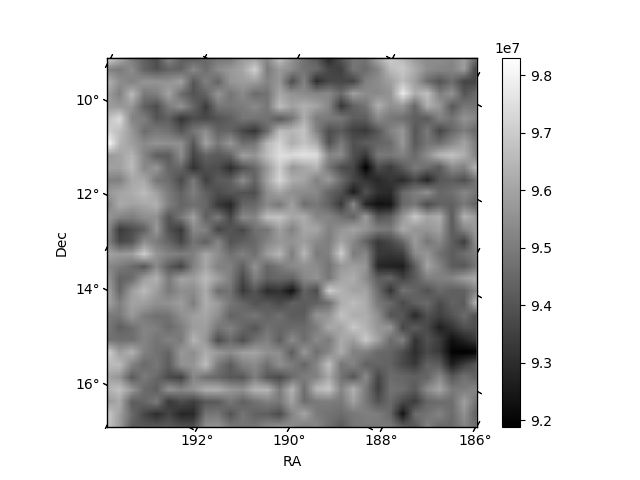
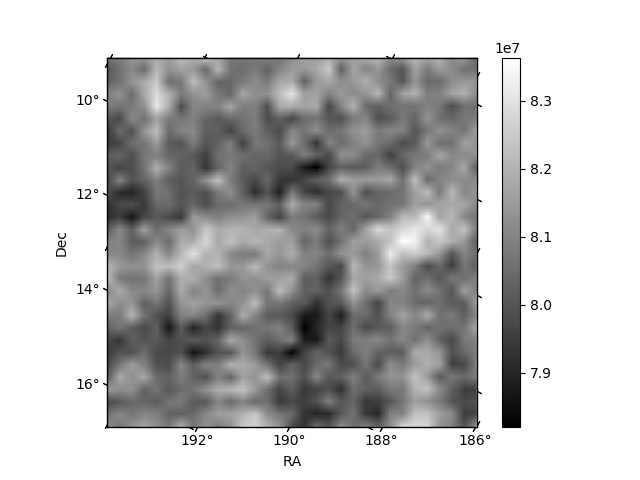
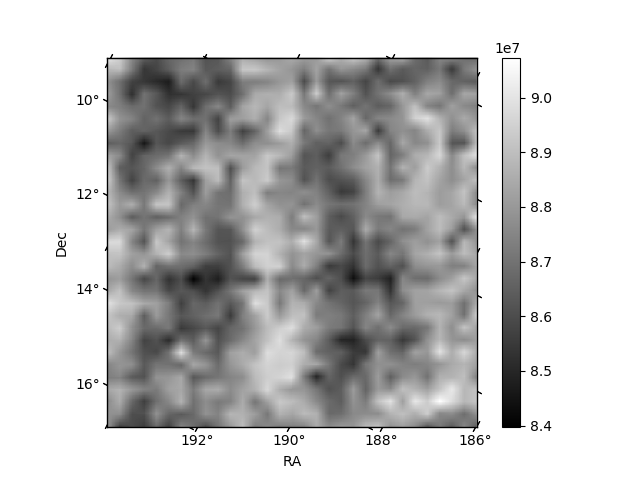
Histogram calculated using DETX and DETY for each event in the final _common_clean file
| Quadrant A | 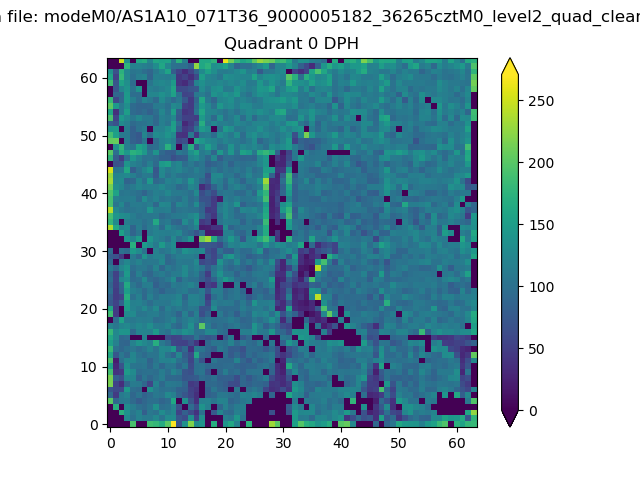 |
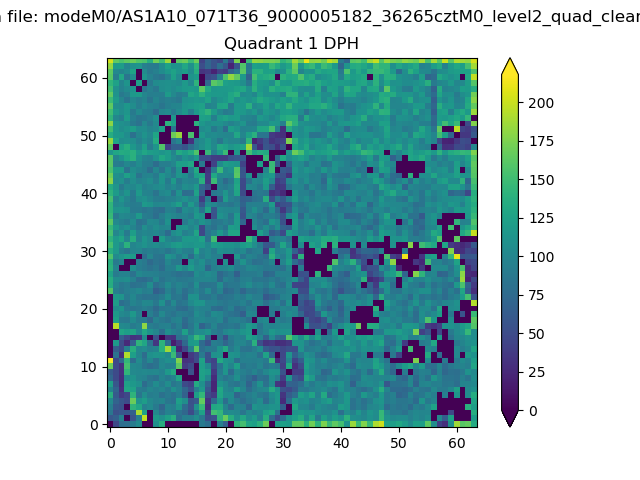 |
Quadrant B |
|---|---|---|---|
| Quadrant D | 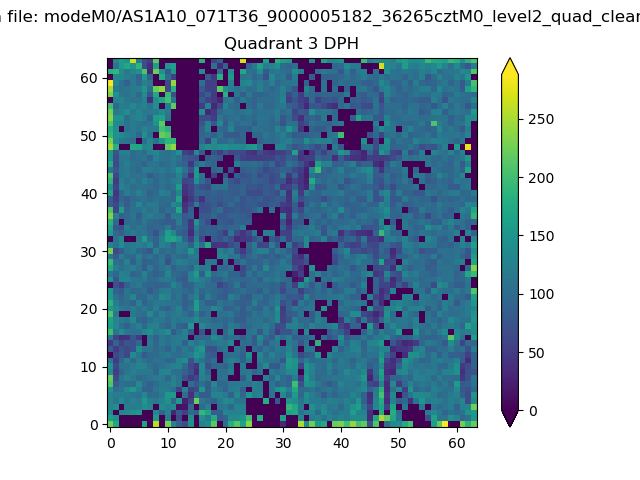 |
 |
Quadrant C |
| Plot type | Count rate plots | Images |
|---|---|---|
| Comparison with Poisson distribution Blue bars denote a histogram of data divided into 1 sec bins. Red curve is a Poisson curve with rate = median count rate of data. |
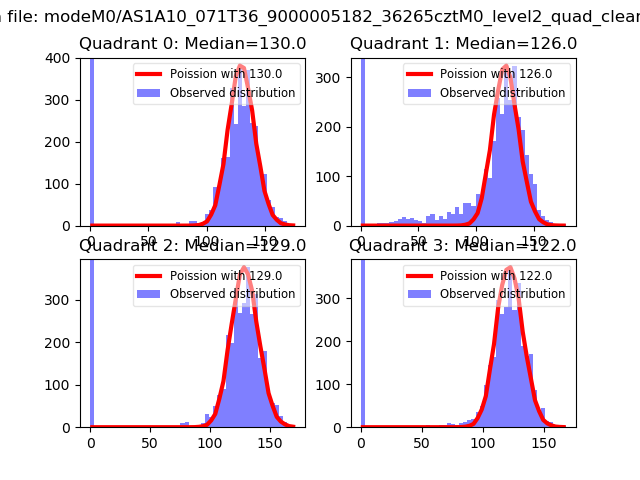 |
 |
| Quadrant-wise count rates Data is divided into 100 sec bins |
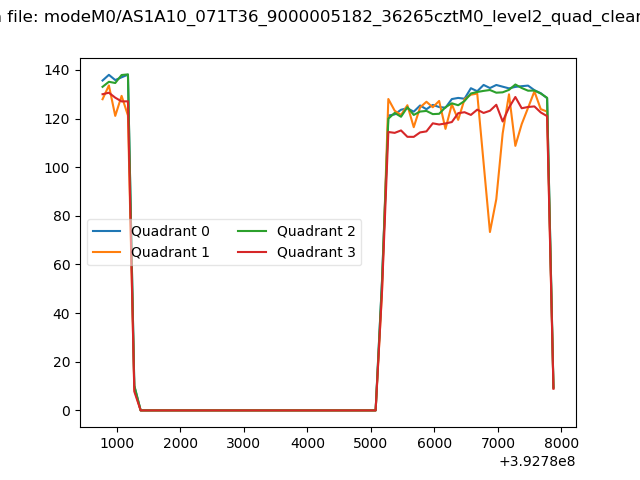 |
|
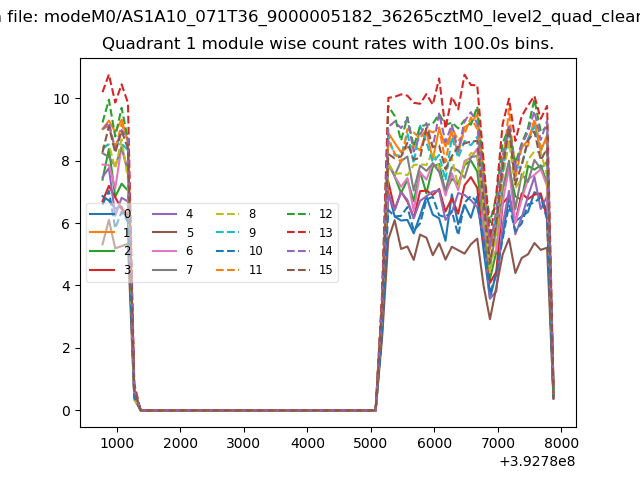
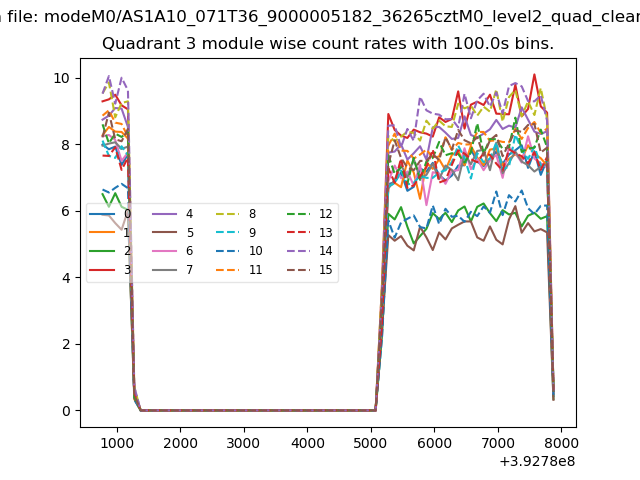
| Module-wise count rates for Quadrant A Data is divided into 100 sec bins |
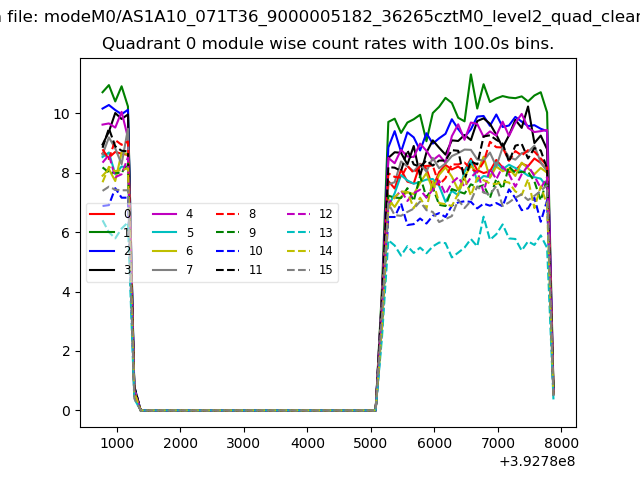 |
 |
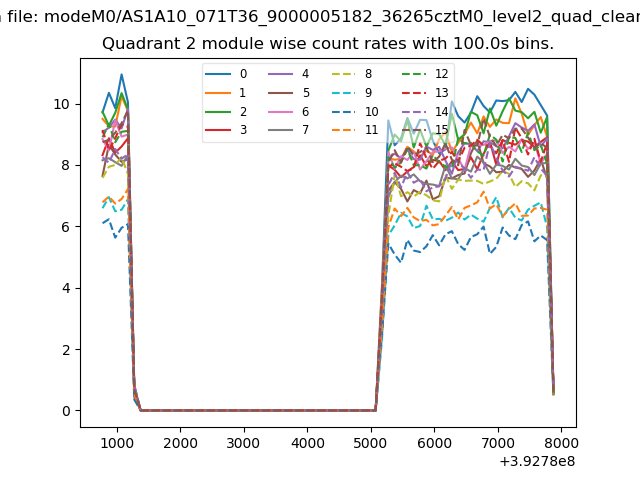
| Module-wise count rates for Quadrant B Data is divided into 100 sec bins |
 |
 |
| Module-wise count rates for Quadrant C Data is divided into 100 sec bins |
 |
 |
| Module-wise count rates for Quadrant D Data is divided into 100 sec bins |
 |
 |
| Parameter | Plot |
|---|---|
| CZT HV Monitor | 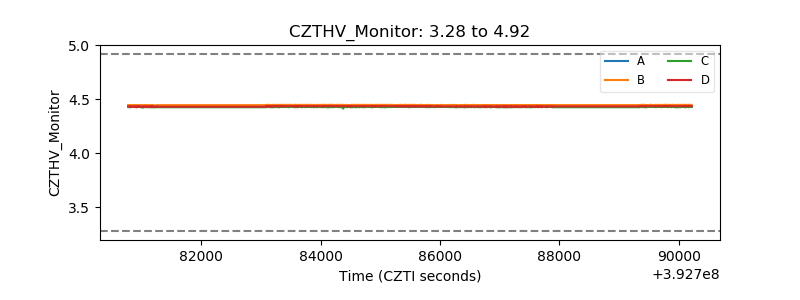 |
| D_VDD | 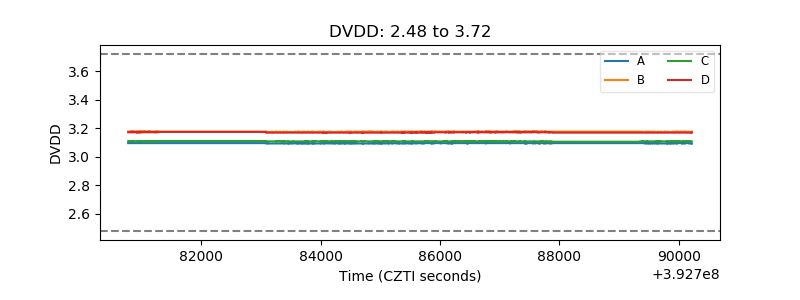 |
| Temperature 1 | 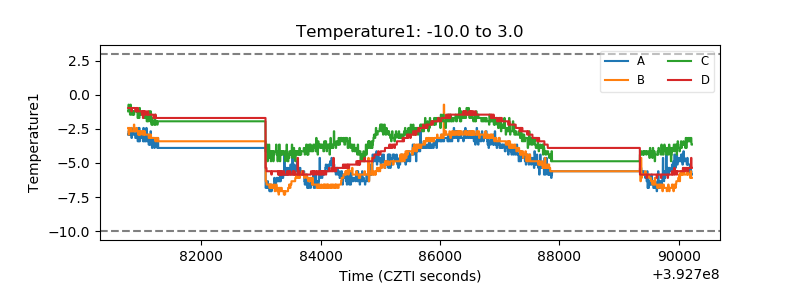 |
| Veto HV Monitor | 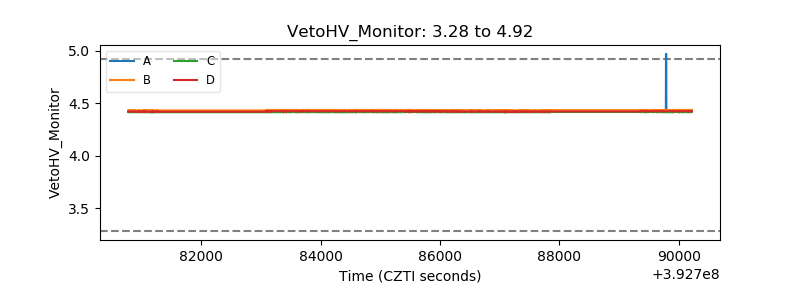 |
| Veto LLD | 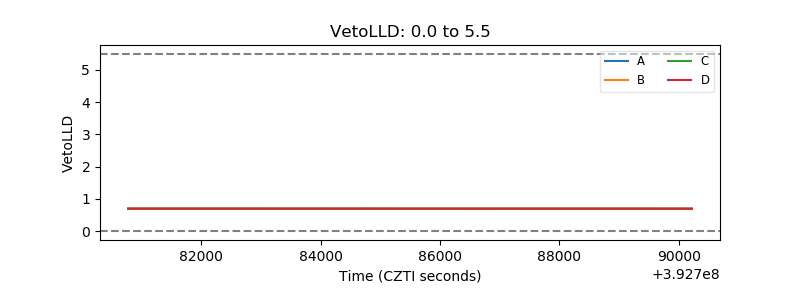 |
| Alpha Counter | 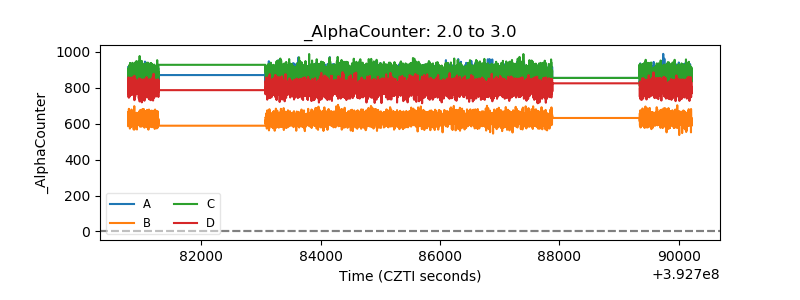 |
| _CPM_Rate | 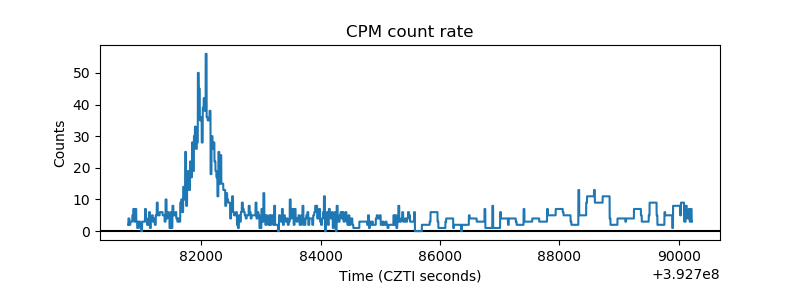 |
| CZT Counter | 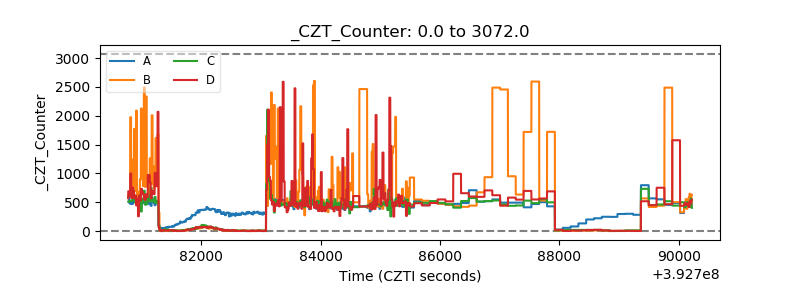 |
| +2.5 Volts monitor | 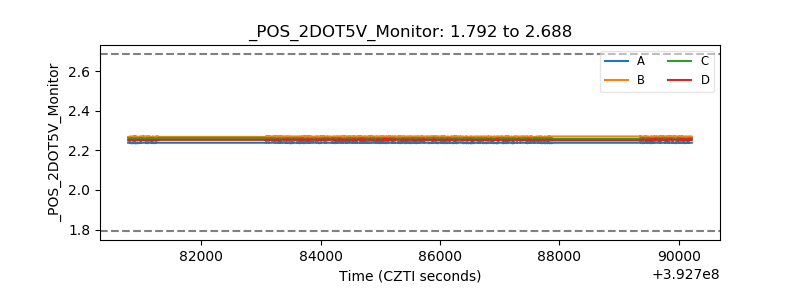 |
| +5 Volts monitor | 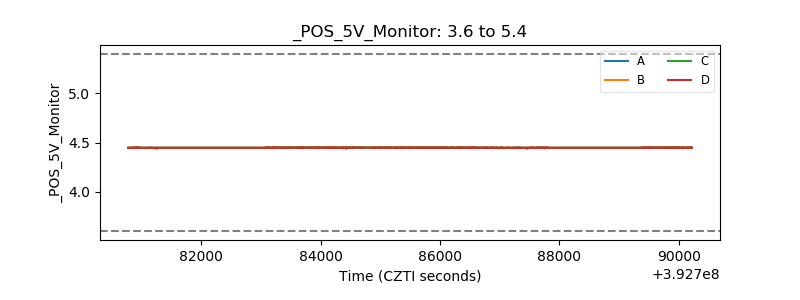 |
| _ROLL_ROT | 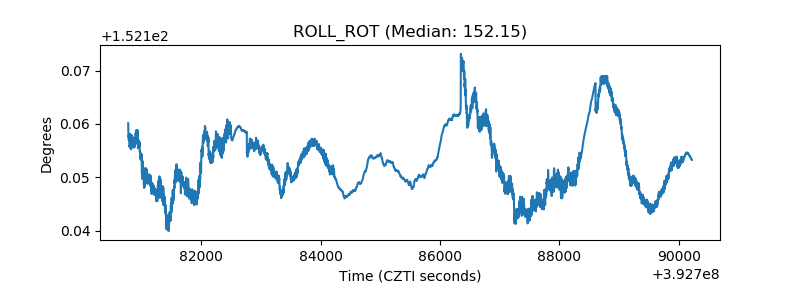 |
| _Roll_DEC | 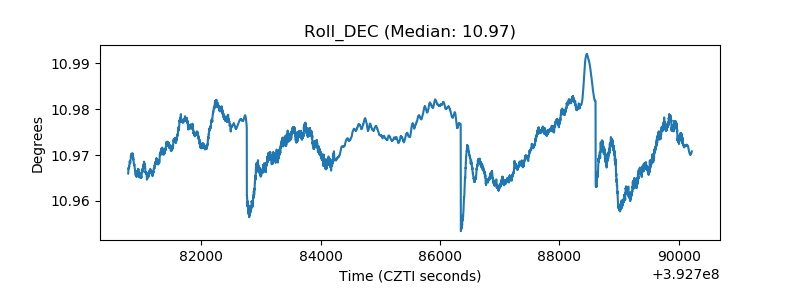 |
| _Roll_RA | 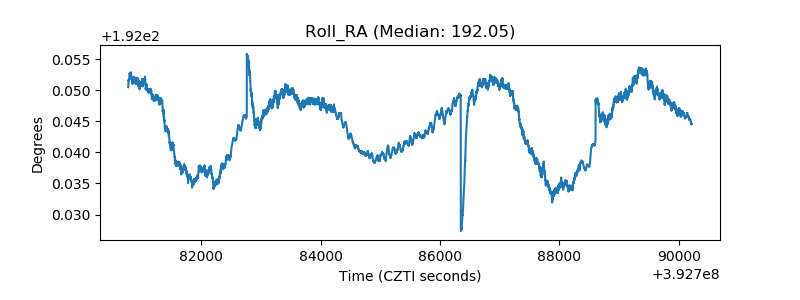 |
| Veto Counter | 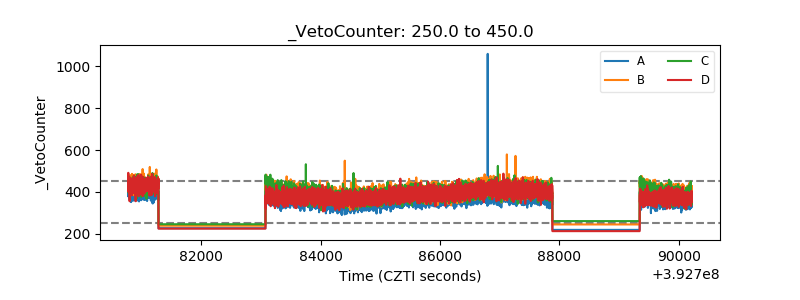 |