| Param | Original file | Final file |
|---|---|---|
| Filename | modeM0/AS1A10_071T36_9000005182_36264cztM0_level2.evt | modeM0/AS1A10_071T36_9000005182_36264cztM0_level2_quad_clean.evt |
| Size (bytes) | 453,228,480 | 55,742,400 |
| Size | 432.2 MB | 53.2 MB |
| Events in quadrant A | 2,707,701 | 334,460 |
| Events in quadrant B | 3,654,850 | 332,881 |
| Events in quadrant C | 2,882,384 | 328,020 |
| Events in quadrant D | 4,106,959 | 306,446 |
| Mode SS | |||
|---|---|---|---|
| Quadrant | BADHDUFLAG | Total packets | Discarded packets |
| A | 0 | 114 | 0 |
| B | 0 | 114 | 0 |
| C | 0 | 114 | 0 |
| D | 0 | 114 | 0 |
| Mode M9 | |||
|---|---|---|---|
| Quadrant | BADHDUFLAG | Total packets | Discarded packets |
| A | 0 | 38 | 0 |
| B | 0 | 38 | 0 |
| C | 0 | 38 | 0 |
| D | 0 | 38 | 0 |
| Mode M0 | |||
|---|---|---|---|
| Quadrant | BADHDUFLAG | Total packets | Discarded packets |
| A | 0 | 11424 | 3 |
| B | 0 | 14454 | 2 |
| C | 0 | 11732 | 2 |
| D | 0 | 16017 | 2 |
| Quadrant | Total seconds | Saturated seconds | Saturation percentage |
|---|---|---|---|
| A | 5511 | 8 | 0.145164% |
| B | 5511 | 269 | 4.881147% |
| C | 5511 | 29 | 0.526220% |
| D | 5511 | 267 | 4.844856% |
Noise dominated data is calculated using 1-second bins in cleaned event files. If a bin has >2000 counts, and if more than 50% of those come from <1% of pixels, then it is considered to be noise-dominated and hence unusable.
| Quadrant | # 1 sec bins | Bins with >0 counts | Bins with >2000 counts | High rate bins dominated by noise | Noise dominated (total time) | Noise dominated (detector-on time) | Marked lightcurve |
|---|---|---|---|---|---|---|---|
| A | 9367 | 5513 | 1 | 1 | 0.01% | 0.02% | 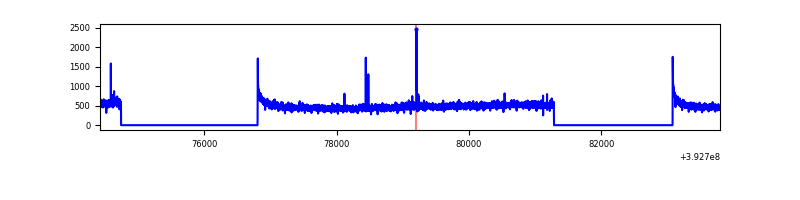 |
| B | 9367 | 5513 | 194 | 194 | 2.07% | 3.52% | 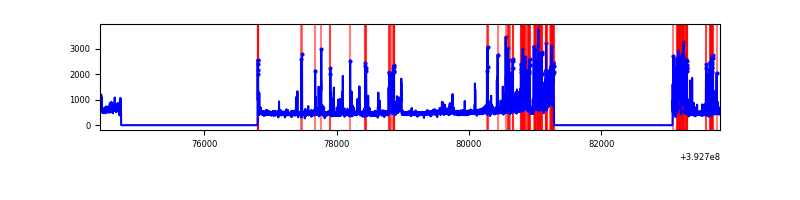 |
| C | 9367 | 5513 | 24 | 24 | 0.26% | 0.44% | 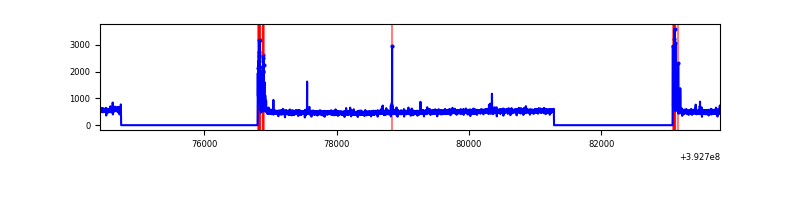 |
| D | 9367 | 5513 | 239 | 239 | 2.55% | 4.34% | 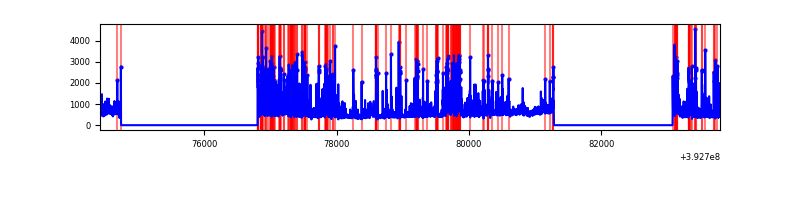 |
Top three noisy pixels from each quadrant. If the there are fewer than three noisy pixels in the level2.evt file, extra rows are filled as -1
| Pixel properties | Quadrant properties | ||||||
|---|---|---|---|---|---|---|---|
| Quadrant | DetID | PixID | Counts | Sigma | Mean | Median | Sigma |
| A | 10 | 83 | 179501 | 1354.16 | 648 | 635 | 132.1 |
| A | 10 | 255 | 18270 | 133.51 | 648 | 635 | 132.1 |
| A | 13 | 254 | 7015 | 48.3 | 648 | 635 | 132.1 |
| B | 5 | 172 | 611038 | 4928.25 | 635 | 619 | 123.9 |
| B | 4 | 171 | 275101 | 2216.04 | 635 | 619 | 123.9 |
| B | 5 | 236 | 172074 | 1384.25 | 635 | 619 | 123.9 |
| C | 15 | 214 | 232443 | 1568.66 | 628 | 633 | 147.8 |
| C | 0 | 10 | 171896 | 1158.94 | 628 | 633 | 147.8 |
| C | 0 | 207 | 13973 | 90.27 | 628 | 633 | 147.8 |
| D | 12 | 6 | 834244 | 5490.3 | 616 | 601 | 151.8 |
| D | 13 | 249 | 239706 | 1574.72 | 616 | 601 | 151.8 |
| D | 13 | 171 | 174221 | 1143.45 | 616 | 601 | 151.8 |
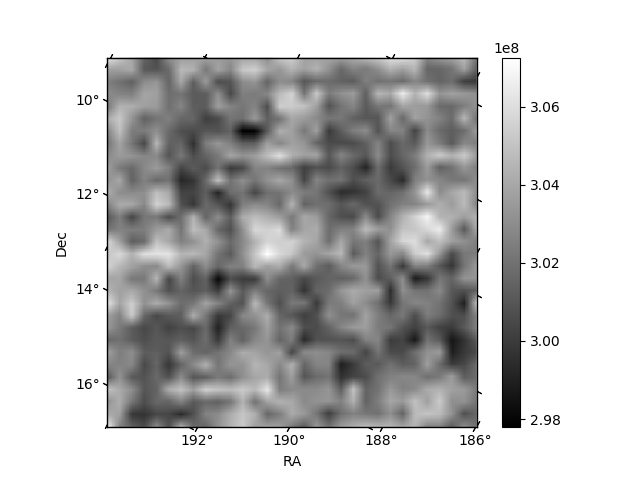
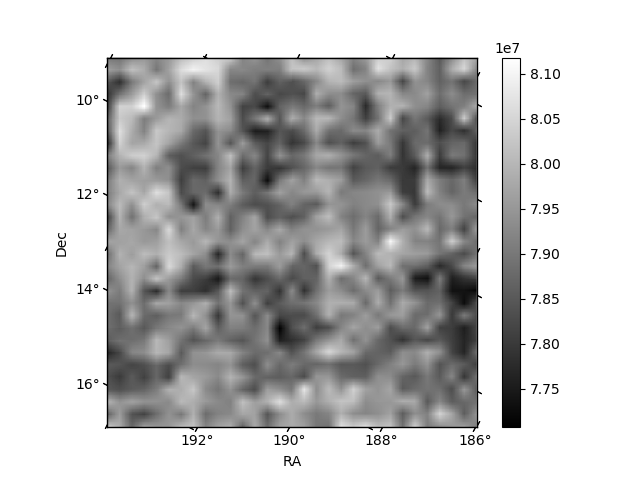
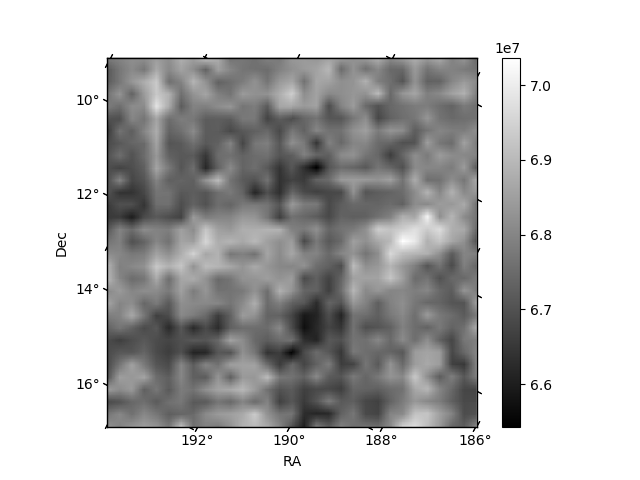
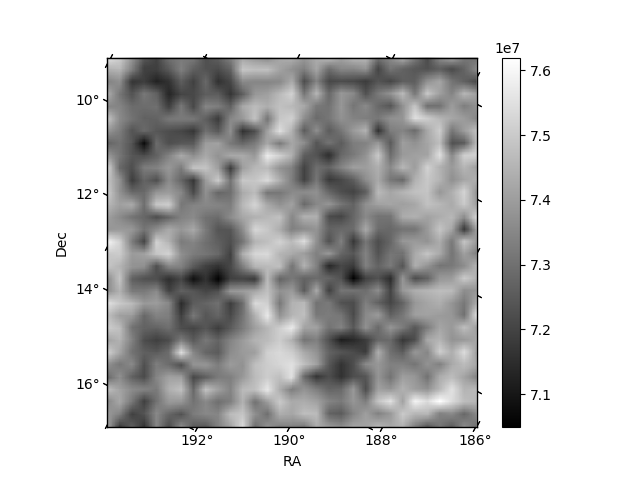
Histogram calculated using DETX and DETY for each event in the final _common_clean file
| Quadrant A | 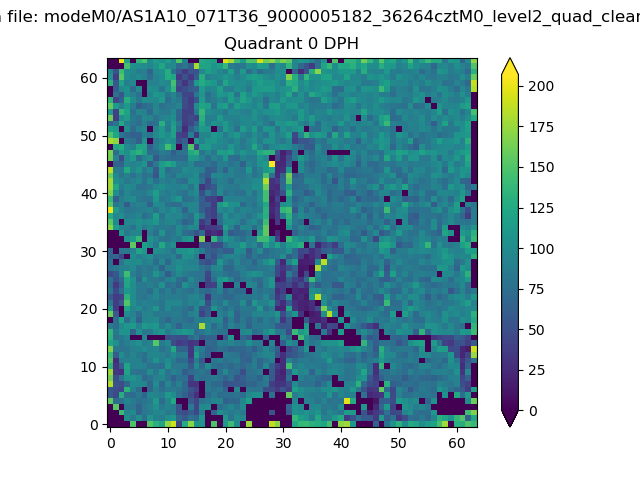 |
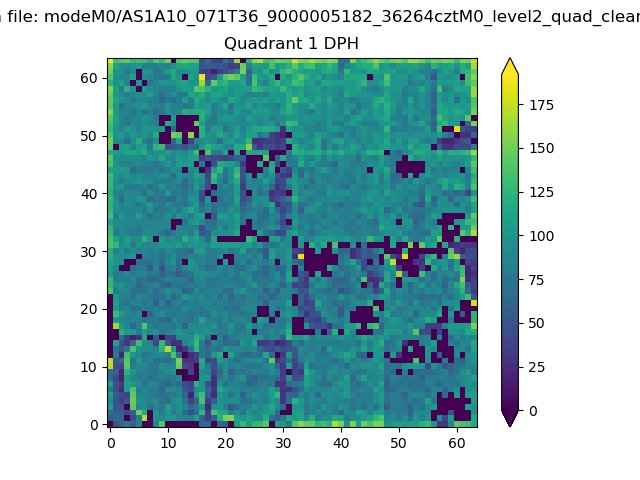 |
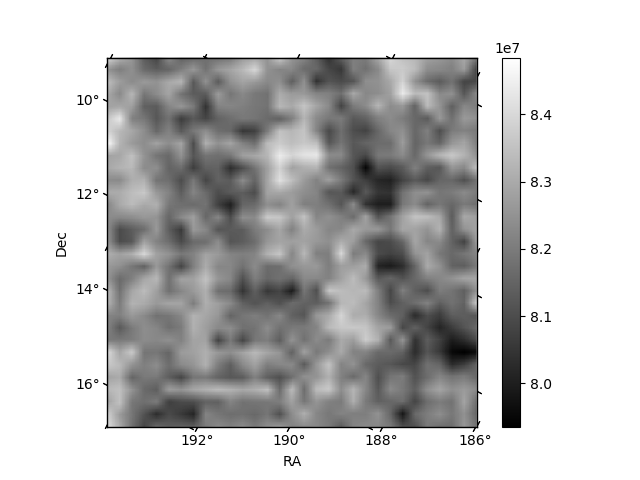
Quadrant B |
|---|---|---|---|
| Quadrant D | 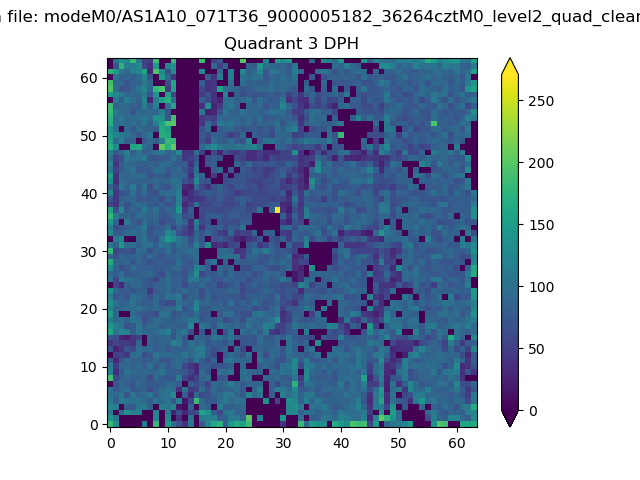 |
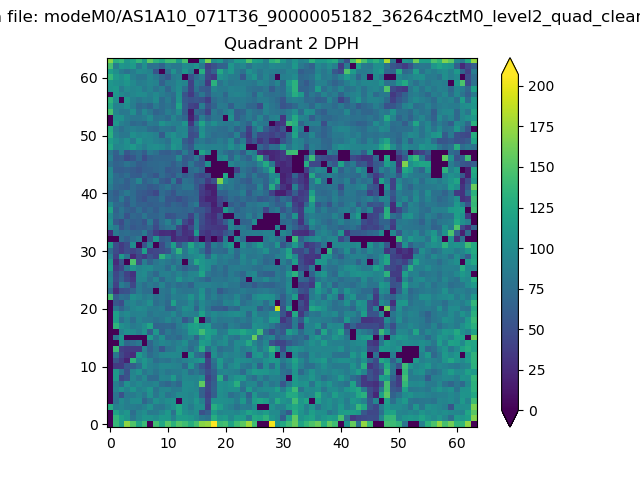 |
Quadrant C |
| Plot type | Count rate plots | Images |
|---|---|---|
| Comparison with Poisson distribution Blue bars denote a histogram of data divided into 1 sec bins. Red curve is a Poisson curve with rate = median count rate of data. |
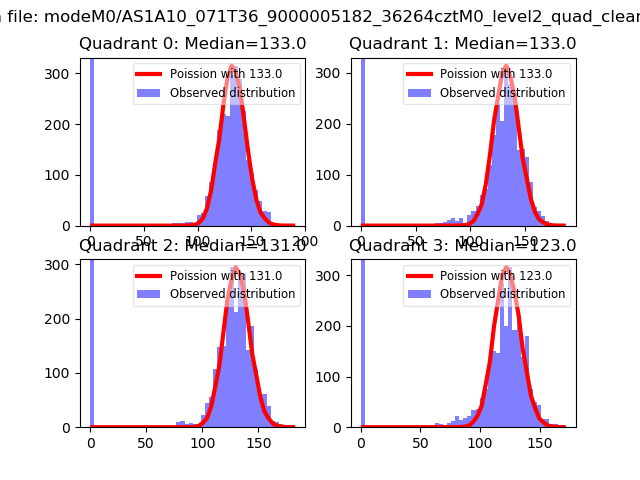 |
 |
| Quadrant-wise count rates Data is divided into 100 sec bins |
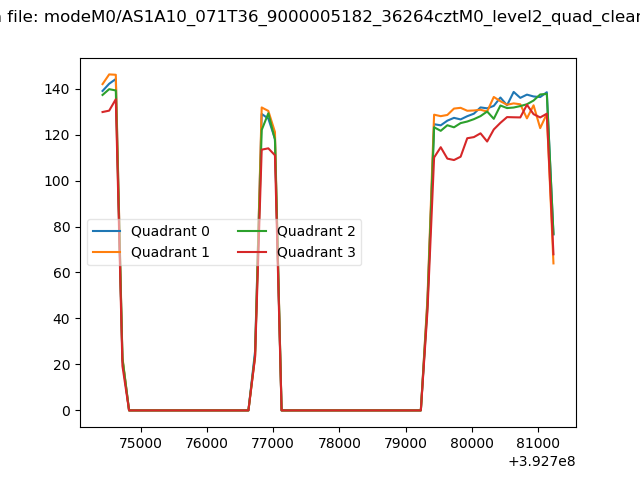 |
|
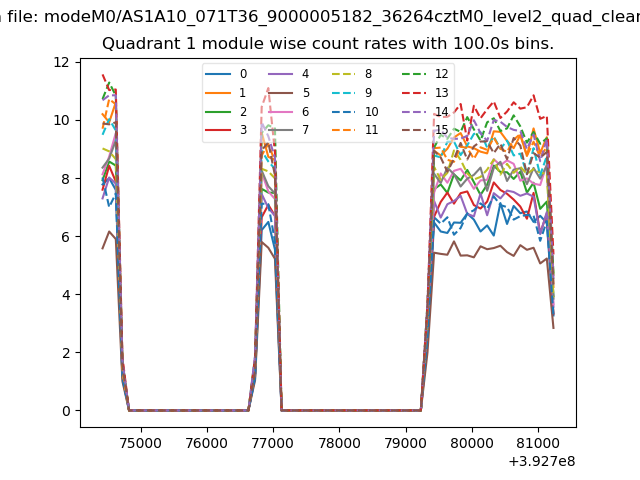
| Module-wise count rates for Quadrant A Data is divided into 100 sec bins |
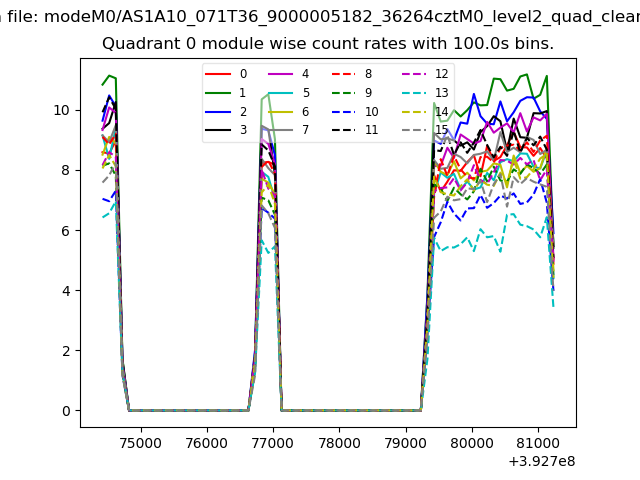 |
 |
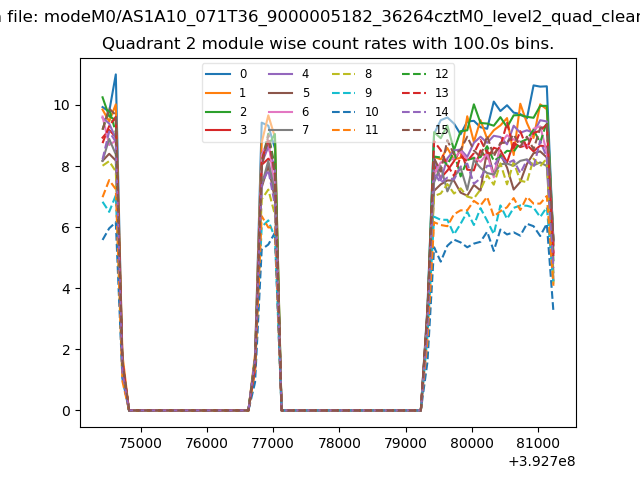
| Module-wise count rates for Quadrant B Data is divided into 100 sec bins |
 |
 |
| Module-wise count rates for Quadrant C Data is divided into 100 sec bins |
 |
 |
| Module-wise count rates for Quadrant D Data is divided into 100 sec bins |
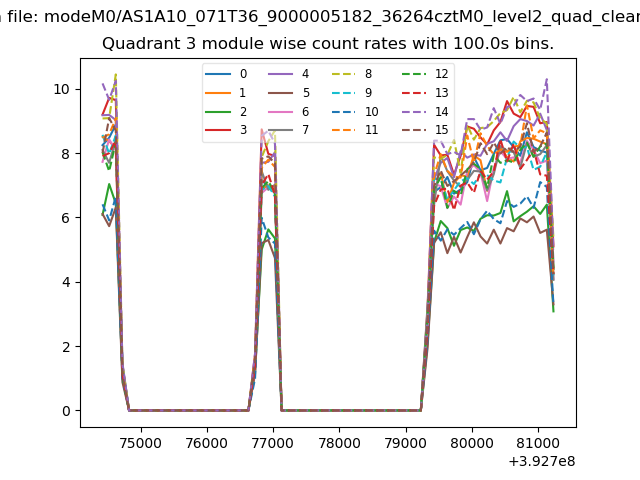 |
 |
| Parameter | Plot |
|---|---|
| CZT HV Monitor | 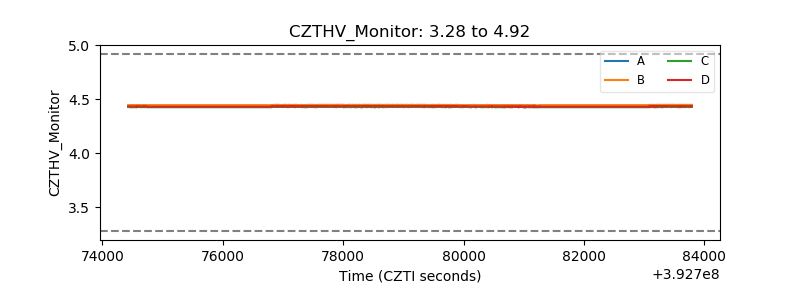 |
| D_VDD | 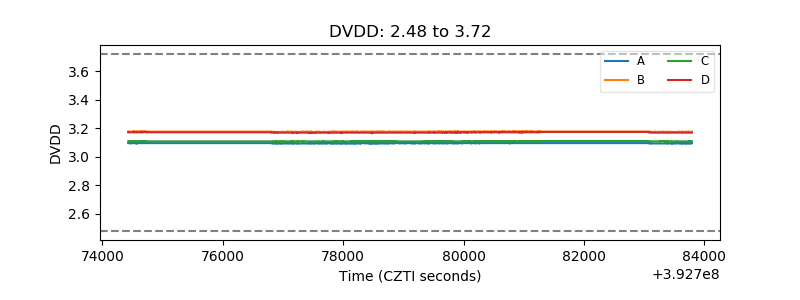 |
| Temperature 1 | 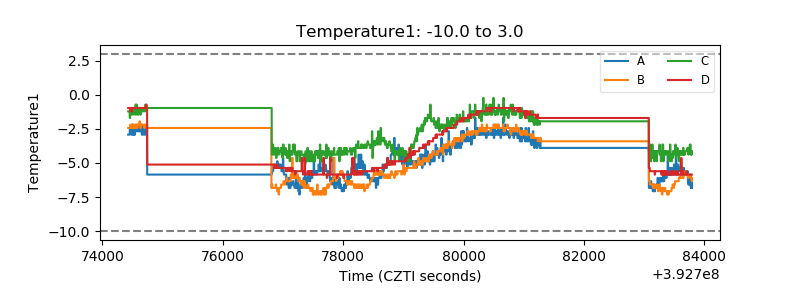 |
| Veto HV Monitor | 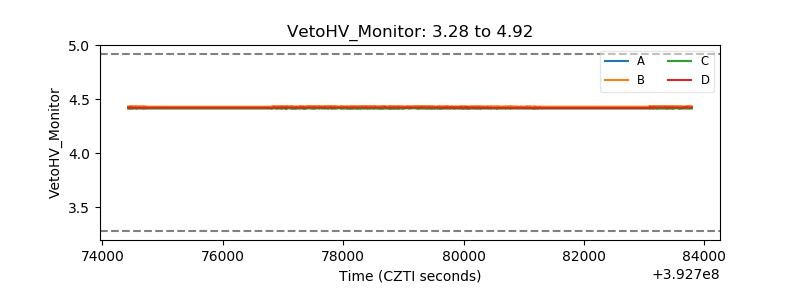 |
| Veto LLD | 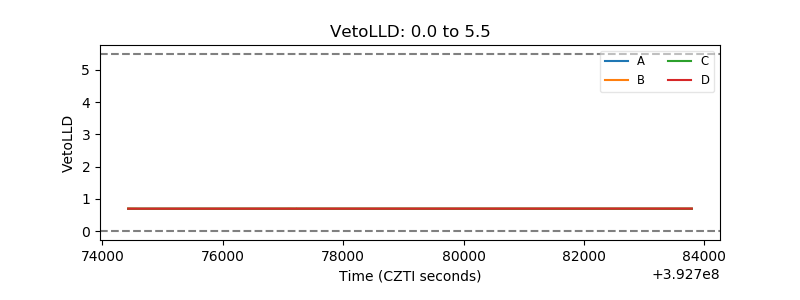 |
| Alpha Counter | 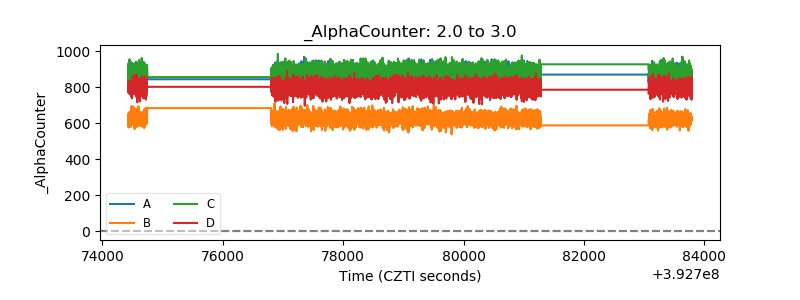 |
| _CPM_Rate | 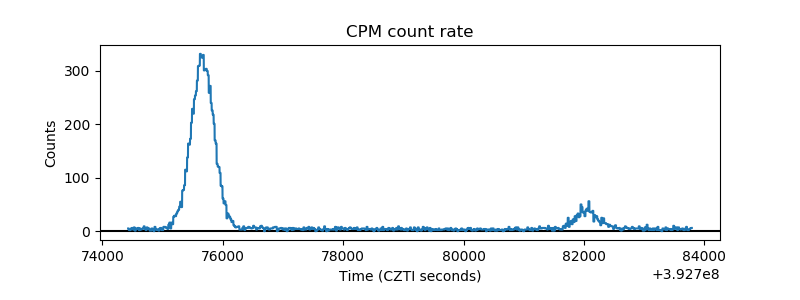 |
| CZT Counter | 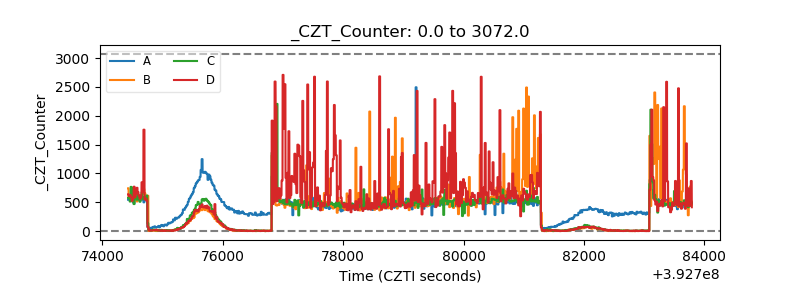 |
| +2.5 Volts monitor | 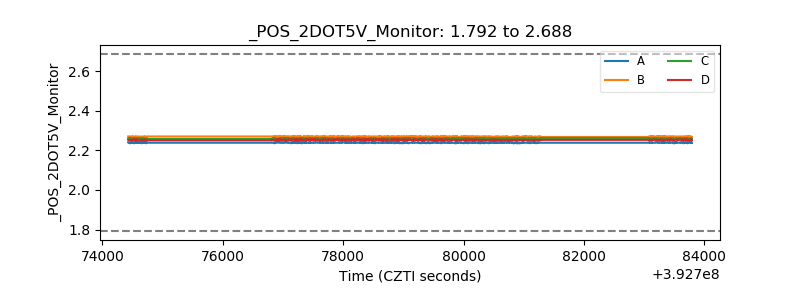 |
| +5 Volts monitor | 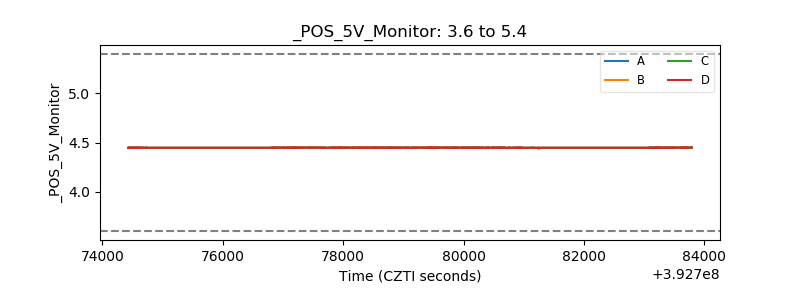 |
| _ROLL_ROT | 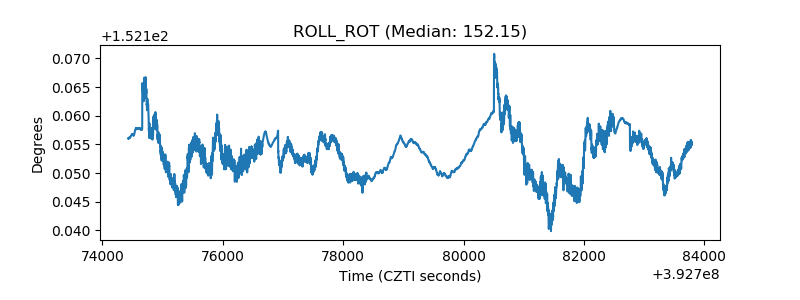 |
| _Roll_DEC | 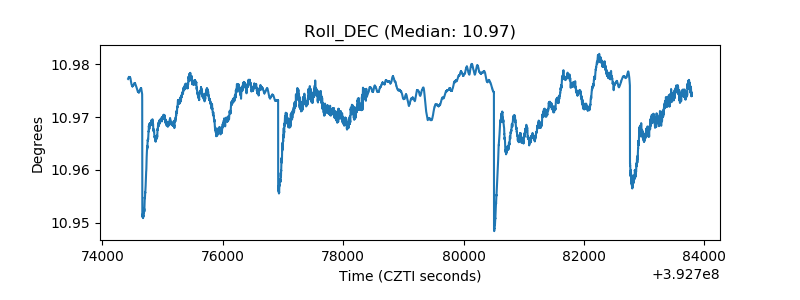 |
| _Roll_RA | 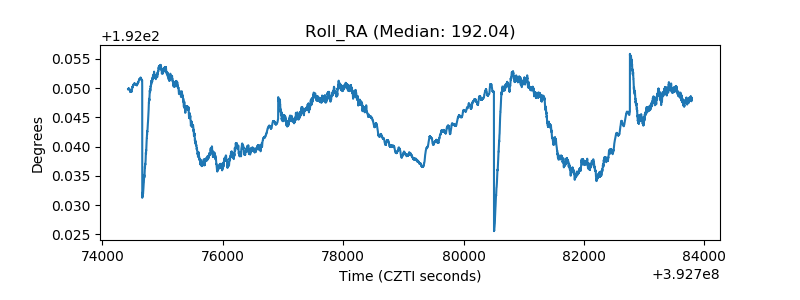 |
| Veto Counter | 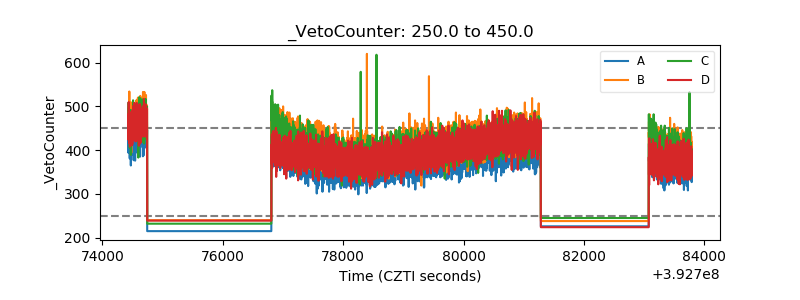 |