| Param | Original file | Final file |
|---|---|---|
| Filename | modeM0/AS1A10_071T36_9000005182_36260cztM0_level2.evt | modeM0/AS1A10_071T36_9000005182_36260cztM0_level2_quad_clean.evt |
| Size (bytes) | 454,841,280 | 65,963,520 |
| Size | 433.8 MB | 62.9 MB |
| Events in quadrant A | 2,639,589 | 424,004 |
| Events in quadrant B | 4,193,939 | 408,121 |
| Events in quadrant C | 2,879,005 | 417,608 |
| Events in quadrant D | 3,716,575 | 390,133 |
| Mode SS | |||
|---|---|---|---|
| Quadrant | BADHDUFLAG | Total packets | Discarded packets |
| A | 0 | 104 | 0 |
| B | 0 | 104 | 0 |
| C | 0 | 104 | 0 |
| D | 0 | 104 | 0 |
| Mode M9 | |||
|---|---|---|---|
| Quadrant | BADHDUFLAG | Total packets | Discarded packets |
| A | 0 | 25 | 0 |
| B | 0 | 25 | 0 |
| C | 0 | 25 | 0 |
| D | 0 | 26 | 0 |
| Mode M0 | |||
|---|---|---|---|
| Quadrant | BADHDUFLAG | Total packets | Discarded packets |
| A | 0 | 10902 | 3 |
| B | 0 | 15757 | 2 |
| C | 0 | 11401 | 2 |
| D | 0 | 14280 | 2 |
| Quadrant | Total seconds | Saturated seconds | Saturation percentage |
|---|---|---|---|
| A | 5095 | 15 | 0.294406% |
| B | 5095 | 387 | 7.595682% |
| C | 5095 | 95 | 1.864573% |
| D | 5095 | 275 | 5.397448% |
Noise dominated data is calculated using 1-second bins in cleaned event files. If a bin has >2000 counts, and if more than 50% of those come from <1% of pixels, then it is considered to be noise-dominated and hence unusable.
| Quadrant | # 1 sec bins | Bins with >0 counts | Bins with >2000 counts | High rate bins dominated by noise | Noise dominated (total time) | Noise dominated (detector-on time) | Marked lightcurve |
|---|---|---|---|---|---|---|---|
| A | 7098 | 5096 | 4 | 4 | 0.06% | 0.08% | 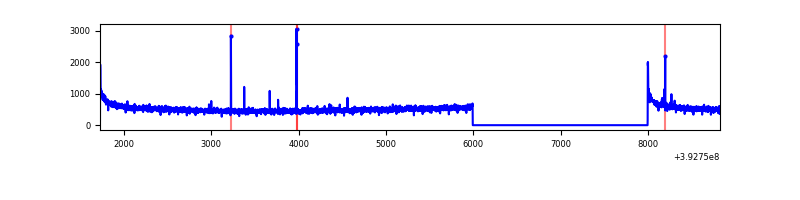 |
| B | 7098 | 5096 | 298 | 298 | 4.20% | 5.85% | 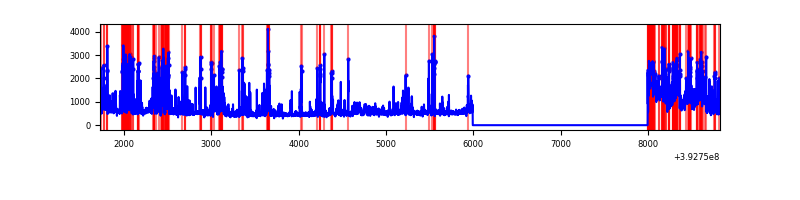 |
| C | 7098 | 5096 | 86 | 86 | 1.21% | 1.69% | 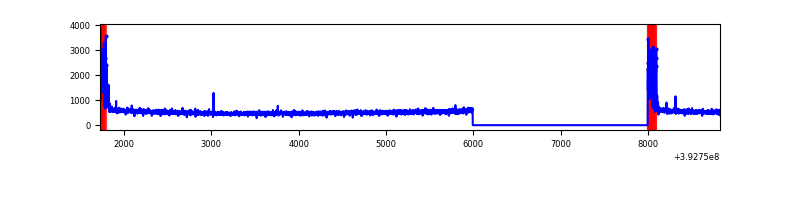 |
| D | 7098 | 5096 | 269 | 269 | 3.79% | 5.28% | 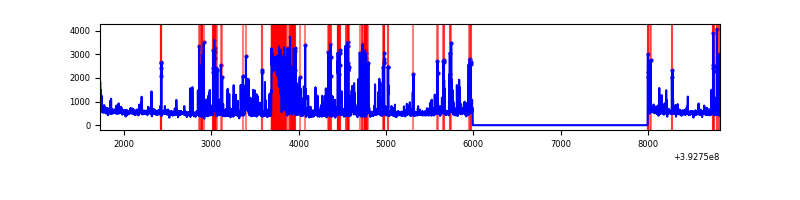 |
Top three noisy pixels from each quadrant. If the there are fewer than three noisy pixels in the level2.evt file, extra rows are filled as -1
| Pixel properties | Quadrant properties | ||||||
|---|---|---|---|---|---|---|---|
| Quadrant | DetID | PixID | Counts | Sigma | Mean | Median | Sigma |
| A | 10 | 83 | 179199 | 1409.58 | 628 | 617 | 126.7 |
| A | 9 | 143 | 25800 | 198.77 | 628 | 617 | 126.7 |
| A | 13 | 254 | 8868 | 65.13 | 628 | 617 | 126.7 |
| B | 5 | 236 | 621254 | 5410.33 | 614 | 600 | 114.7 |
| B | 5 | 172 | 416446 | 3624.99 | 614 | 600 | 114.7 |
| B | 15 | 35 | 409334 | 3563.0 | 614 | 600 | 114.7 |
| C | 0 | 10 | 277534 | 1953.8 | 612 | 617 | 141.7 |
| C | 15 | 214 | 213119 | 1499.32 | 612 | 617 | 141.7 |
| C | 13 | 61 | 4028 | 24.07 | 612 | 617 | 141.7 |
| D | 12 | 6 | 913402 | 6317.33 | 594 | 579 | 144.5 |
| D | 13 | 171 | 128722 | 886.83 | 594 | 579 | 144.5 |
| D | 2 | 153 | 74603 | 512.29 | 594 | 579 | 144.5 |
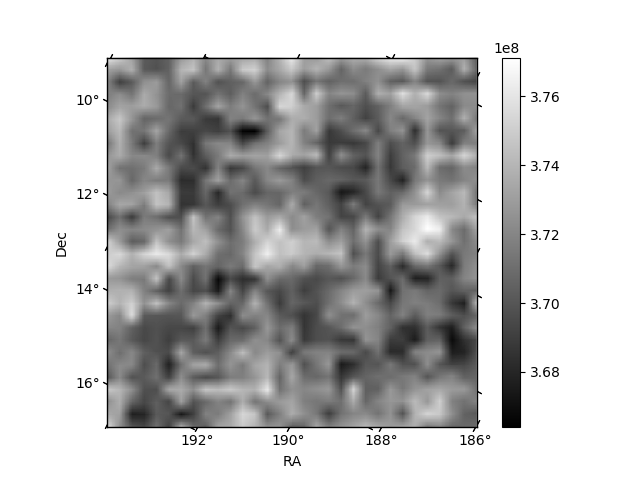
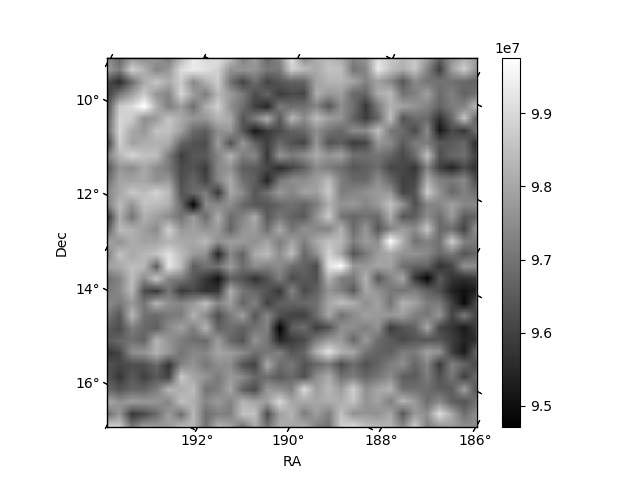
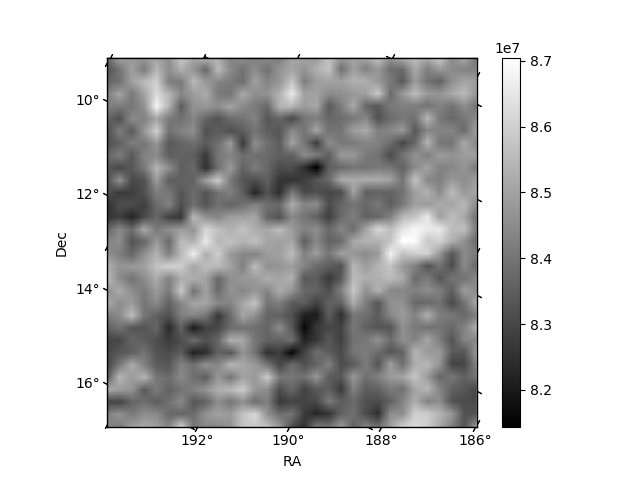
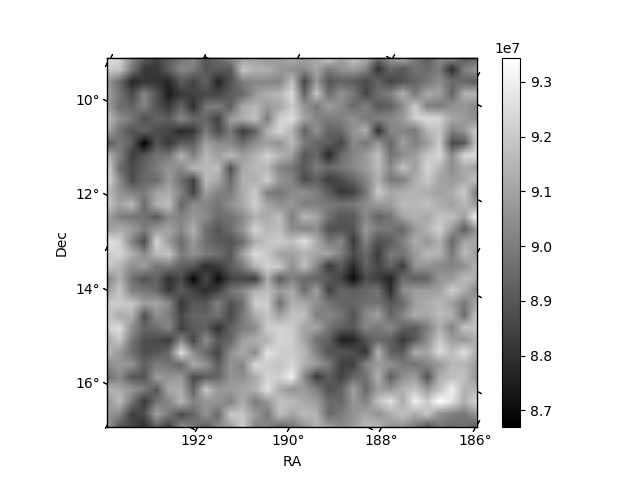
Histogram calculated using DETX and DETY for each event in the final _common_clean file
| Quadrant A | 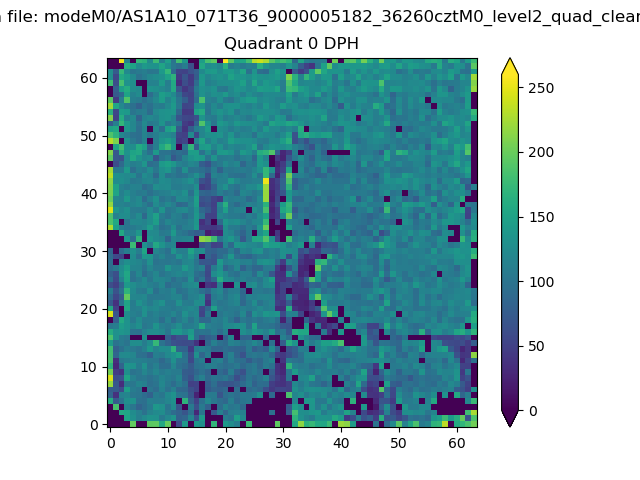 |
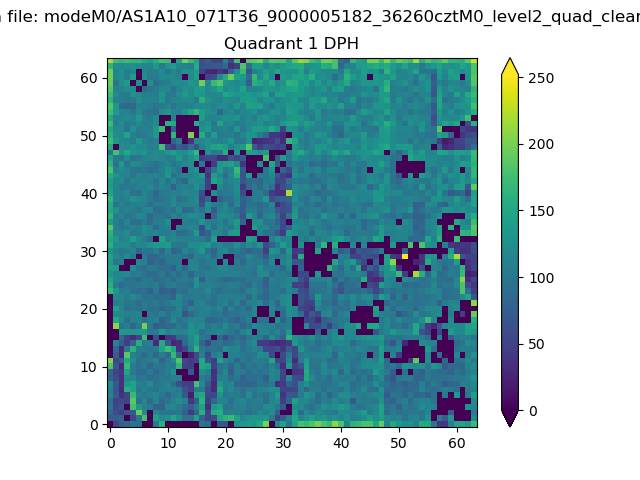 |
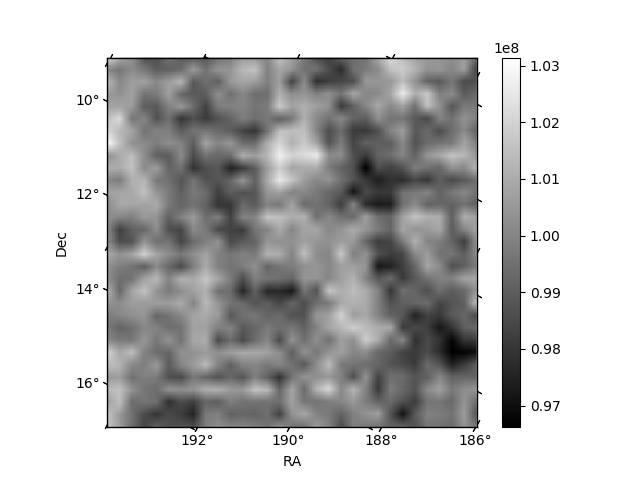
Quadrant B |
|---|---|---|---|
| Quadrant D | 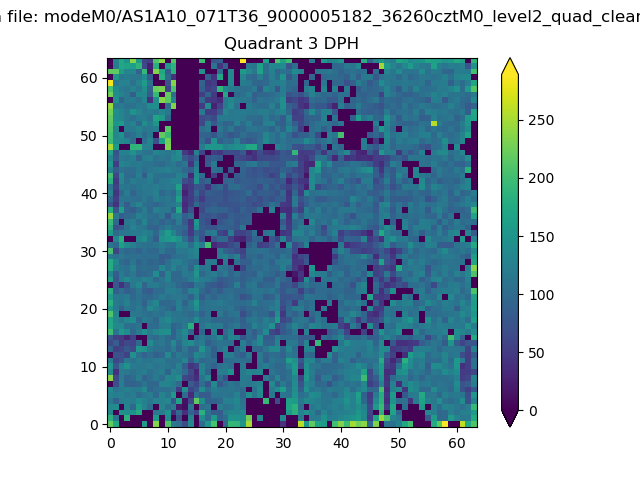 |
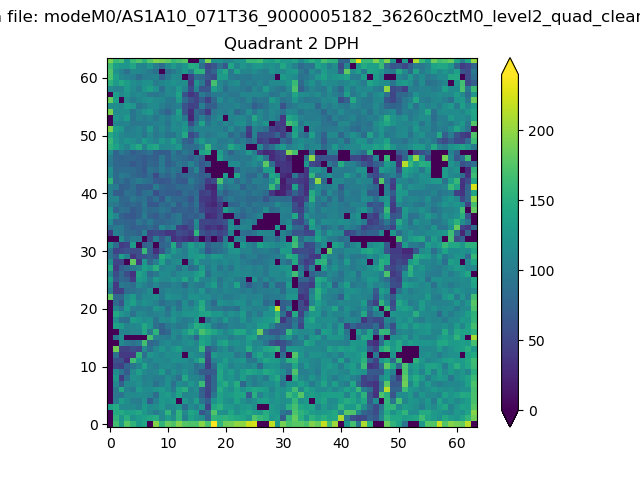 |
Quadrant C |
| Plot type | Count rate plots | Images |
|---|---|---|
| Comparison with Poisson distribution Blue bars denote a histogram of data divided into 1 sec bins. Red curve is a Poisson curve with rate = median count rate of data. |
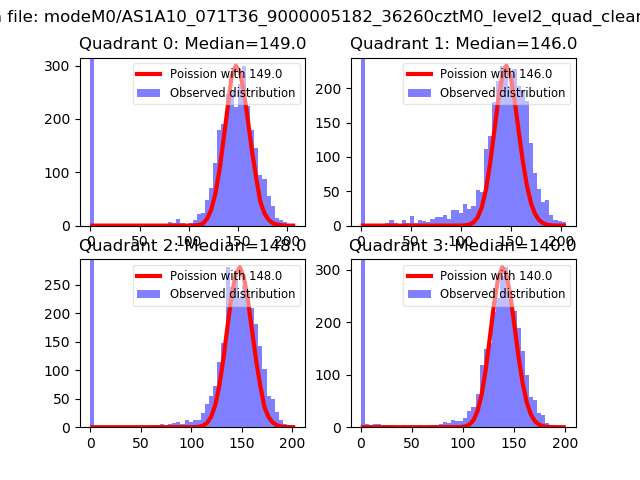 |
 |
| Quadrant-wise count rates Data is divided into 100 sec bins |
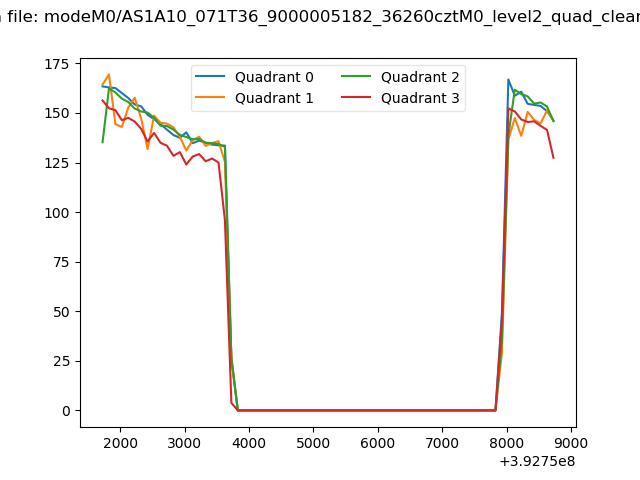 |
|
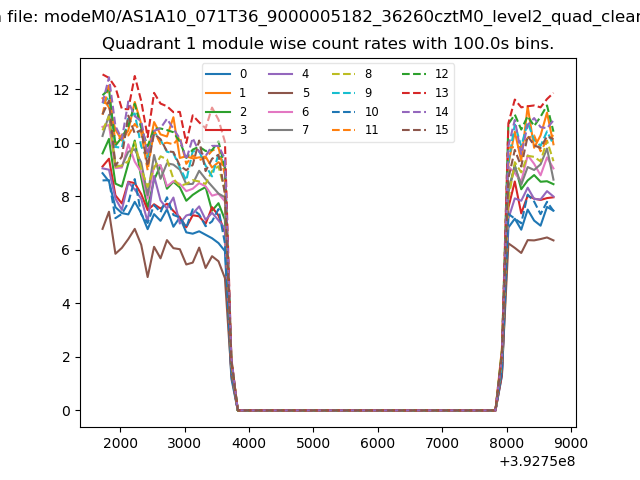
| Module-wise count rates for Quadrant A Data is divided into 100 sec bins |
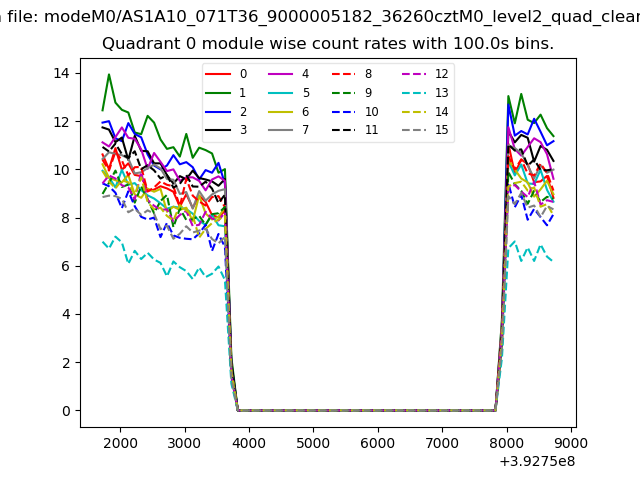 |
 |
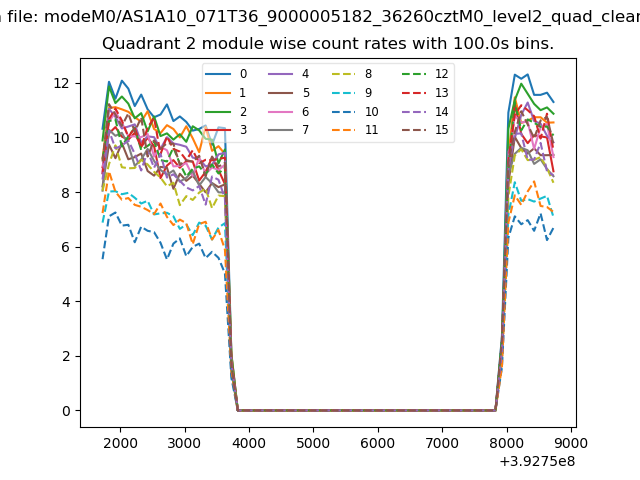
| Module-wise count rates for Quadrant B Data is divided into 100 sec bins |
 |
 |
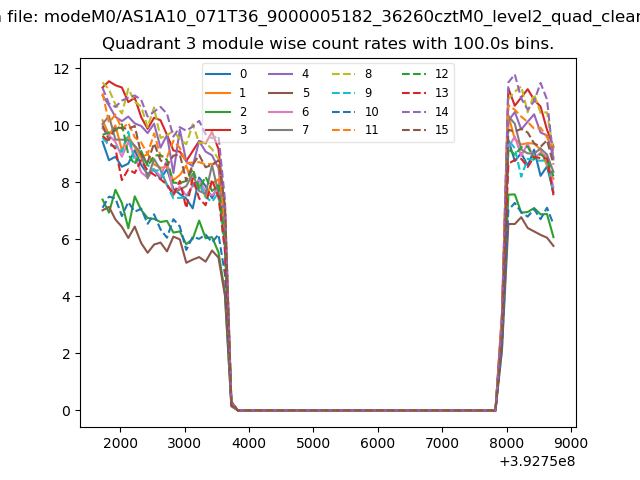
| Module-wise count rates for Quadrant C Data is divided into 100 sec bins |
 |
 |
| Module-wise count rates for Quadrant D Data is divided into 100 sec bins |
 |
 |
| Parameter | Plot |
|---|---|
| CZT HV Monitor | 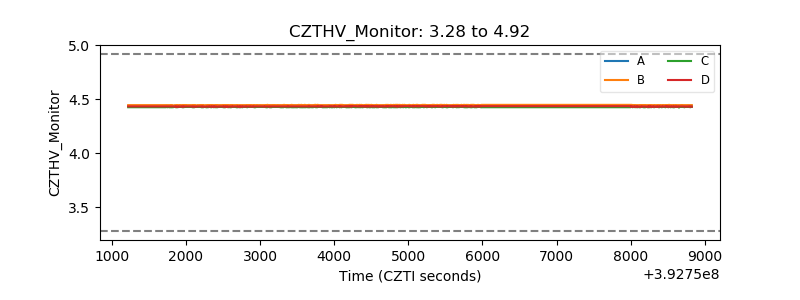 |
| D_VDD | 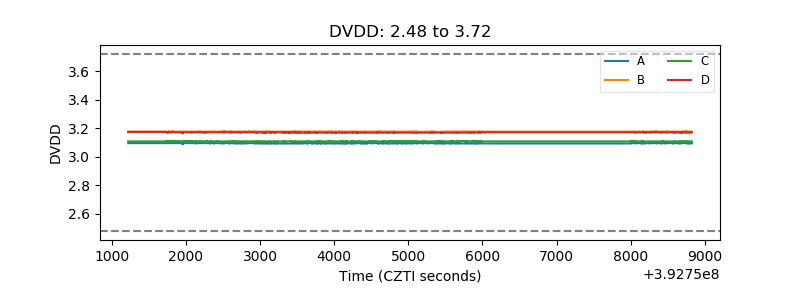 |
| Temperature 1 | 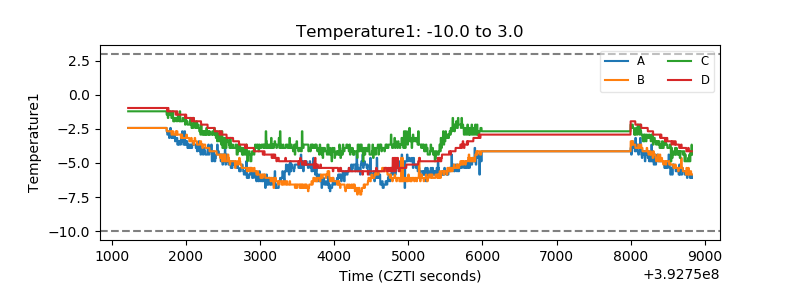 |
| Veto HV Monitor |  |
| Veto LLD | 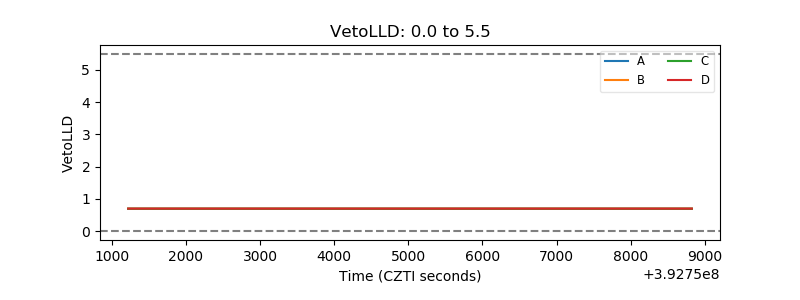 |
| Alpha Counter | 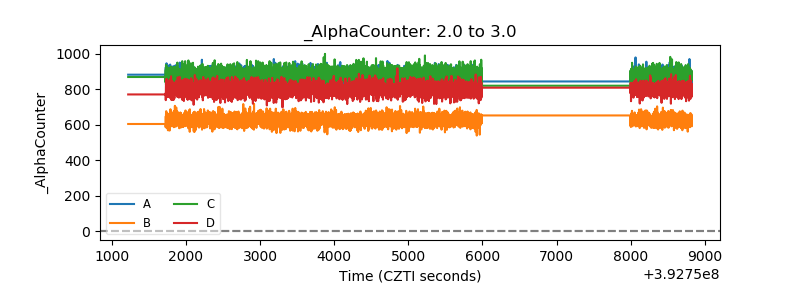 |
| _CPM_Rate | 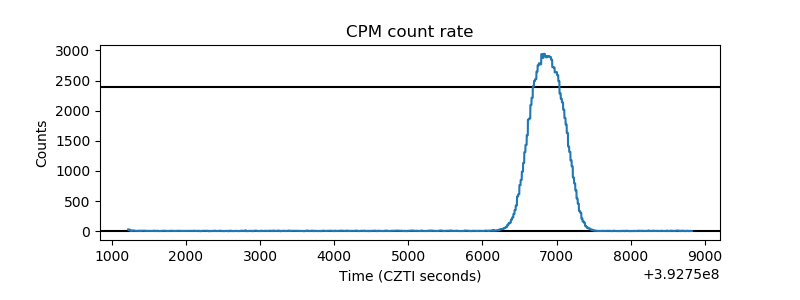 |
| CZT Counter | 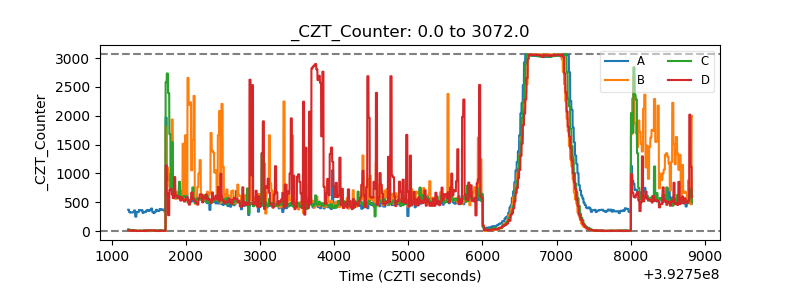 |
| +2.5 Volts monitor | 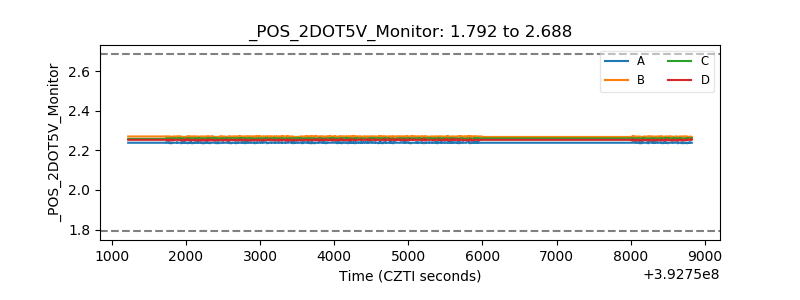 |
| +5 Volts monitor | 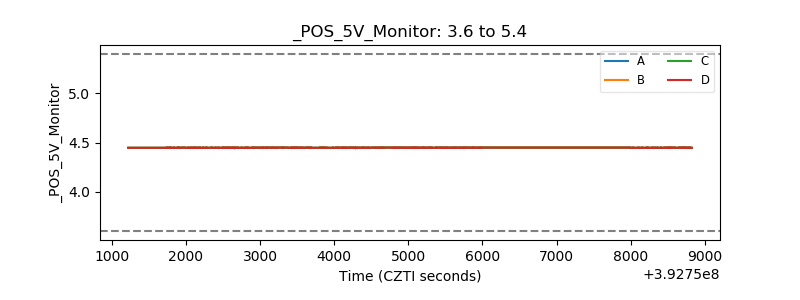 |
| _ROLL_ROT | 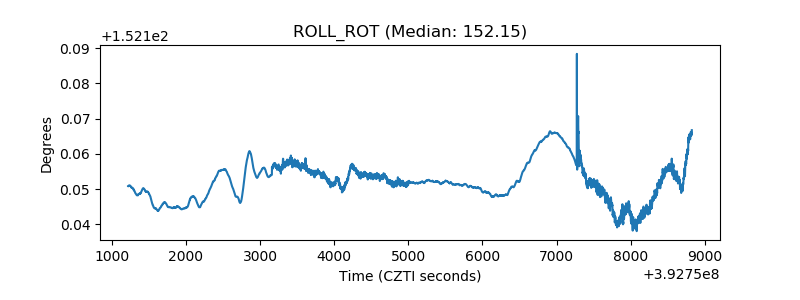 |
| _Roll_DEC | 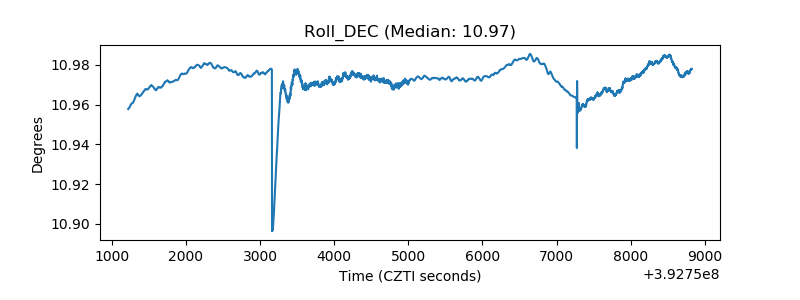 |
| _Roll_RA | 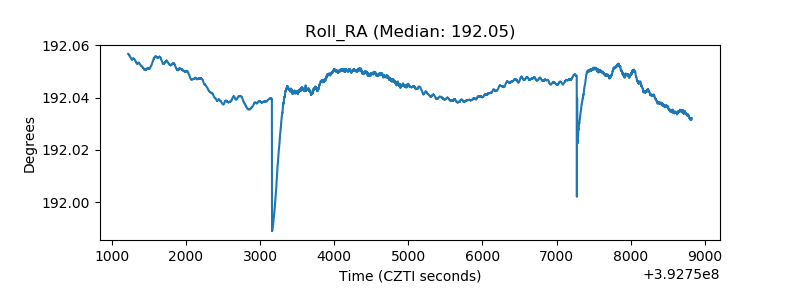 |
| Veto Counter | 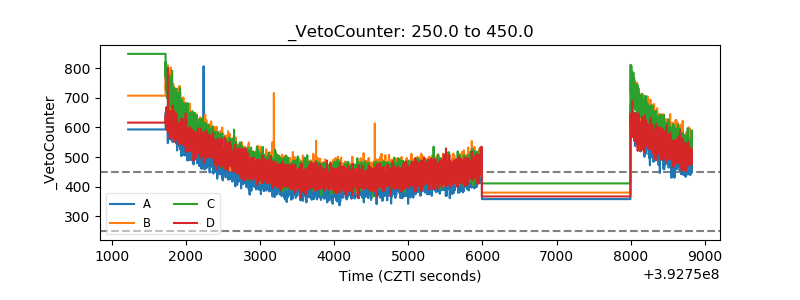 |