| Param | Original file | Final file |
|---|---|---|
| Filename | modeM0/AS1A10_071T36_9000005182_36259cztM0_level2.evt | modeM0/AS1A10_071T36_9000005182_36259cztM0_level2_quad_clean.evt |
| Size (bytes) | 228,346,560 | 24,295,680 |
| Size | 217.8 MB | 23.2 MB |
| Events in quadrant A | 1,386,417 | 140,446 |
| Events in quadrant B | 2,273,930 | 134,982 |
| Events in quadrant C | 1,531,248 | 136,395 |
| Events in quadrant D | 1,540,017 | 131,362 |
| Mode SS | |||
|---|---|---|---|
| Quadrant | BADHDUFLAG | Total packets | Discarded packets |
| A | 0 | 54 | 0 |
| B | 0 | 54 | 0 |
| C | 0 | 54 | 0 |
| D | 0 | 54 | 0 |
| Mode M9 | |||
|---|---|---|---|
| Quadrant | BADHDUFLAG | Total packets | Discarded packets |
| A | 0 | 20 | 0 |
| B | 0 | 20 | 0 |
| C | 0 | 20 | 0 |
| D | 0 | 20 | 0 |
| Mode M0 | |||
|---|---|---|---|
| Quadrant | BADHDUFLAG | Total packets | Discarded packets |
| A | 0 | 5710 | 2 |
| B | 0 | 8522 | 1 |
| C | 0 | 6059 | 1 |
| D | 0 | 6253 | 1 |
| Quadrant | Total seconds | Saturated seconds | Saturation percentage |
|---|---|---|---|
| A | 2685 | 5 | 0.186220% |
| B | 2685 | 278 | 10.353818% |
| C | 2685 | 38 | 1.415270% |
| D | 2685 | 24 | 0.893855% |
Noise dominated data is calculated using 1-second bins in cleaned event files. If a bin has >2000 counts, and if more than 50% of those come from <1% of pixels, then it is considered to be noise-dominated and hence unusable.
| Quadrant | # 1 sec bins | Bins with >0 counts | Bins with >2000 counts | High rate bins dominated by noise | Noise dominated (total time) | Noise dominated (detector-on time) | Marked lightcurve |
|---|---|---|---|---|---|---|---|
| A | 4598 | 2686 | 0 | 0 | 0.00% | 0.00% | 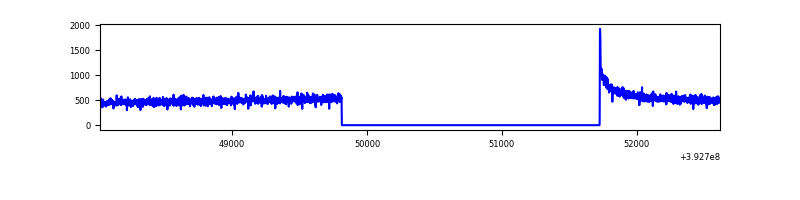 |
| B | 4598 | 2686 | 156 | 156 | 3.39% | 5.81% | 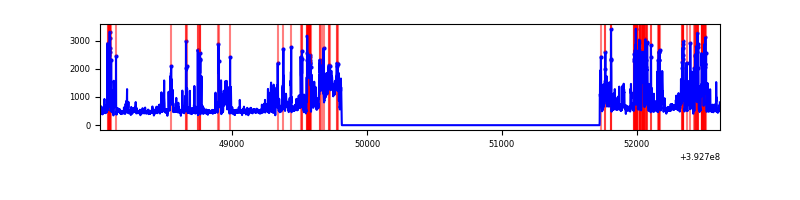 |
| C | 4598 | 2686 | 33 | 33 | 0.72% | 1.23% | 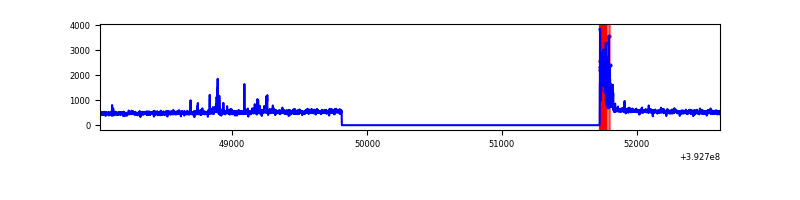 |
| D | 4598 | 2686 | 20 | 20 | 0.43% | 0.74% | 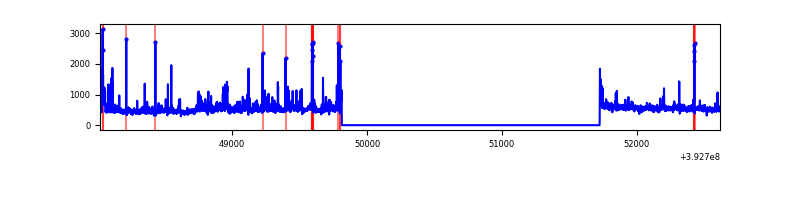 |
Top three noisy pixels from each quadrant. If the there are fewer than three noisy pixels in the level2.evt file, extra rows are filled as -1
| Pixel properties | Quadrant properties | ||||||
|---|---|---|---|---|---|---|---|
| Quadrant | DetID | PixID | Counts | Sigma | Mean | Median | Sigma |
| A | 10 | 83 | 92275 | 1338.1 | 334 | 327 | 68.7 |
| A | 13 | 254 | 4883 | 66.3 | 334 | 327 | 68.7 |
| A | 3 | 137 | 3430 | 45.16 | 334 | 327 | 68.7 |
| B | 5 | 236 | 559799 | 9044.09 | 323 | 314 | 61.9 |
| B | 5 | 172 | 309082 | 4991.24 | 323 | 314 | 61.9 |
| B | 15 | 32 | 50539 | 811.89 | 323 | 314 | 61.9 |
| C | 0 | 10 | 123876 | 1608.49 | 325 | 326 | 76.8 |
| C | 15 | 214 | 112459 | 1459.86 | 325 | 326 | 76.8 |
| C | 0 | 207 | 29747 | 383.03 | 325 | 326 | 76.8 |
| D | 13 | 171 | 76849 | 964.94 | 322 | 314 | 79.3 |
| D | 12 | 6 | 74514 | 935.5 | 322 | 314 | 79.3 |
| D | 13 | 249 | 40692 | 509.08 | 322 | 314 | 79.3 |
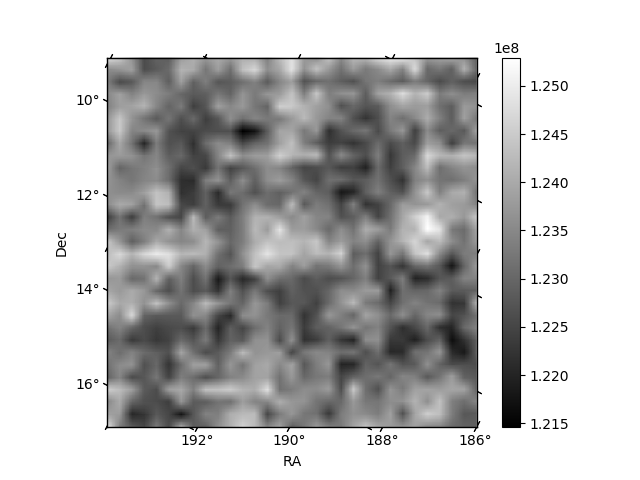
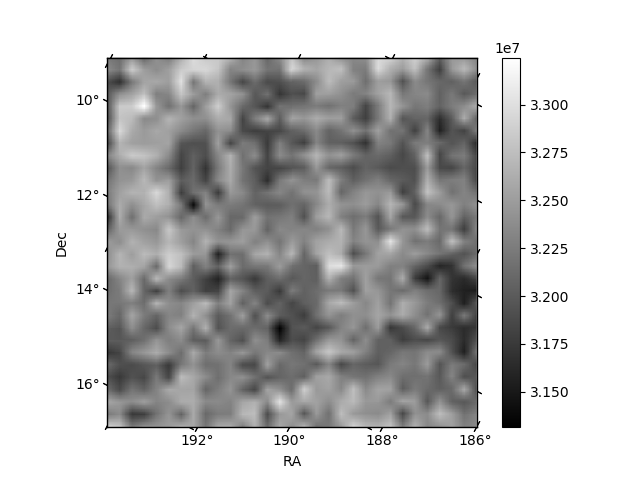
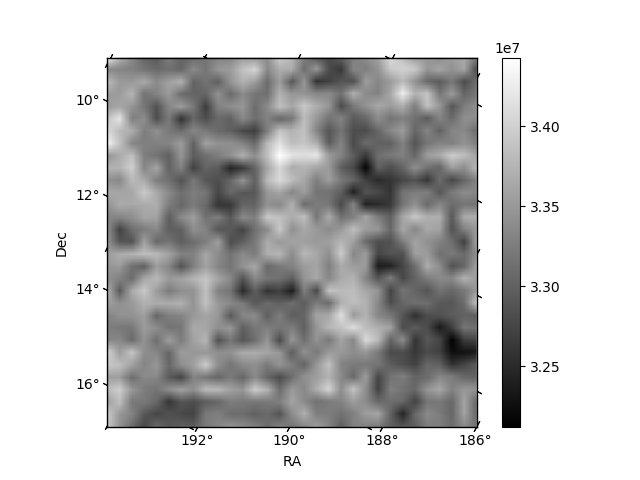
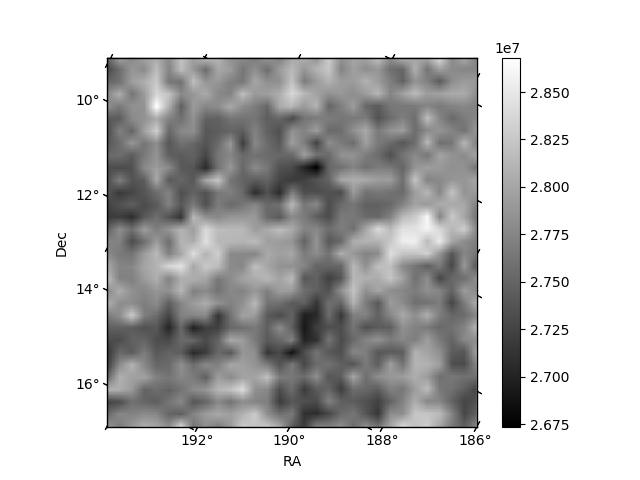
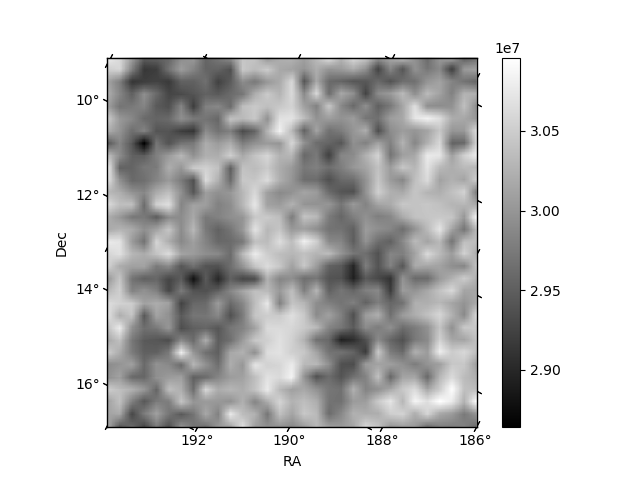
Histogram calculated using DETX and DETY for each event in the final _common_clean file
| Quadrant A | 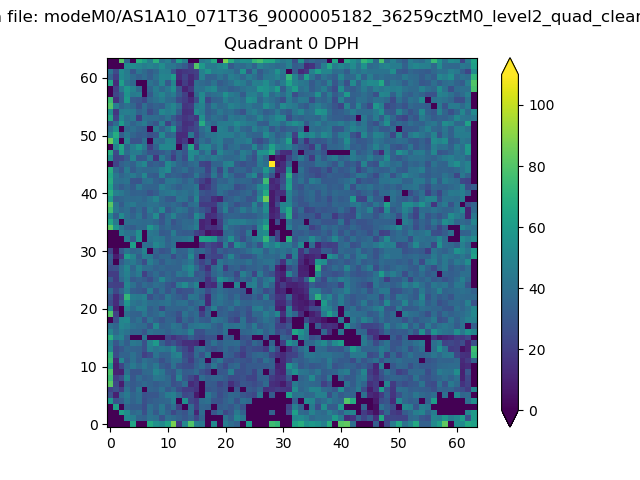 |
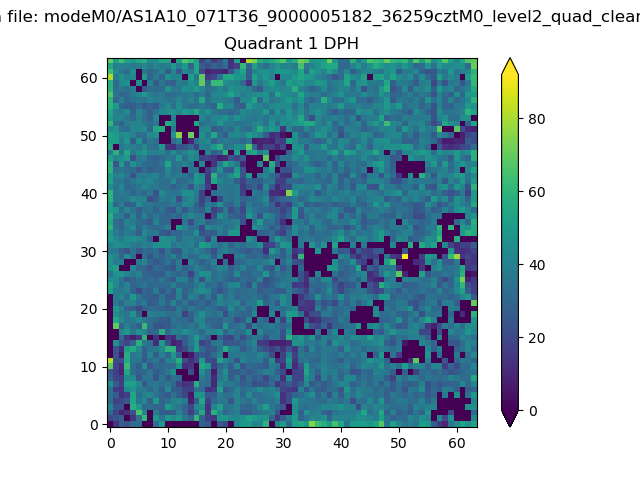 |
Quadrant B |
|---|---|---|---|
| Quadrant D | 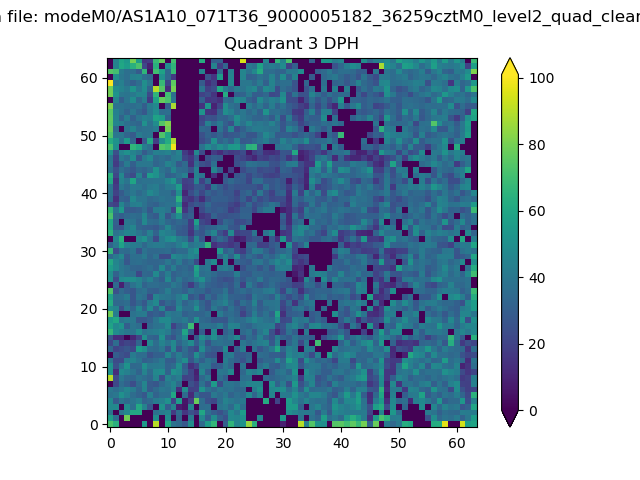 |
 |
Quadrant C |
| Plot type | Count rate plots | Images |
|---|---|---|
| Comparison with Poisson distribution Blue bars denote a histogram of data divided into 1 sec bins. Red curve is a Poisson curve with rate = median count rate of data. |
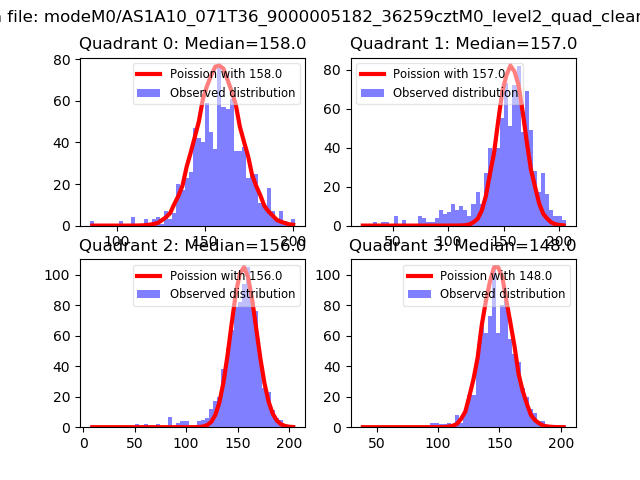 |
 |
| Quadrant-wise count rates Data is divided into 100 sec bins |
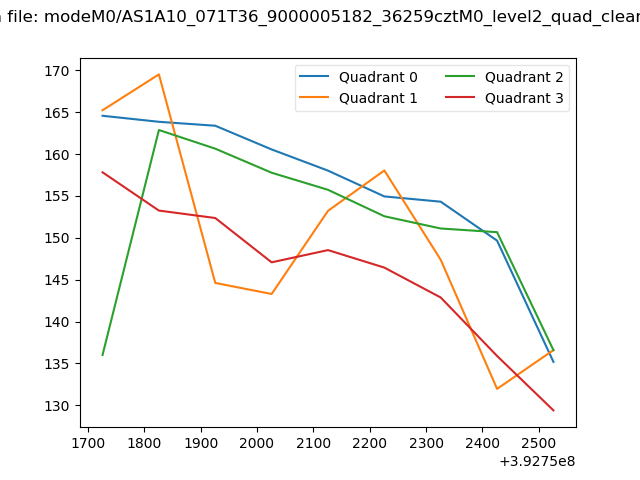 |
|
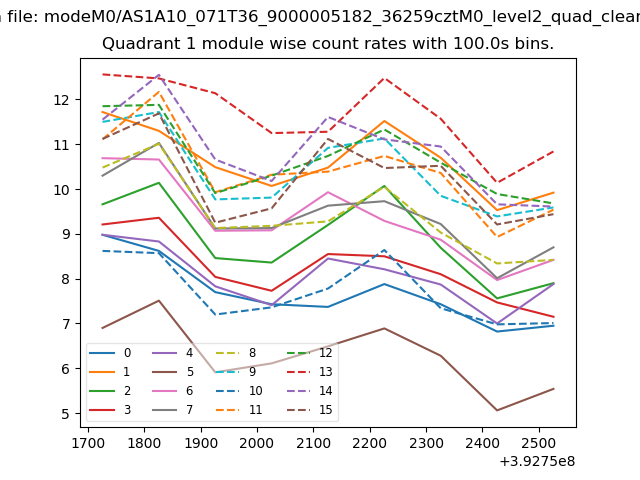
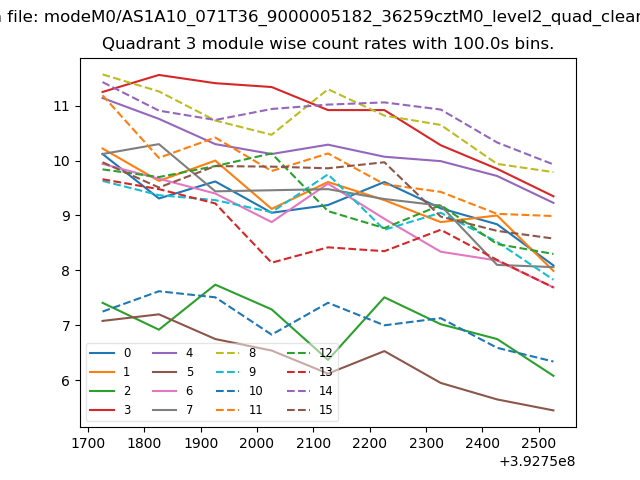
| Module-wise count rates for Quadrant A Data is divided into 100 sec bins |
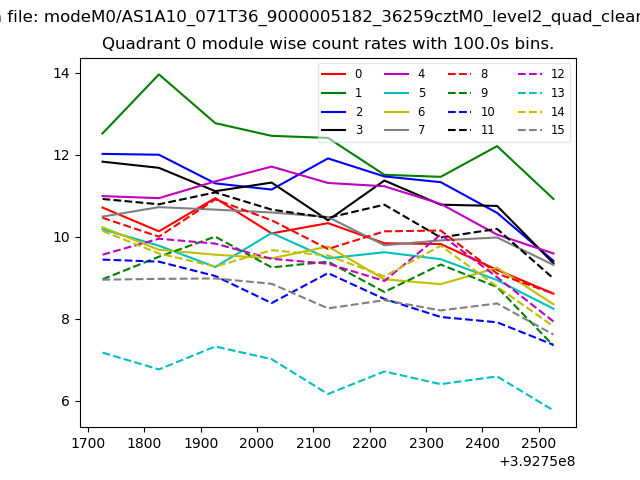 |
 |
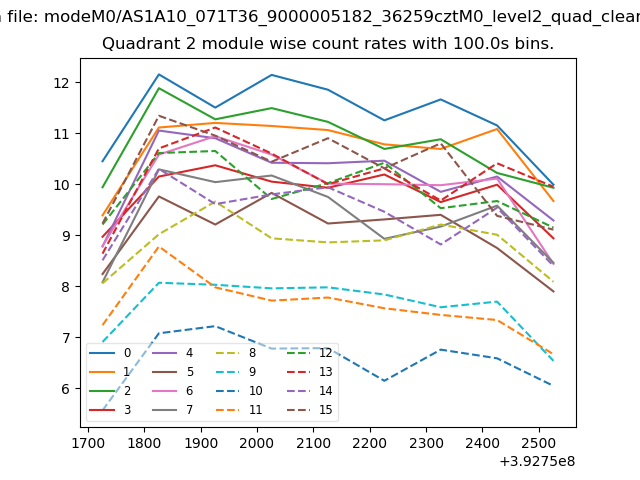
| Module-wise count rates for Quadrant B Data is divided into 100 sec bins |
 |
 |
| Module-wise count rates for Quadrant C Data is divided into 100 sec bins |
 |
 |
| Module-wise count rates for Quadrant D Data is divided into 100 sec bins |
 |
 |
| Parameter | Plot |
|---|---|
| CZT HV Monitor | 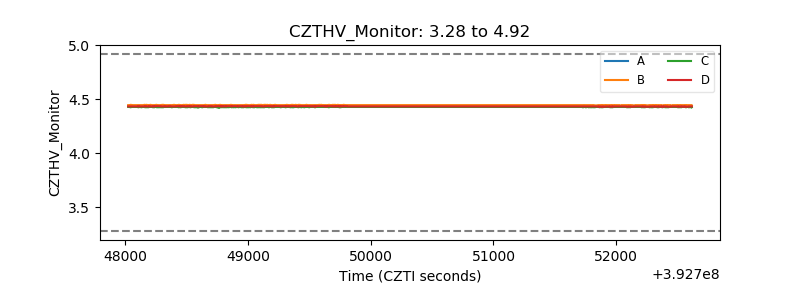 |
| D_VDD | 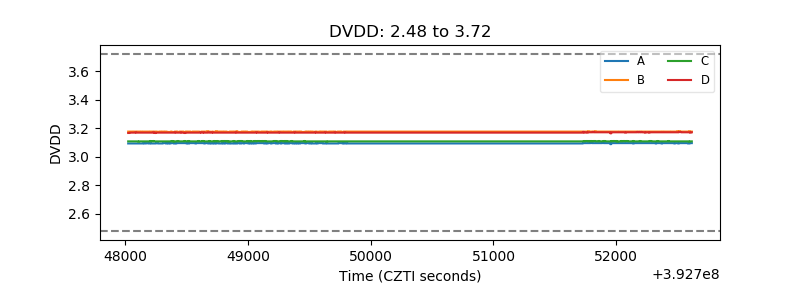 |
| Temperature 1 | 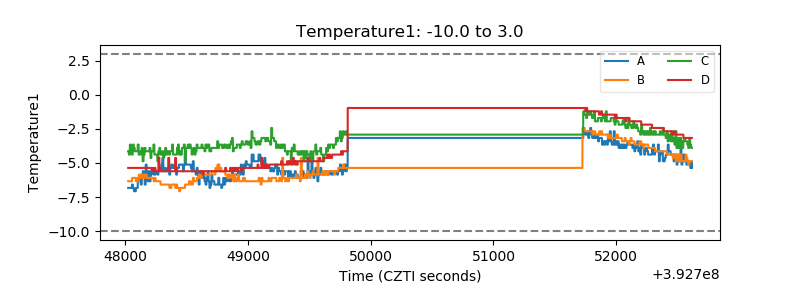 |
| Veto HV Monitor | 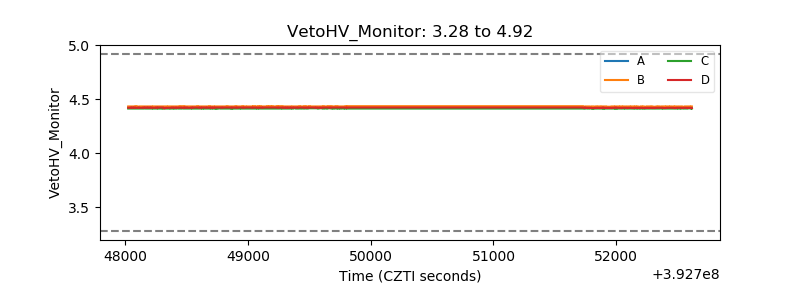 |
| Veto LLD | 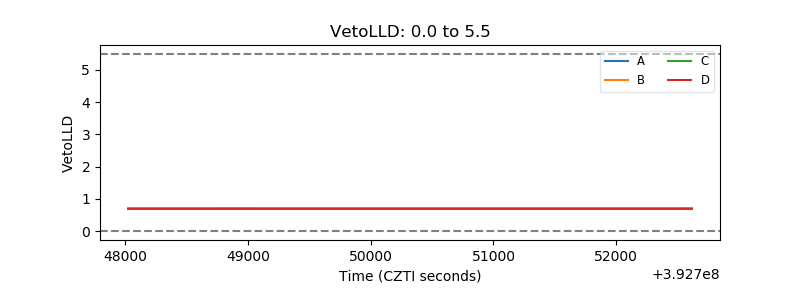 |
| Alpha Counter | 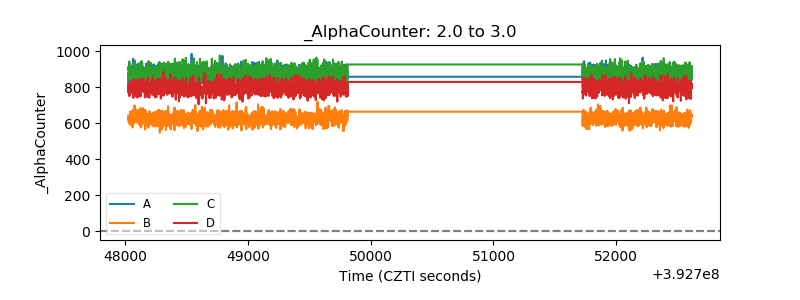 |
| _CPM_Rate | 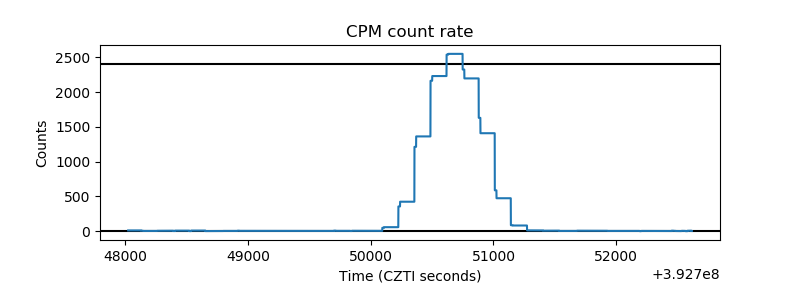 |
| CZT Counter | 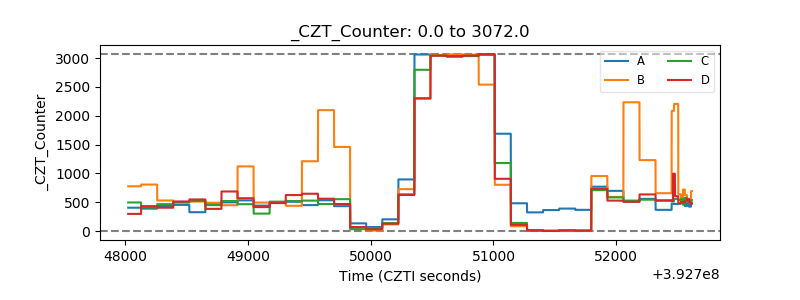 |
| +2.5 Volts monitor | 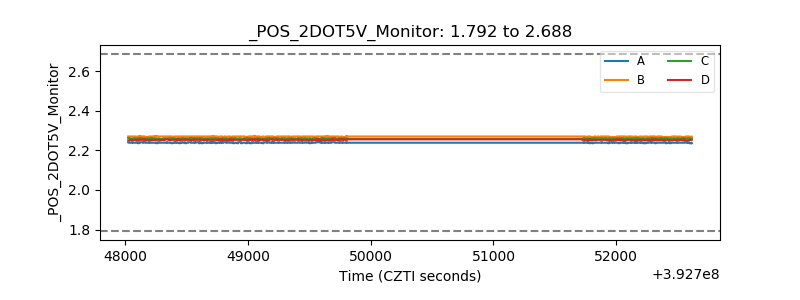 |
| +5 Volts monitor | 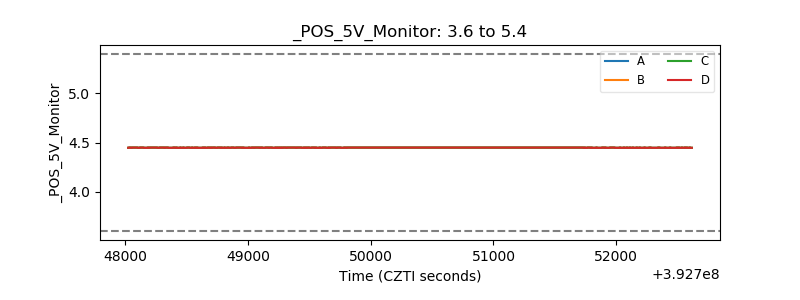 |
| _ROLL_ROT | 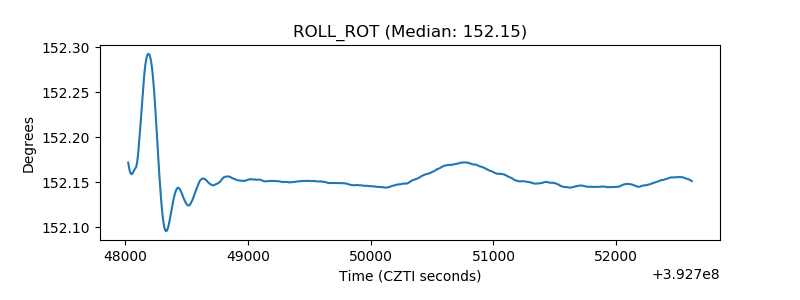 |
| _Roll_DEC | 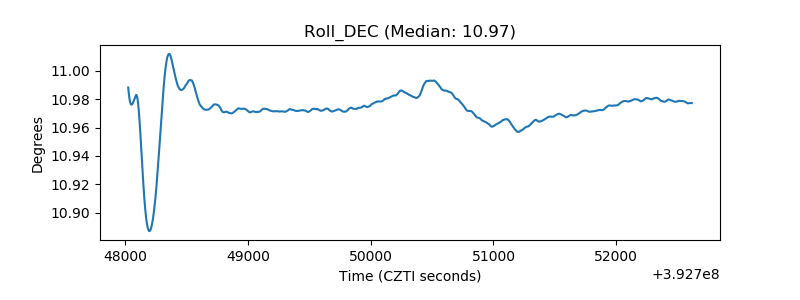 |
| _Roll_RA | 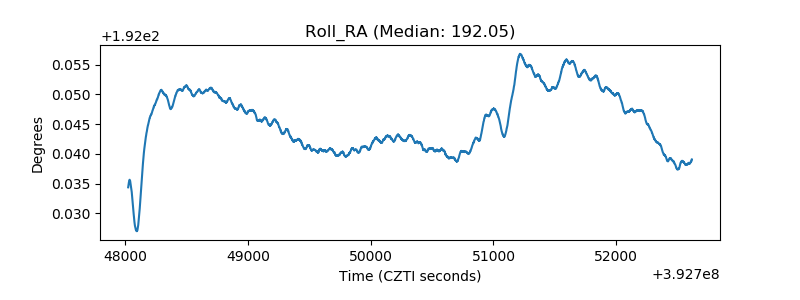 |
| Veto Counter | 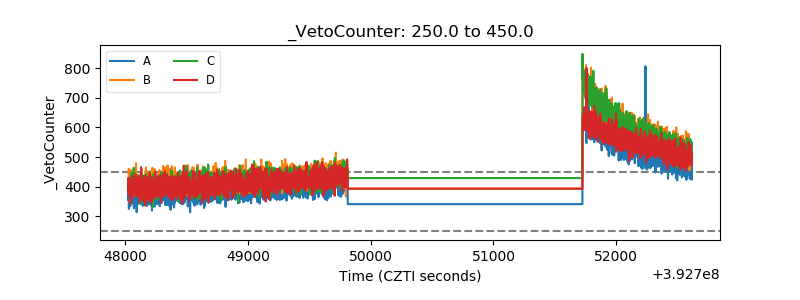 |