| Param | Original file | Final file |
|---|---|---|
| Filename | modeM0/AS1A10_071T36_9000005182cztM0_level2_bc.evt | modeM0/AS1A10_071T36_9000005182cztM0_level2_quad_clean.evt |
| Size (bytes) | 2,666,517,120 | 708,056,640 |
| Size | 2.5 GB | 675.3 MB |
| Events in quadrant A | 13,335,395 | 4,512,800 |
| Events in quadrant B | 23,310,085 | 4,391,275 |
| Events in quadrant C | 16,213,827 | 4,433,642 |
| Events in quadrant D | 23,937,136 | 4,116,110 |
| Mode SS | |||
|---|---|---|---|
| Quadrant | BADHDUFLAG | Total packets | Discarded packets |
| A | 0 | 1188 | 0 |
| B | 0 | 1188 | 0 |
| C | 0 | 1188 | 0 |
| D | 0 | 1188 | 0 |
| Mode M9 | |||
|---|---|---|---|
| Quadrant | BADHDUFLAG | Total packets | Discarded packets |
| A | 0 | 224 | 0 |
| B | 0 | 224 | 0 |
| C | 0 | 224 | 0 |
| D | 0 | 224 | 0 |
| Mode M0 | |||
|---|---|---|---|
| Quadrant | BADHDUFLAG | Total packets | Discarded packets |
| A | 0 | 120480 | 0 |
| B | 0 | 164468 | 0 |
| C | 0 | 127203 | 0 |
| D | 0 | 162790 | 0 |
| Quadrant | Total seconds | Saturated seconds | Saturation percentage |
|---|---|---|---|
| A | 58188 | 125 | 0.214821% |
| B | 58188 | 4076 | 7.004881% |
| C | 58188 | 508 | 0.873032% |
| D | 58188 | 2570 | 4.416718% |
Noise dominated data is calculated using 1-second bins in cleaned event files. If a bin has >2000 counts, and if more than 50% of those come from <1% of pixels, then it is considered to be noise-dominated and hence unusable.
| Quadrant | # 1 sec bins | Bins with >0 counts | Bins with >2000 counts | High rate bins dominated by noise | Noise dominated (total time) | Noise dominated (detector-on time) | Marked lightcurve |
|---|---|---|---|---|---|---|---|
| A | 80417 | 58201 | 10 | 10 | 0.01% | 0.02% | 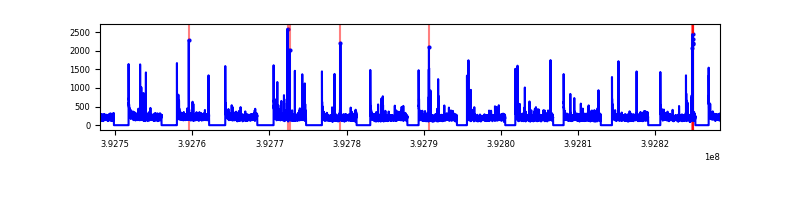 |
| B | 80417 | 58187 | 280 | 280 | 0.35% | 0.48% | 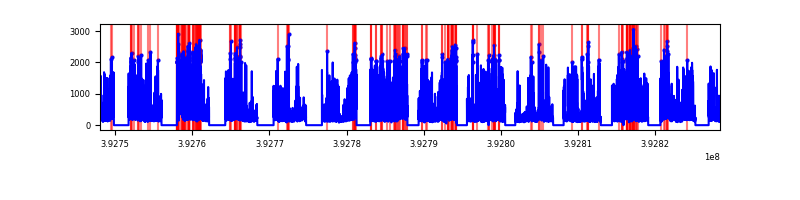 |
| C | 80417 | 58190 | 75 | 75 | 0.09% | 0.13% | 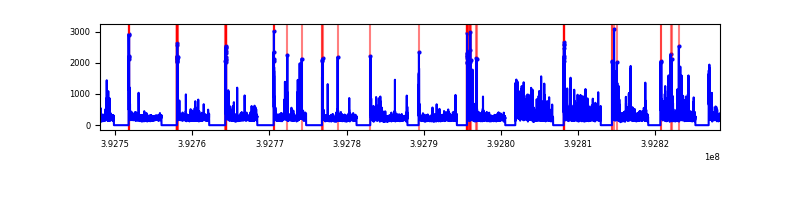 |
| D | 80417 | 58179 | 423 | 423 | 0.53% | 0.73% | 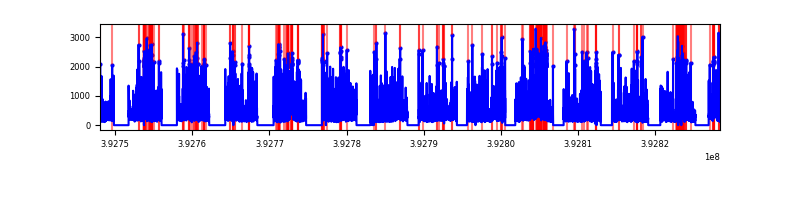 |
Top three noisy pixels from each quadrant. If the there are fewer than three noisy pixels in the level2.evt file, extra rows are filled as -1
| Pixel properties | Quadrant properties | ||||||
|---|---|---|---|---|---|---|---|
| Quadrant | DetID | PixID | Counts | Sigma | Mean | Median | Sigma |
| A | 10 | 83 | 1465202 | 2227.68 | 2978 | 2926 | 656.4 |
| A | 9 | 143 | 183009 | 274.34 | 2978 | 2926 | 656.4 |
| A | 13 | 254 | 82071 | 120.57 | 2978 | 2926 | 656.4 |
| B | 5 | 172 | 6278244 | 10770.85 | 2928 | 2861 | 582.6 |
| B | 5 | 236 | 2544783 | 4362.87 | 2928 | 2861 | 582.6 |
| B | 4 | 171 | 1410369 | 2415.8 | 2928 | 2861 | 582.6 |
| C | 15 | 214 | 2274290 | 3408.4 | 2911 | 2890 | 666.4 |
| C | 0 | 10 | 1937742 | 2903.39 | 2911 | 2890 | 666.4 |
| C | 0 | 207 | 476089 | 710.07 | 2911 | 2890 | 666.4 |
| D | 12 | 6 | 4324066 | 6380.12 | 2863 | 2775 | 677.3 |
| D | 13 | 171 | 1608822 | 2371.23 | 2863 | 2775 | 677.3 |
| D | 7 | 223 | 1548156 | 2281.66 | 2863 | 2775 | 677.3 |
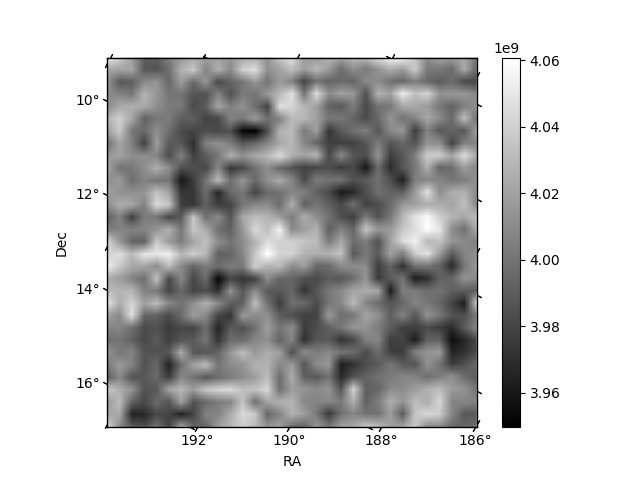
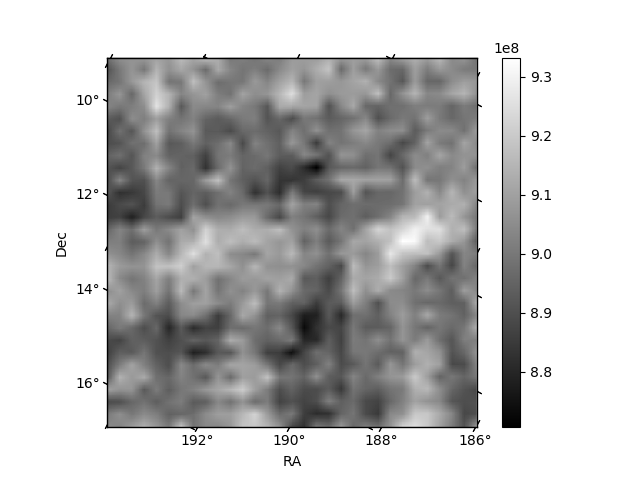
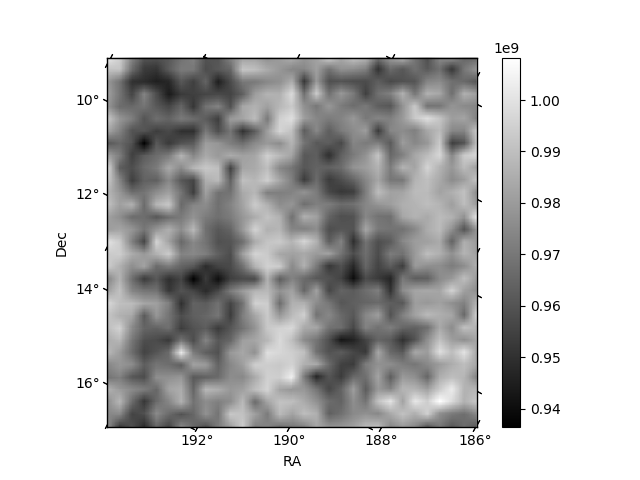
Histogram calculated using DETX and DETY for each event in the final _common_clean file
| Quadrant A | 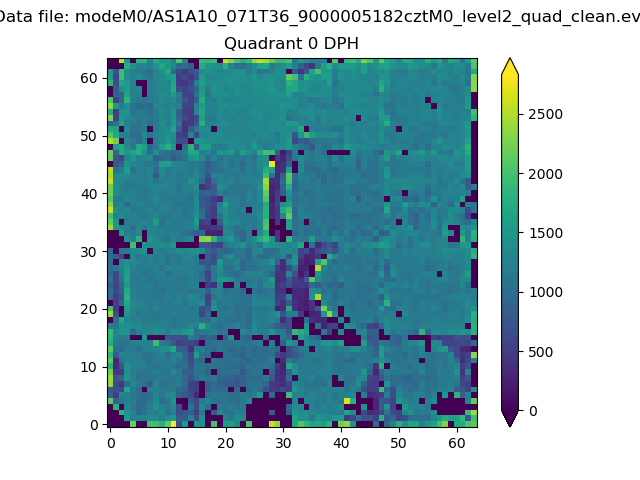 |
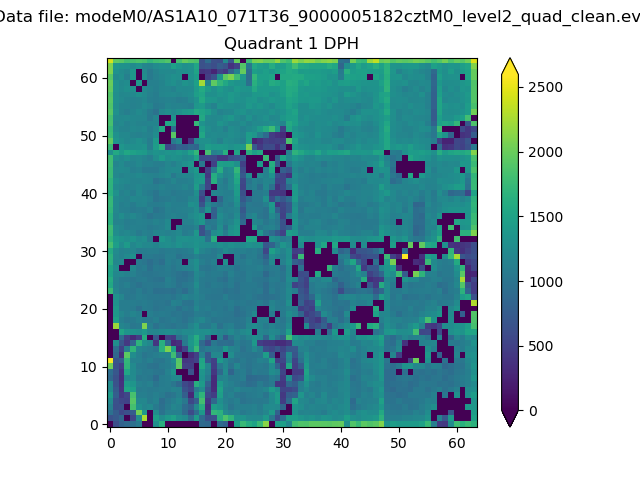 |
Quadrant B |
|---|---|---|---|
| Quadrant D | 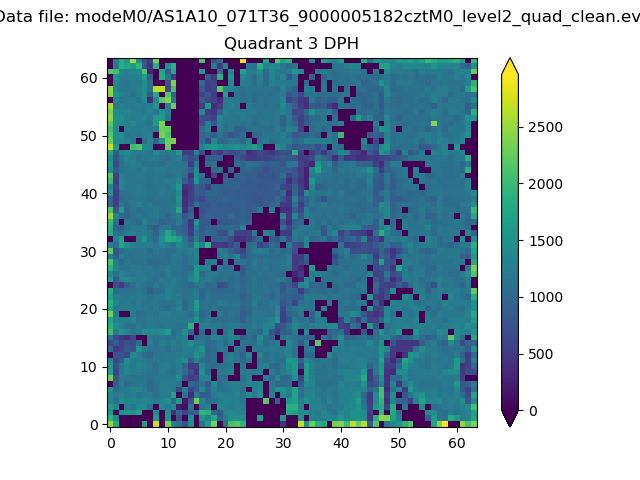 |
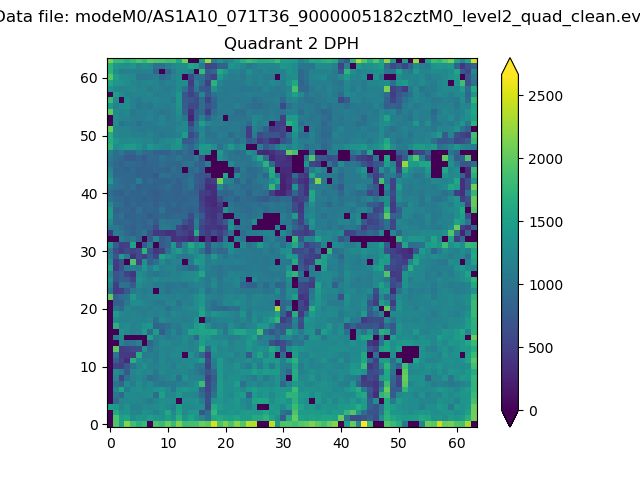 |
Quadrant C |
| Plot type | Count rate plots | Images |
|---|---|---|
| Comparison with Poisson distribution Blue bars denote a histogram of data divided into 1 sec bins. Red curve is a Poisson curve with rate = median count rate of data. |
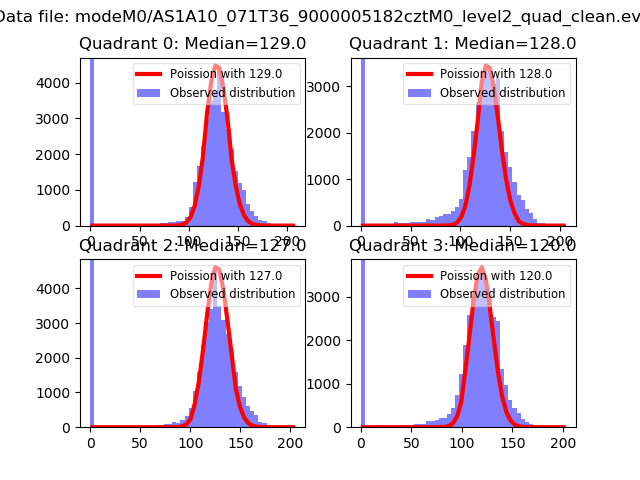 |
 |
| Quadrant-wise count rates Data is divided into 100 sec bins |
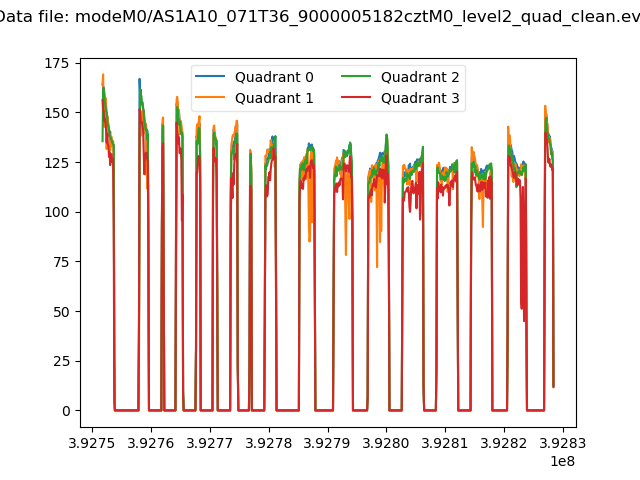 |
|
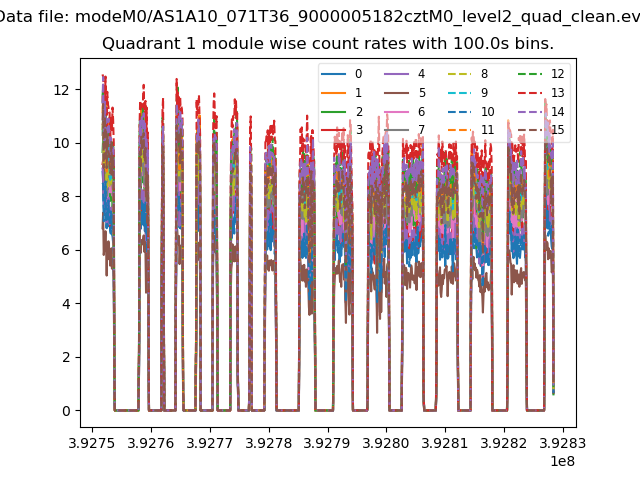
| Module-wise count rates for Quadrant A Data is divided into 100 sec bins |
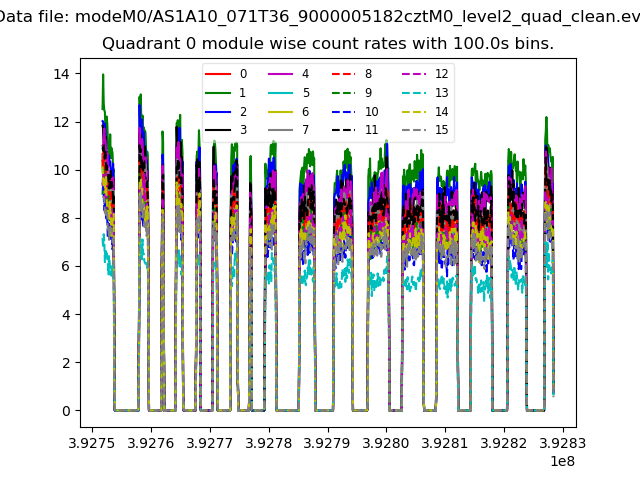 |
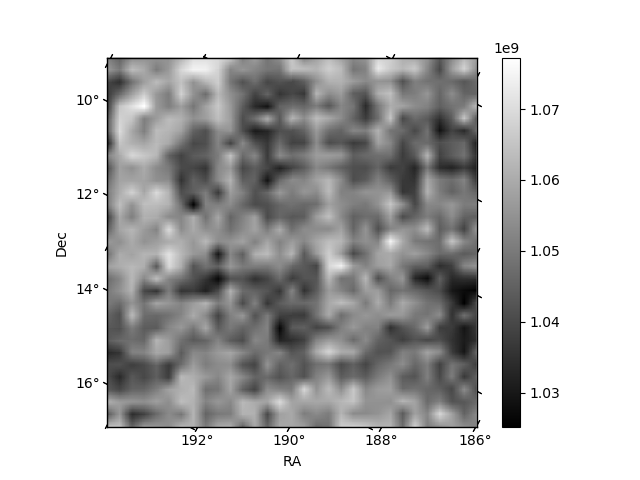 |
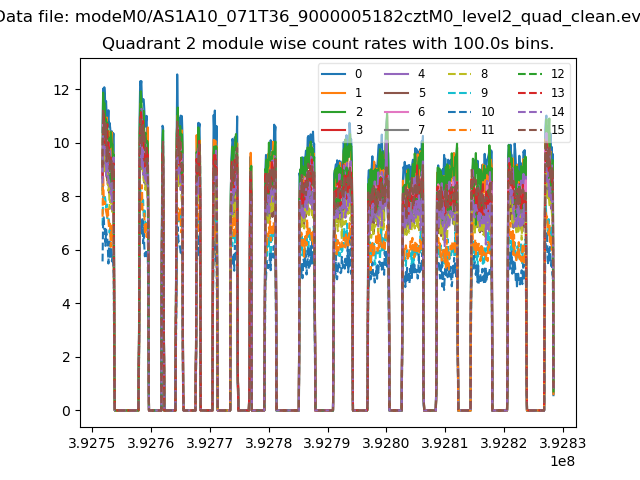
| Module-wise count rates for Quadrant B Data is divided into 100 sec bins |
 |
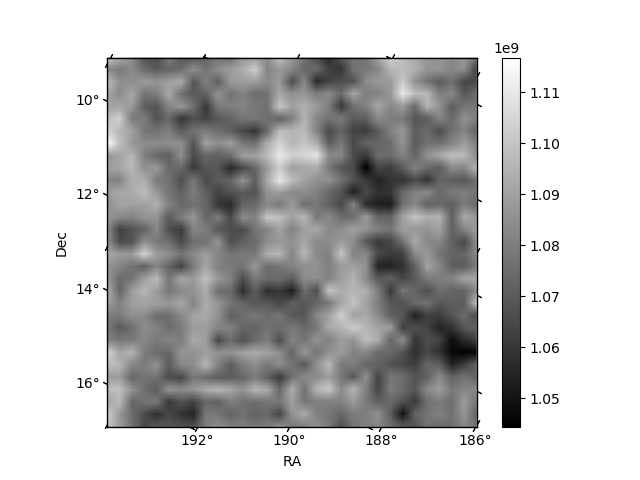 |
| Module-wise count rates for Quadrant C Data is divided into 100 sec bins |
 |
 |
| Module-wise count rates for Quadrant D Data is divided into 100 sec bins |
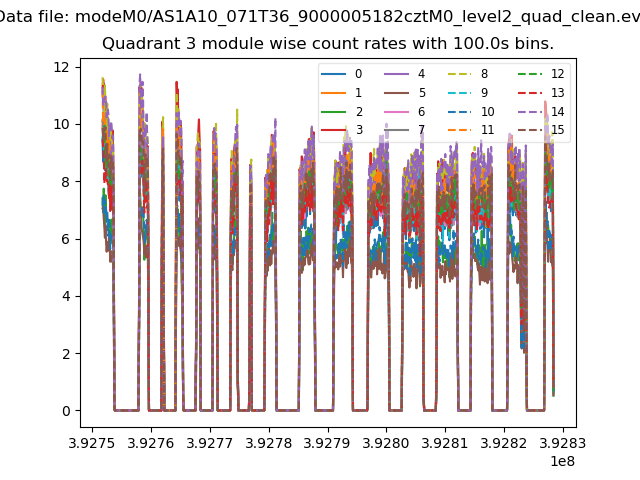 |
 |
| Parameter | Plot |
|---|---|
| CZT HV Monitor | 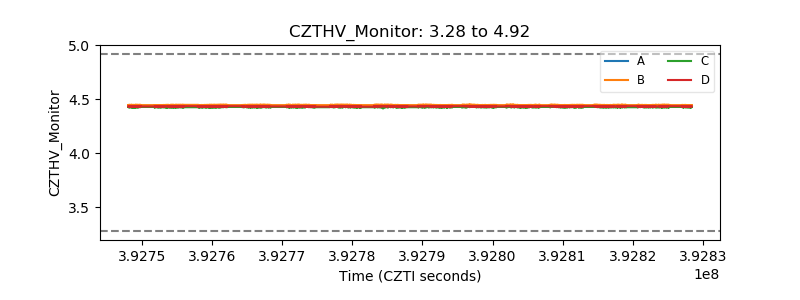 |
| D_VDD | 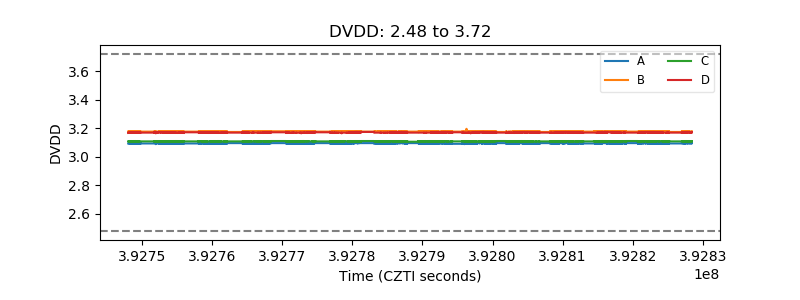 |
| Temperature 1 | 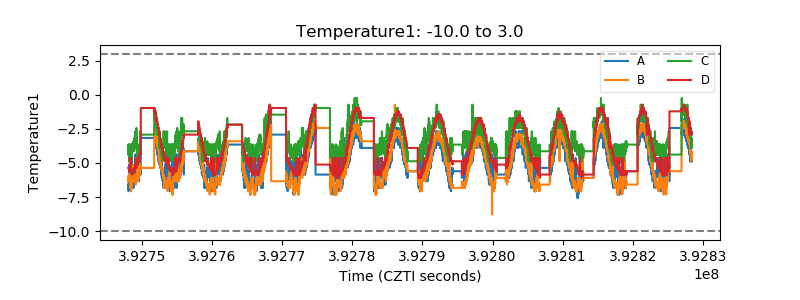 |
| Veto HV Monitor | 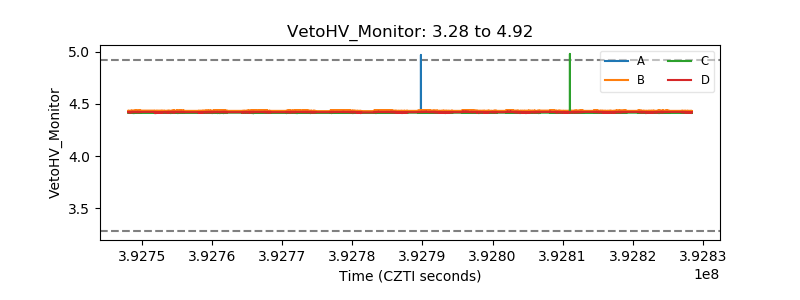 |
| Veto LLD | 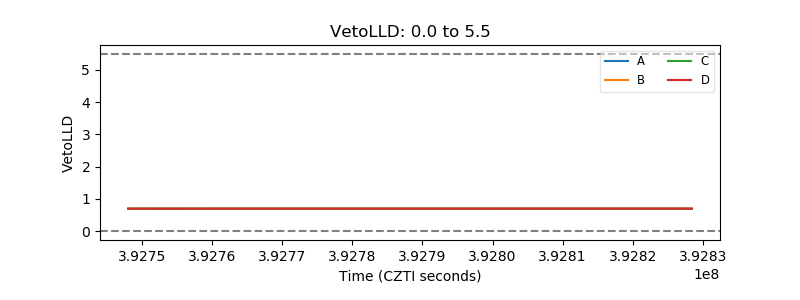 |
| Alpha Counter | 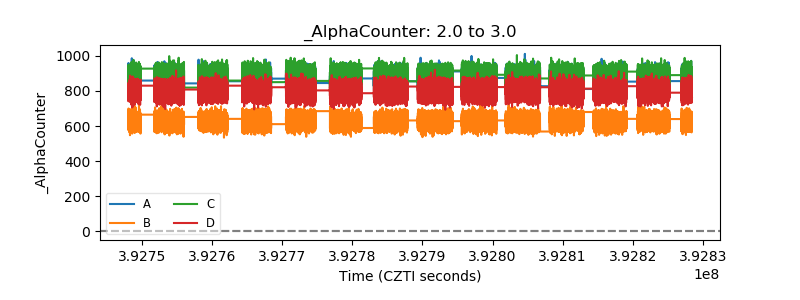 |
| _CPM_Rate | 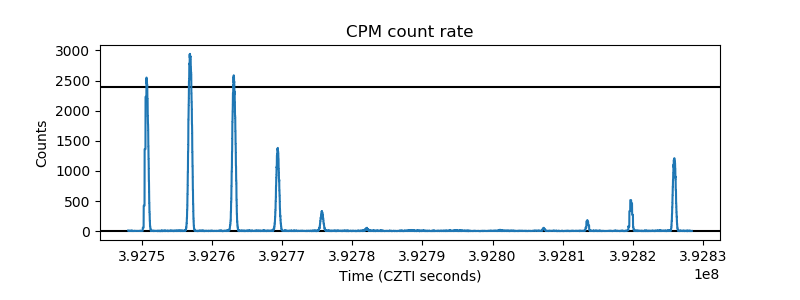 |
| CZT Counter | 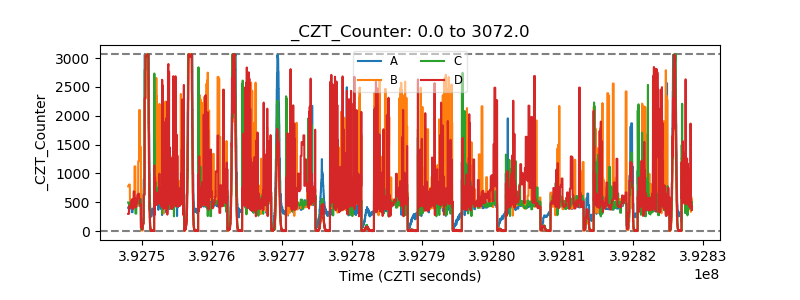 |
| +2.5 Volts monitor | 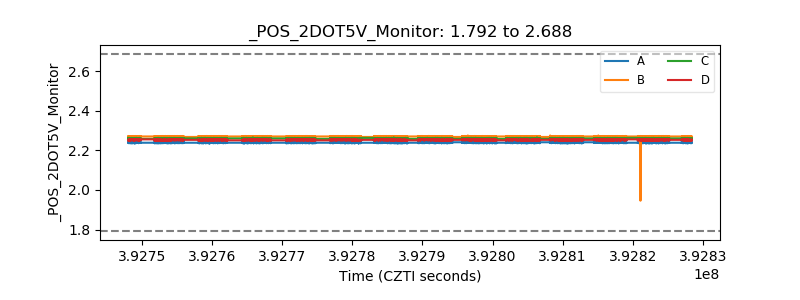 |
| +5 Volts monitor | 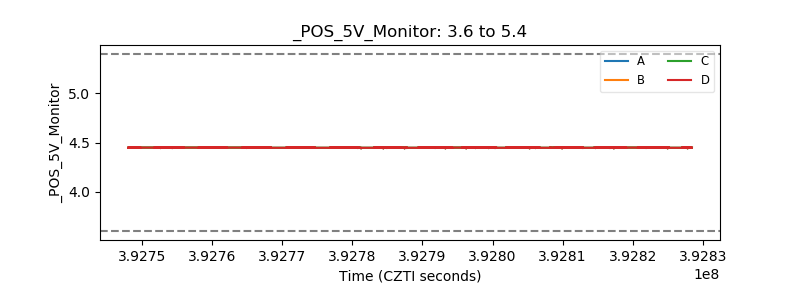 |
| _ROLL_ROT | 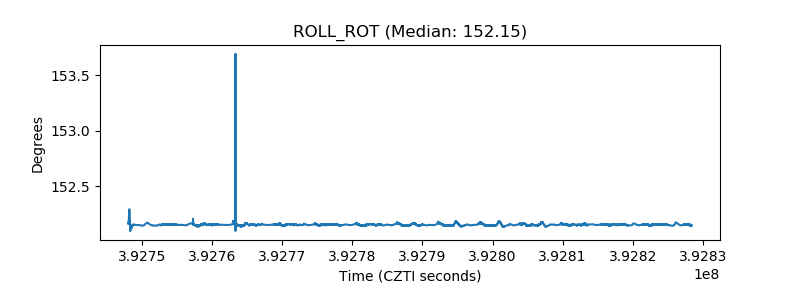 |
| _Roll_DEC | 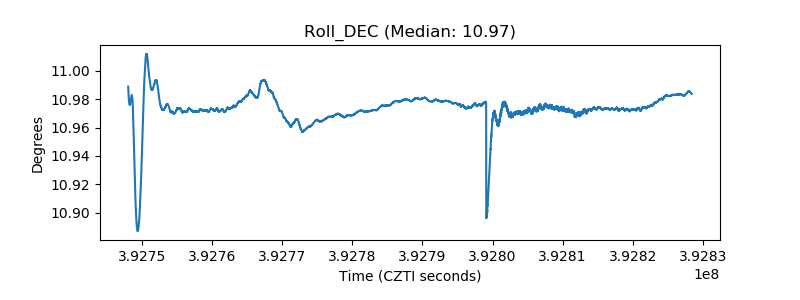 |
| _Roll_RA | 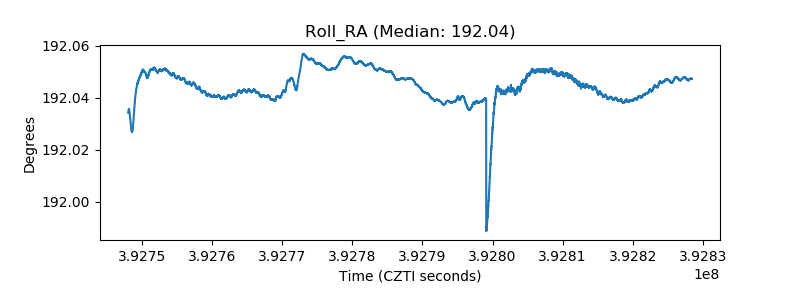 |
| Veto Counter | 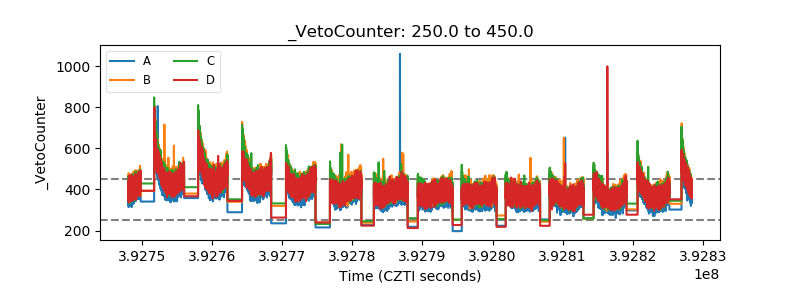 |