| Param | Original file | Final file |
|---|---|---|
| Filename | modeM0/AS1A10_071T37_9000005180_36258cztM0_level2.evt | modeM0/AS1A10_071T37_9000005180_36258cztM0_level2_quad_clean.evt |
| Size (bytes) | 454,731,840 | 74,727,360 |
| Size | 433.7 MB | 71.3 MB |
| Events in quadrant A | 2,628,909 | 490,944 |
| Events in quadrant B | 4,836,516 | 458,767 |
| Events in quadrant C | 2,801,723 | 479,707 |
| Events in quadrant D | 3,144,394 | 461,819 |
| Mode SS | |||
|---|---|---|---|
| Quadrant | BADHDUFLAG | Total packets | Discarded packets |
| A | 0 | 108 | 0 |
| B | 0 | 108 | 0 |
| C | 0 | 108 | 0 |
| D | 0 | 108 | 0 |
| Mode M9 | |||
|---|---|---|---|
| Quadrant | BADHDUFLAG | Total packets | Discarded packets |
| A | 0 | 22 | 0 |
| B | 0 | 22 | 0 |
| C | 0 | 22 | 0 |
| D | 0 | 23 | 0 |
| Mode M0 | |||
|---|---|---|---|
| Quadrant | BADHDUFLAG | Total packets | Discarded packets |
| A | 0 | 11248 | 3 |
| B | 0 | 17975 | 2 |
| C | 0 | 11551 | 2 |
| D | 0 | 12853 | 2 |
| Quadrant | Total seconds | Saturated seconds | Saturation percentage |
|---|---|---|---|
| A | 5304 | 12 | 0.226244% |
| B | 5304 | 673 | 12.688537% |
| C | 5304 | 75 | 1.414027% |
| D | 5304 | 75 | 1.414027% |
Noise dominated data is calculated using 1-second bins in cleaned event files. If a bin has >2000 counts, and if more than 50% of those come from <1% of pixels, then it is considered to be noise-dominated and hence unusable.
| Quadrant | # 1 sec bins | Bins with >0 counts | Bins with >2000 counts | High rate bins dominated by noise | Noise dominated (total time) | Noise dominated (detector-on time) | Marked lightcurve |
|---|---|---|---|---|---|---|---|
| A | 7066 | 5305 | 1 | 1 | 0.01% | 0.02% | 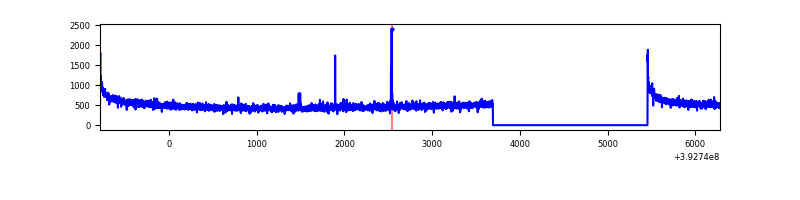 |
| B | 7066 | 5305 | 527 | 527 | 7.46% | 9.93% | 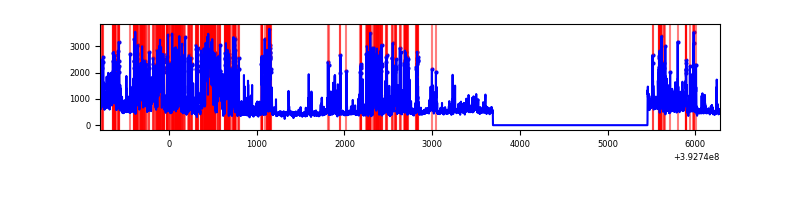 |
| C | 7066 | 5305 | 53 | 53 | 0.75% | 1.00% | 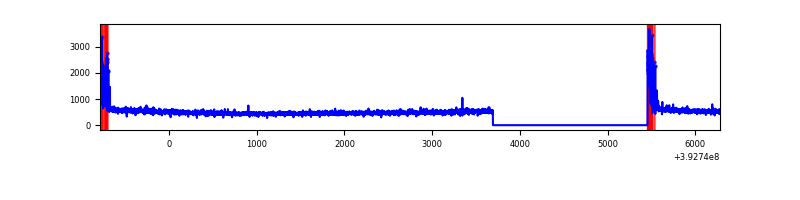 |
| D | 7066 | 5305 | 56 | 56 | 0.79% | 1.06% | 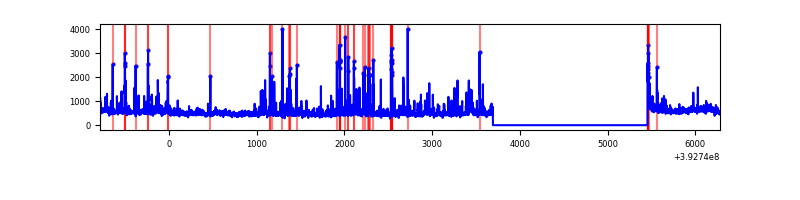 |
Top three noisy pixels from each quadrant. If the there are fewer than three noisy pixels in the level2.evt file, extra rows are filled as -1
| Pixel properties | Quadrant properties | ||||||
|---|---|---|---|---|---|---|---|
| Quadrant | DetID | PixID | Counts | Sigma | Mean | Median | Sigma |
| A | 10 | 83 | 182958 | 1443.1 | 627 | 615 | 126.4 |
| A | 9 | 143 | 14846 | 112.63 | 627 | 615 | 126.4 |
| A | 13 | 254 | 8918 | 65.71 | 627 | 615 | 126.4 |
| B | 5 | 172 | 1364430 | 12032.91 | 593 | 577 | 113.3 |
| B | 5 | 236 | 773735 | 6821.37 | 593 | 577 | 113.3 |
| B | 4 | 171 | 155158 | 1363.83 | 593 | 577 | 113.3 |
| C | 15 | 214 | 222921 | 1557.68 | 609 | 613 | 142.7 |
| C | 0 | 10 | 206148 | 1440.15 | 609 | 613 | 142.7 |
| C | 13 | 61 | 4124 | 24.6 | 609 | 613 | 142.7 |
| D | 12 | 235 | 201932 | 1353.83 | 610 | 594 | 148.7 |
| D | 13 | 249 | 131129 | 877.74 | 610 | 594 | 148.7 |
| D | 12 | 6 | 120439 | 805.86 | 610 | 594 | 148.7 |
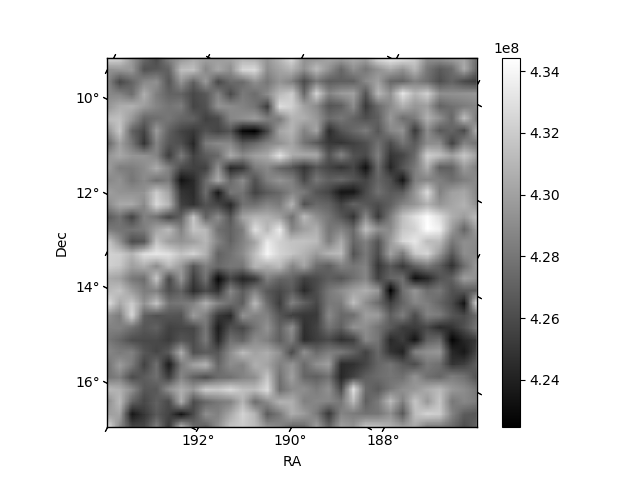
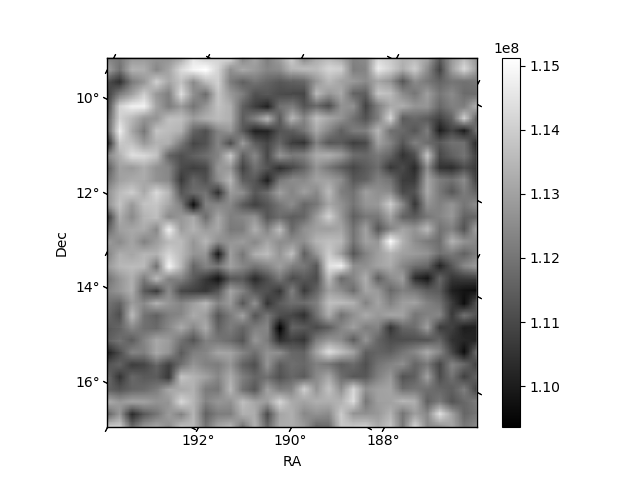
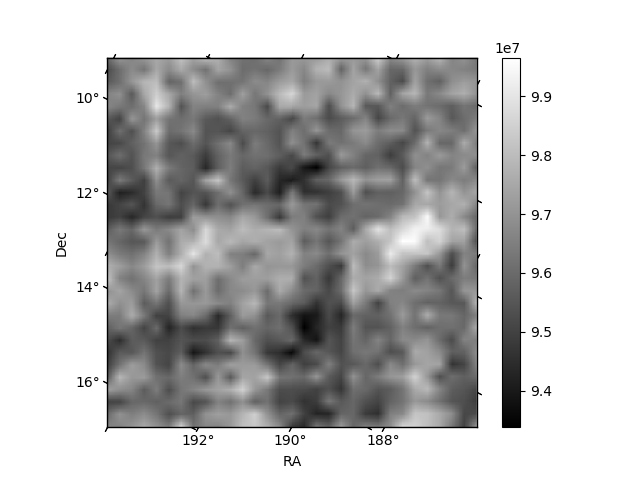
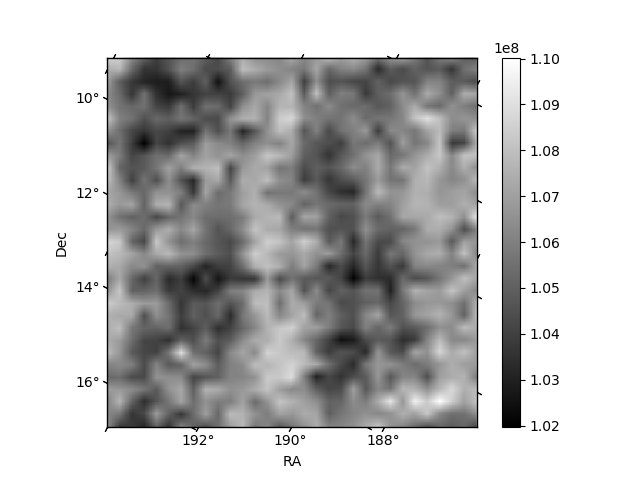
Histogram calculated using DETX and DETY for each event in the final _common_clean file
| Quadrant A | 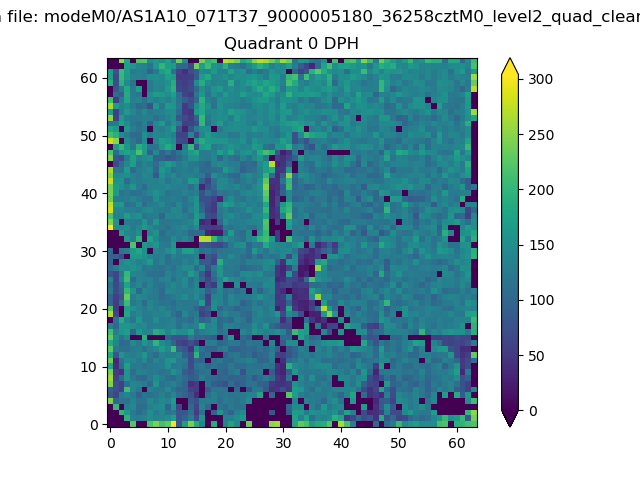 |
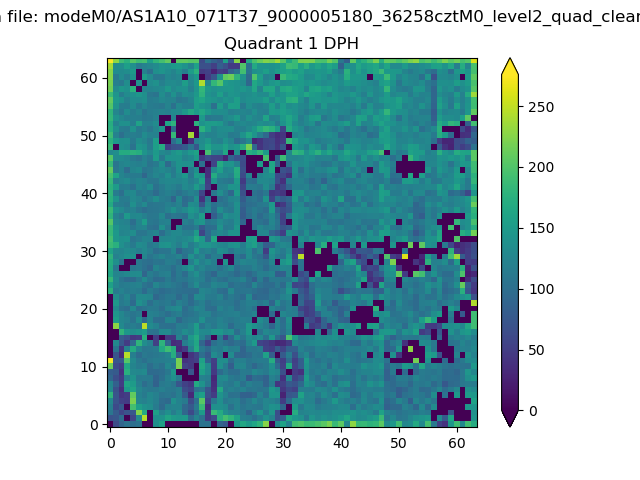 |
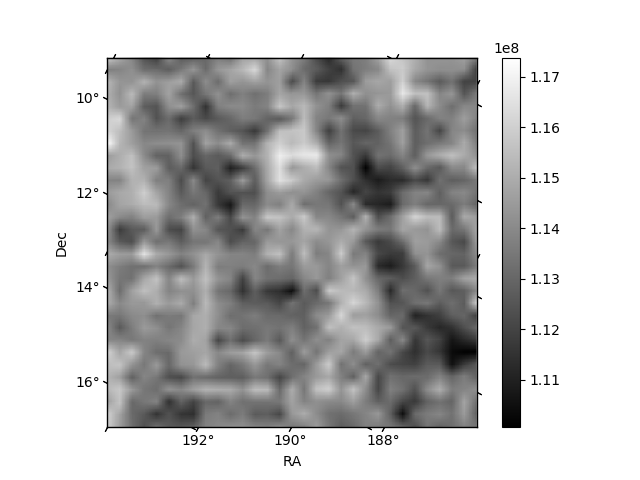
Quadrant B |
|---|---|---|---|
| Quadrant D | 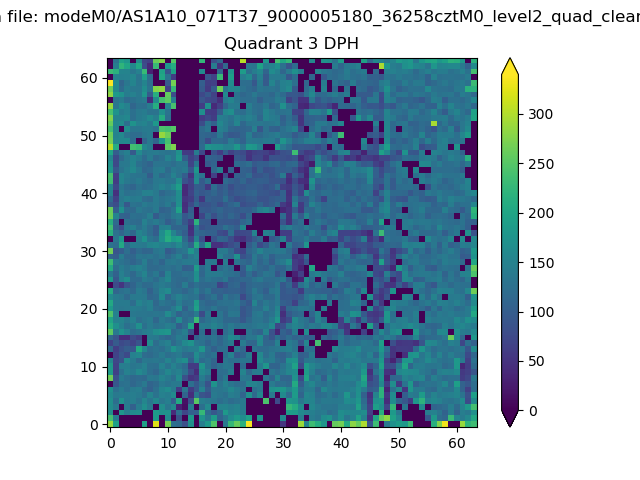 |
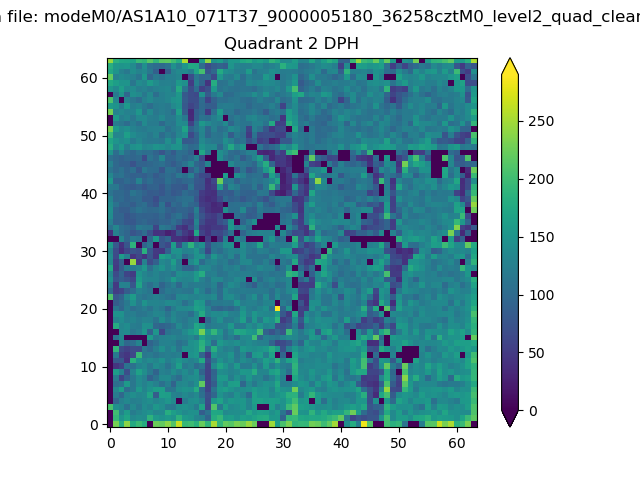 |
Quadrant C |
| Plot type | Count rate plots | Images |
|---|---|---|
| Comparison with Poisson distribution Blue bars denote a histogram of data divided into 1 sec bins. Red curve is a Poisson curve with rate = median count rate of data. |
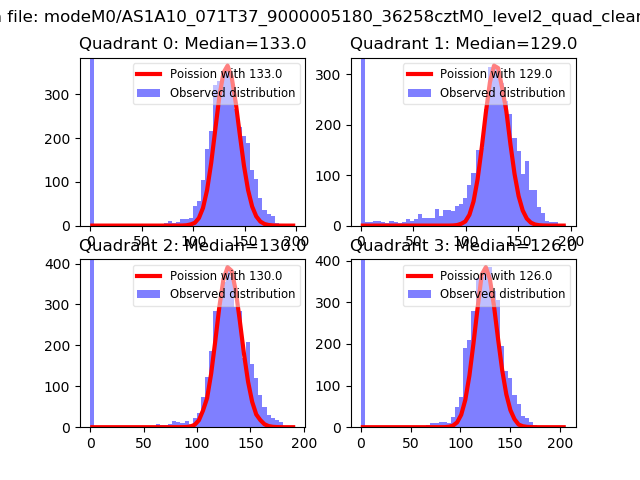 |
 |
| Quadrant-wise count rates Data is divided into 100 sec bins |
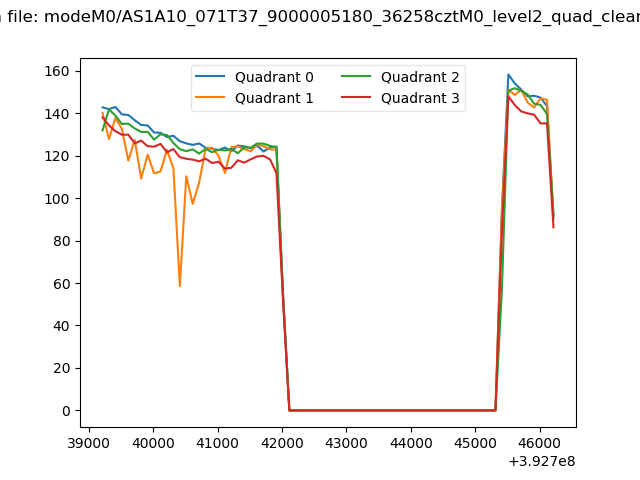 |
|
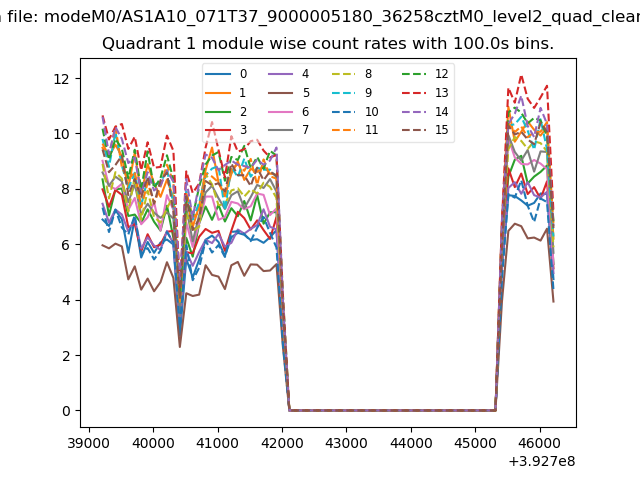
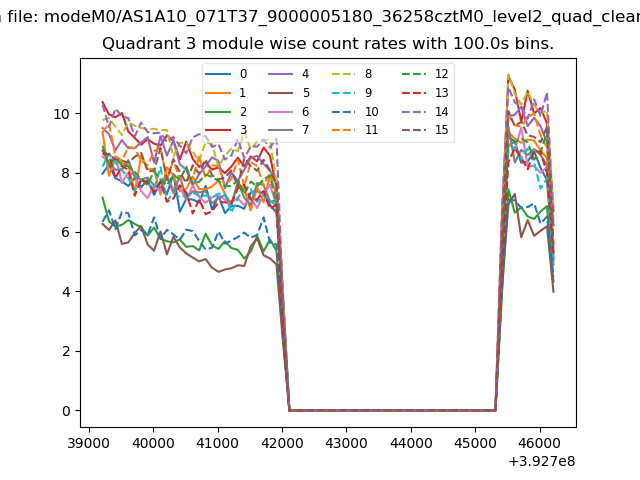
| Module-wise count rates for Quadrant A Data is divided into 100 sec bins |
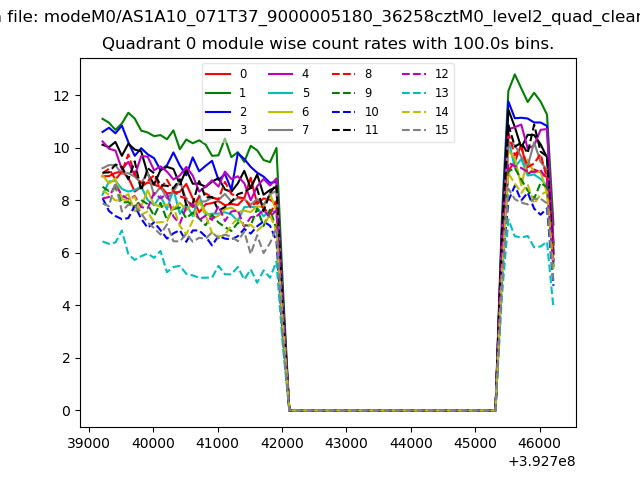 |
 |
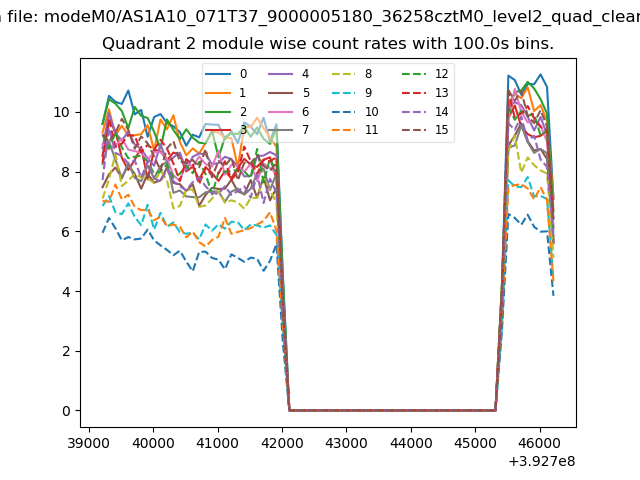
| Module-wise count rates for Quadrant B Data is divided into 100 sec bins |
 |
 |
| Module-wise count rates for Quadrant C Data is divided into 100 sec bins |
 |
 |
| Module-wise count rates for Quadrant D Data is divided into 100 sec bins |
 |
 |
| Parameter | Plot |
|---|---|
| CZT HV Monitor | 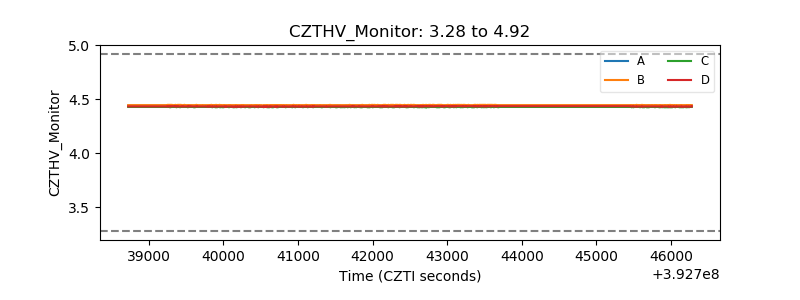 |
| D_VDD | 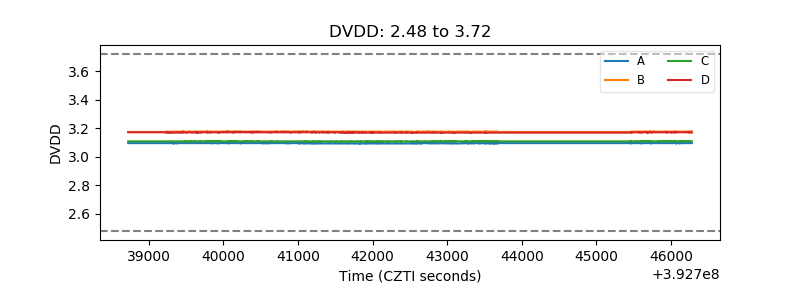 |
| Temperature 1 | 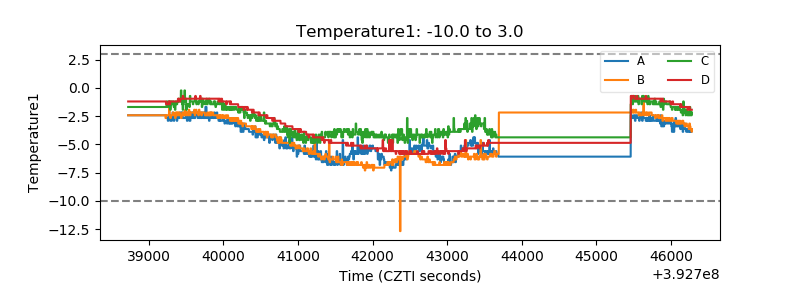 |
| Veto HV Monitor | 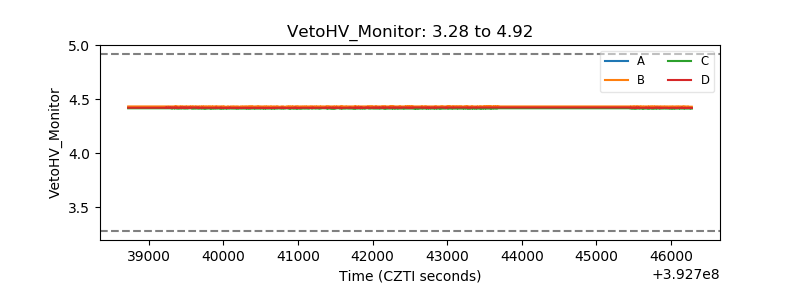 |
| Veto LLD | 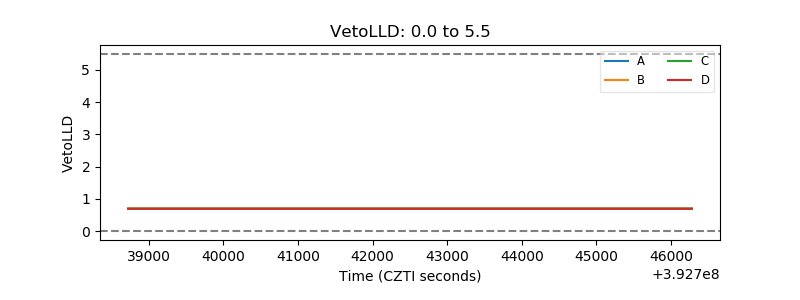 |
| Alpha Counter | 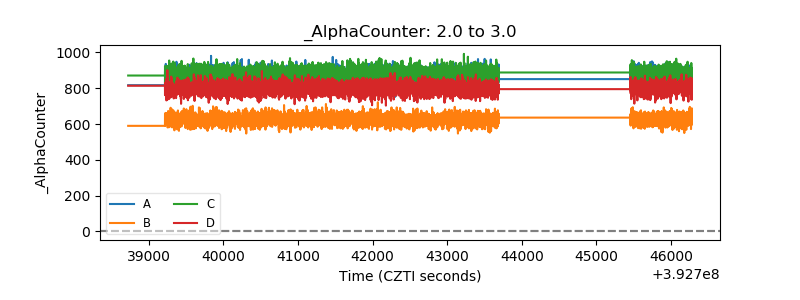 |
| _CPM_Rate | 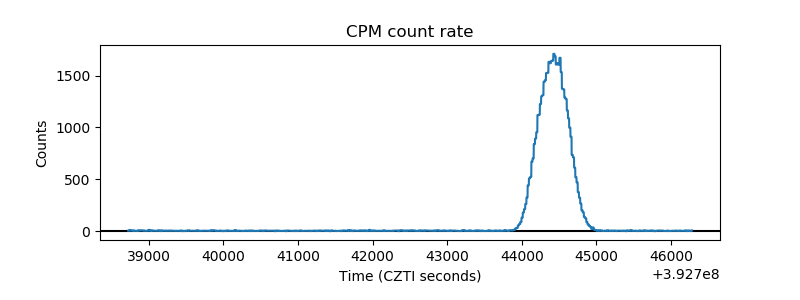 |
| CZT Counter | 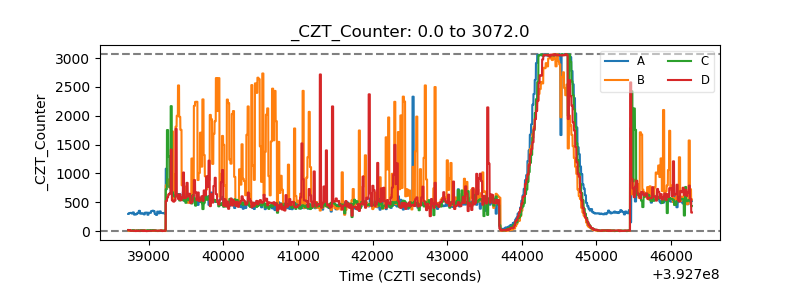 |
| +2.5 Volts monitor | 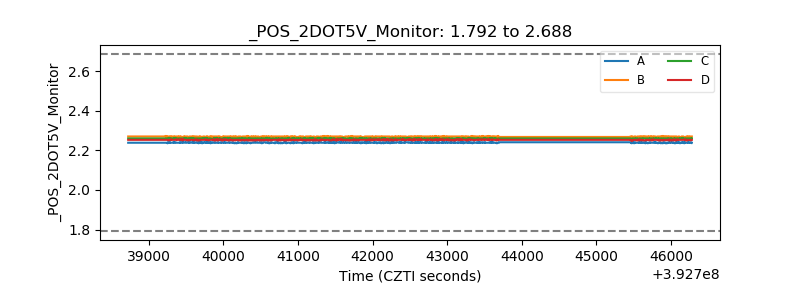 |
| +5 Volts monitor | 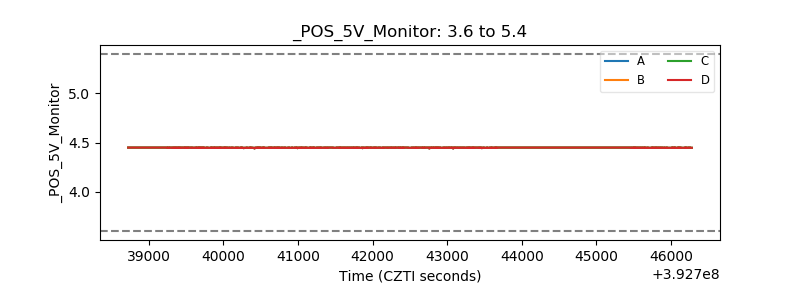 |
| _ROLL_ROT | 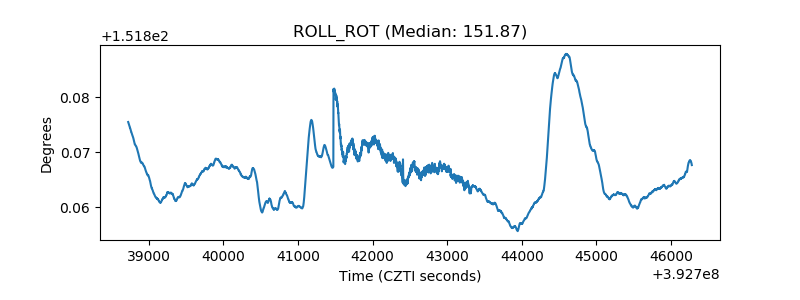 |
| _Roll_DEC | 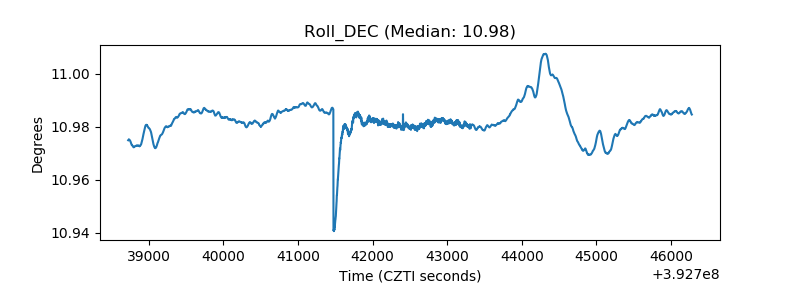 |
| _Roll_RA | 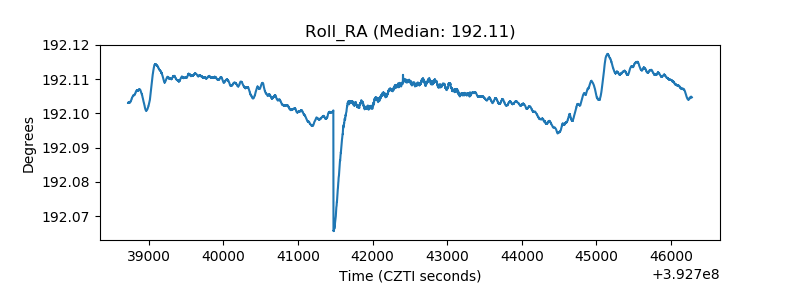 |
| Veto Counter | 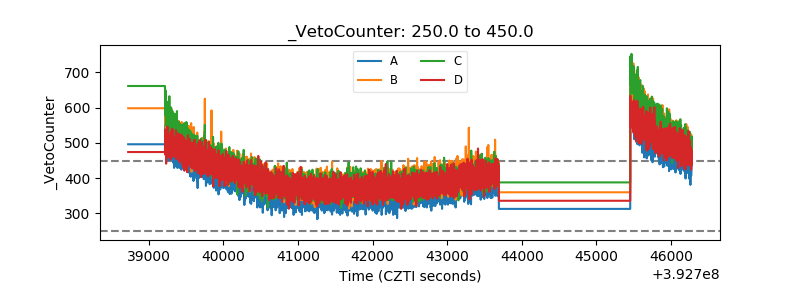 |