| Param | Original file | Final file |
|---|---|---|
| Filename | modeM0/AS1A10_071T37_9000005180_36256cztM0_level2.evt | modeM0/AS1A10_071T37_9000005180_36256cztM0_level2_quad_clean.evt |
| Size (bytes) | 445,181,760 | 79,940,160 |
| Size | 424.6 MB | 76.2 MB |
| Events in quadrant A | 2,697,401 | 523,614 |
| Events in quadrant B | 4,178,685 | 507,613 |
| Events in quadrant C | 2,840,619 | 514,483 |
| Events in quadrant D | 3,394,664 | 492,565 |
| Mode SS | |||
|---|---|---|---|
| Quadrant | BADHDUFLAG | Total packets | Discarded packets |
| A | 0 | 112 | 0 |
| B | 0 | 112 | 0 |
| C | 0 | 112 | 0 |
| D | 0 | 112 | 0 |
| Mode M9 | |||
|---|---|---|---|
| Quadrant | BADHDUFLAG | Total packets | Discarded packets |
| A | 0 | 28 | 0 |
| B | 0 | 28 | 0 |
| C | 0 | 28 | 0 |
| D | 0 | 29 | 0 |
| Mode M0 | |||
|---|---|---|---|
| Quadrant | BADHDUFLAG | Total packets | Discarded packets |
| A | 0 | 11600 | 3 |
| B | 0 | 16108 | 2 |
| C | 0 | 11781 | 2 |
| D | 0 | 13686 | 2 |
| Quadrant | Total seconds | Saturated seconds | Saturation percentage |
|---|---|---|---|
| A | 5460 | 18 | 0.329670% |
| B | 5460 | 390 | 7.142857% |
| C | 5460 | 59 | 1.080586% |
| D | 5460 | 86 | 1.575092% |
Noise dominated data is calculated using 1-second bins in cleaned event files. If a bin has >2000 counts, and if more than 50% of those come from <1% of pixels, then it is considered to be noise-dominated and hence unusable.
| Quadrant | # 1 sec bins | Bins with >0 counts | Bins with >2000 counts | High rate bins dominated by noise | Noise dominated (total time) | Noise dominated (detector-on time) | Marked lightcurve |
|---|---|---|---|---|---|---|---|
| A | 7132 | 5461 | 4 | 4 | 0.06% | 0.07% | 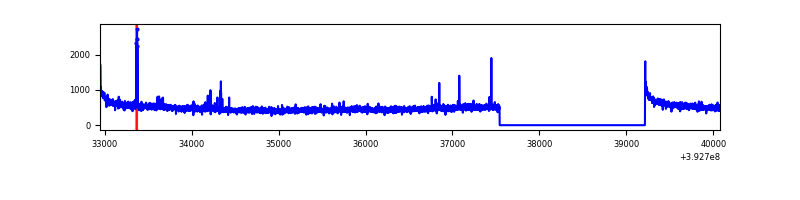 |
| B | 7132 | 5461 | 274 | 274 | 3.84% | 5.02% | 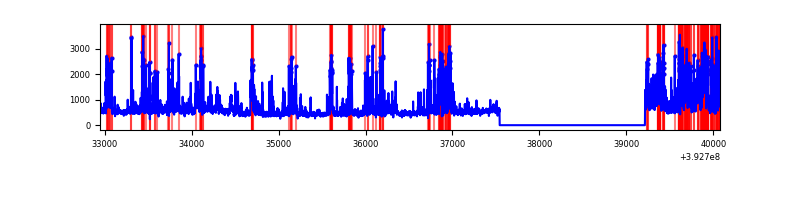 |
| C | 7132 | 5461 | 37 | 37 | 0.52% | 0.68% | 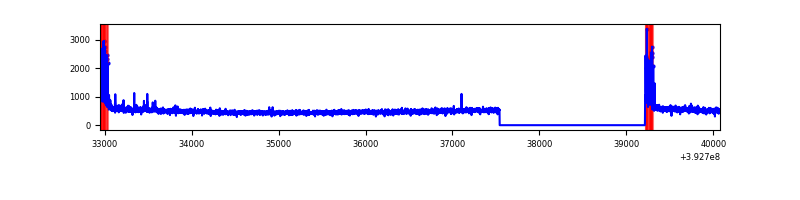 |
| D | 7132 | 5461 | 70 | 70 | 0.98% | 1.28% | 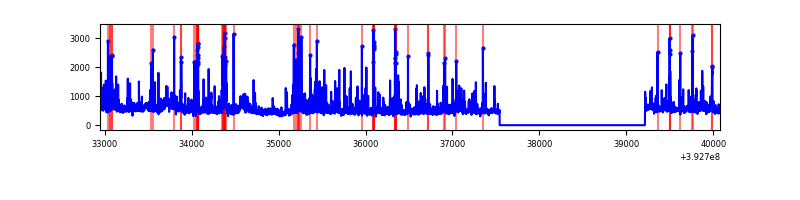 |
Top three noisy pixels from each quadrant. If the there are fewer than three noisy pixels in the level2.evt file, extra rows are filled as -1
| Pixel properties | Quadrant properties | ||||||
|---|---|---|---|---|---|---|---|
| Quadrant | DetID | PixID | Counts | Sigma | Mean | Median | Sigma |
| A | 10 | 83 | 182703 | 1400.52 | 639 | 624 | 130.0 |
| A | 9 | 143 | 34019 | 256.87 | 639 | 624 | 130.0 |
| A | 12 | 189 | 9216 | 66.09 | 639 | 624 | 130.0 |
| B | 5 | 172 | 824321 | 6908.51 | 616 | 600 | 119.2 |
| B | 5 | 236 | 446038 | 3735.87 | 616 | 600 | 119.2 |
| B | 4 | 171 | 326890 | 2736.58 | 616 | 600 | 119.2 |
| C | 15 | 214 | 228876 | 1564.63 | 620 | 624 | 145.9 |
| C | 0 | 10 | 195071 | 1332.91 | 620 | 624 | 145.9 |
| C | 13 | 61 | 4306 | 25.24 | 620 | 624 | 145.9 |
| D | 13 | 171 | 229481 | 1509.48 | 620 | 604 | 151.6 |
| D | 12 | 235 | 192329 | 1264.46 | 620 | 604 | 151.6 |
| D | 12 | 6 | 182127 | 1197.18 | 620 | 604 | 151.6 |
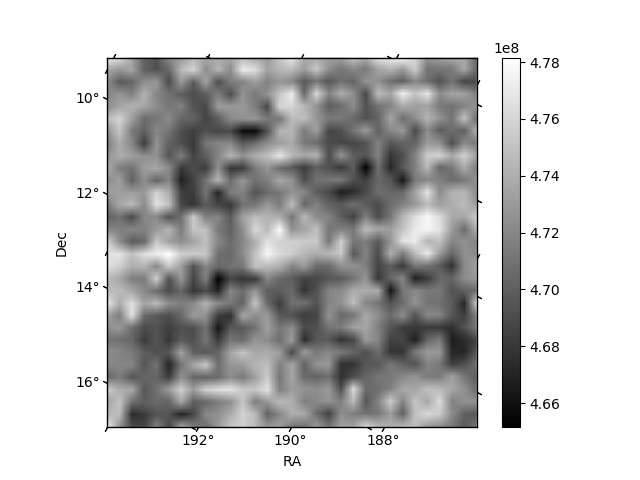
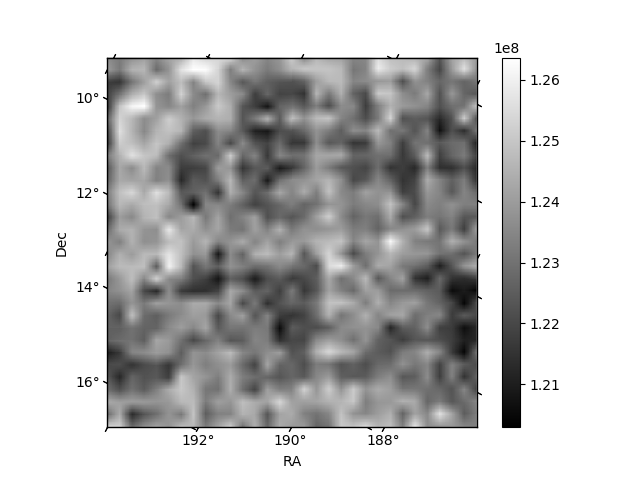
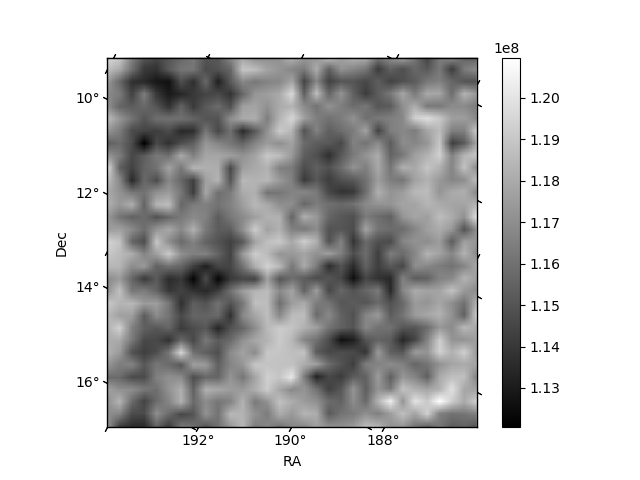
Histogram calculated using DETX and DETY for each event in the final _common_clean file
| Quadrant A | 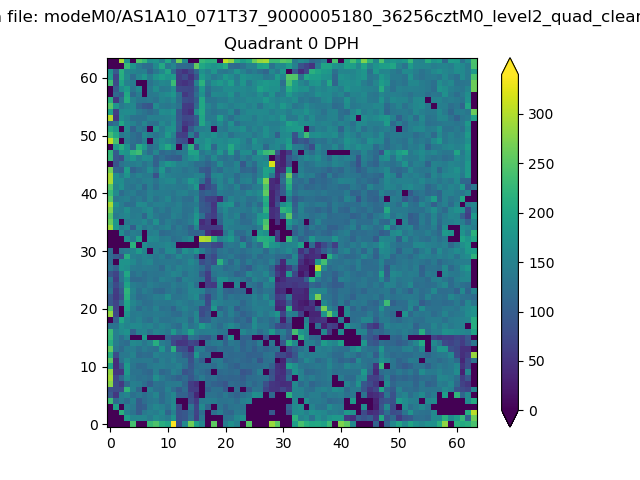 |
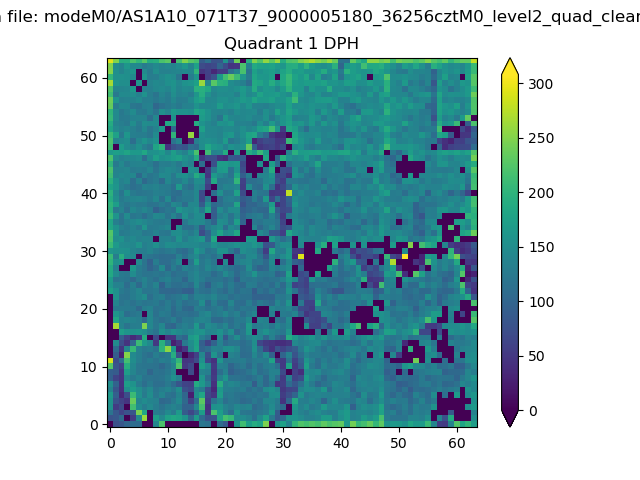 |
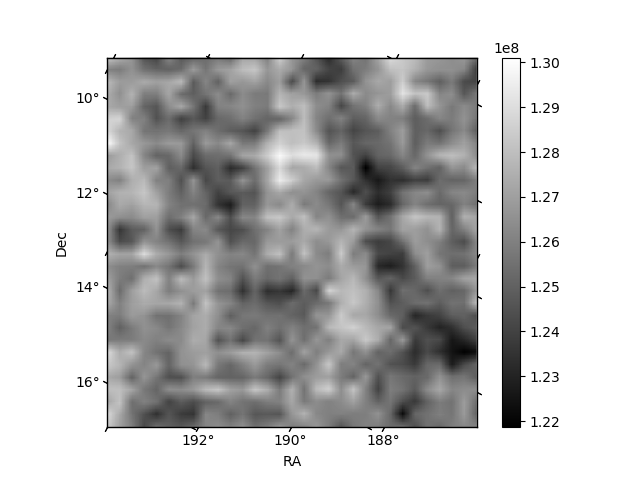
Quadrant B |
|---|---|---|---|
| Quadrant D | 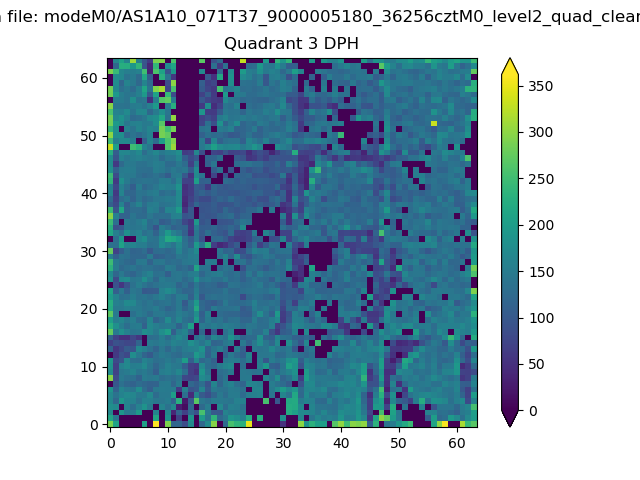 |
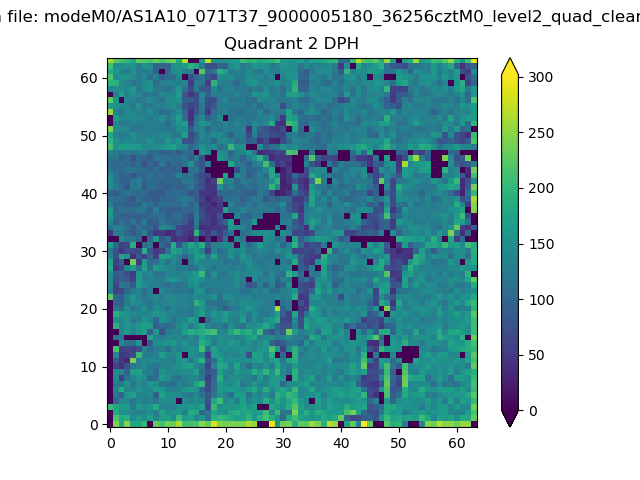 |
Quadrant C |
| Plot type | Count rate plots | Images |
|---|---|---|
| Comparison with Poisson distribution Blue bars denote a histogram of data divided into 1 sec bins. Red curve is a Poisson curve with rate = median count rate of data. |
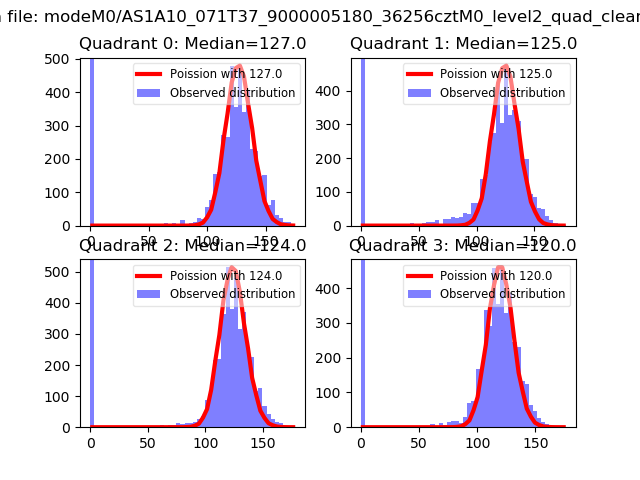 |
 |
| Quadrant-wise count rates Data is divided into 100 sec bins |
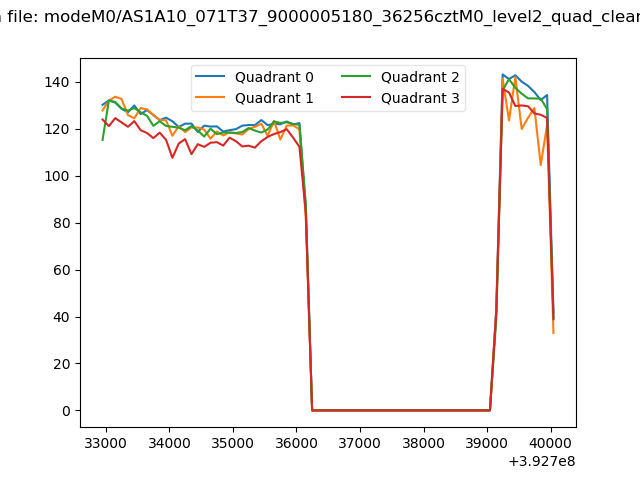 |
|
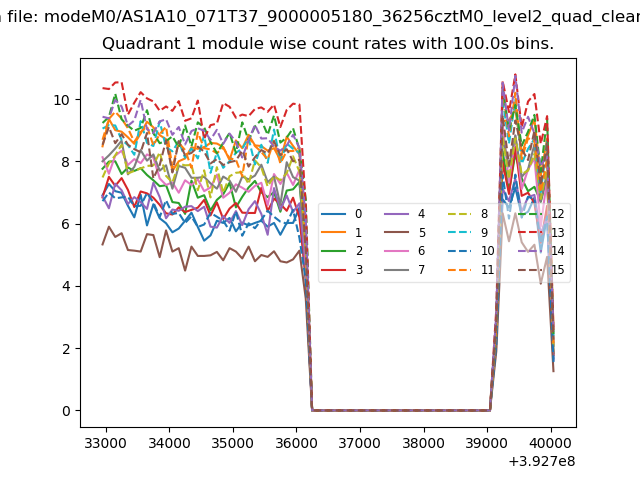
| Module-wise count rates for Quadrant A Data is divided into 100 sec bins |
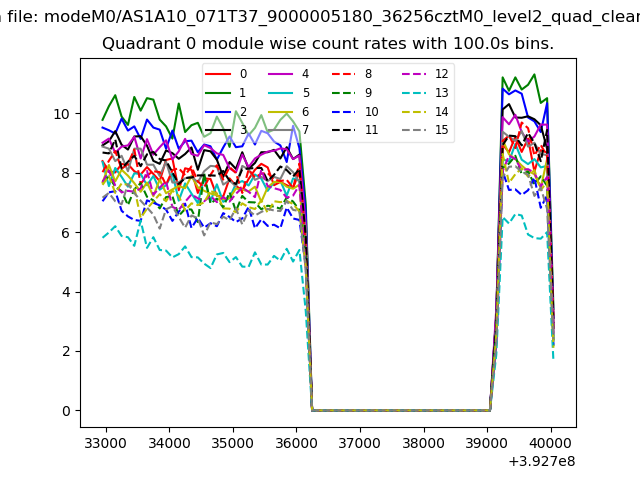 |
 |
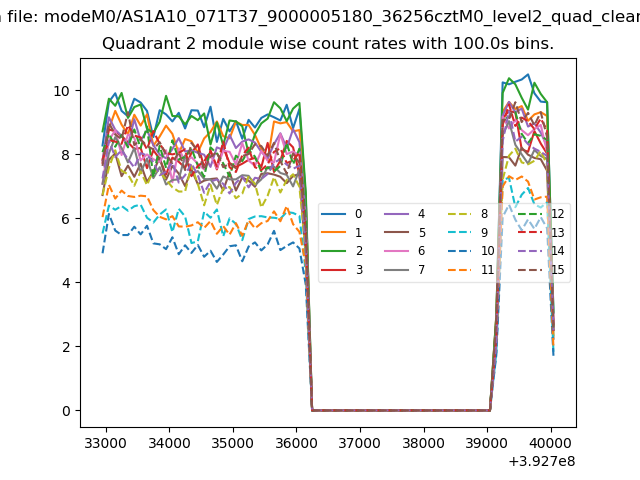
| Module-wise count rates for Quadrant B Data is divided into 100 sec bins |
 |
 |
| Module-wise count rates for Quadrant C Data is divided into 100 sec bins |
 |
 |
| Module-wise count rates for Quadrant D Data is divided into 100 sec bins |
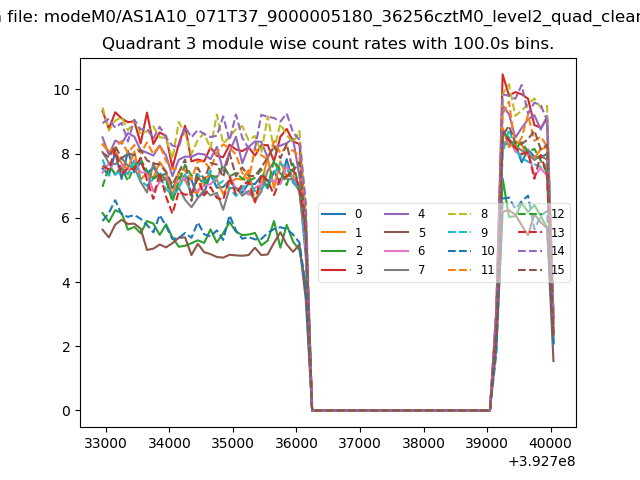 |
 |
| Parameter | Plot |
|---|---|
| CZT HV Monitor | 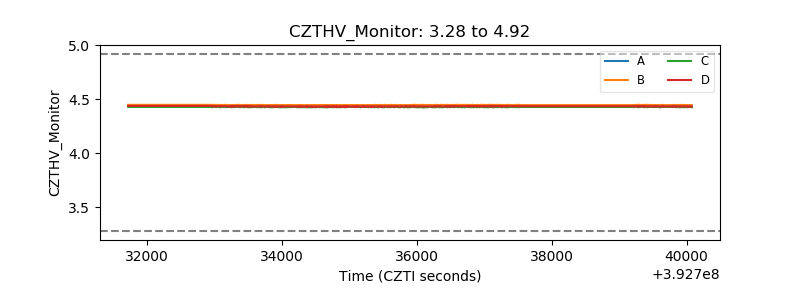 |
| D_VDD | 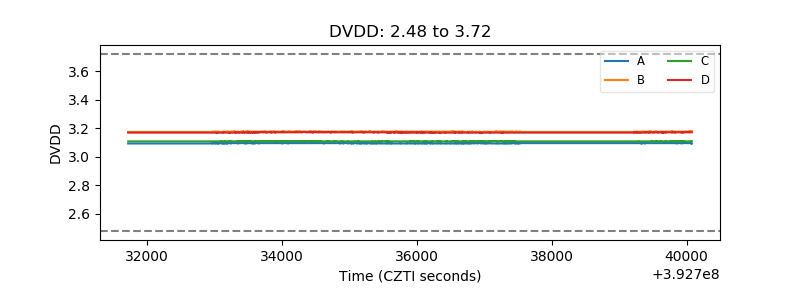 |
| Temperature 1 | 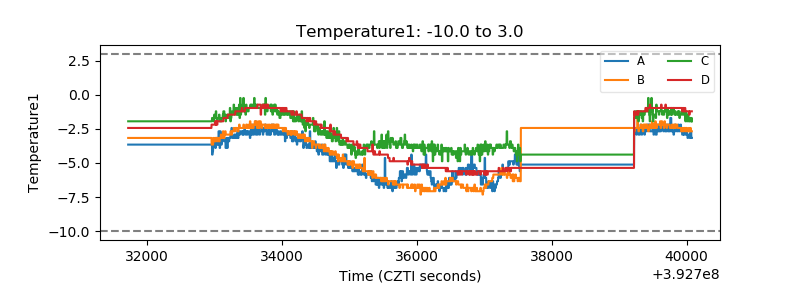 |
| Veto HV Monitor |  |
| Veto LLD | 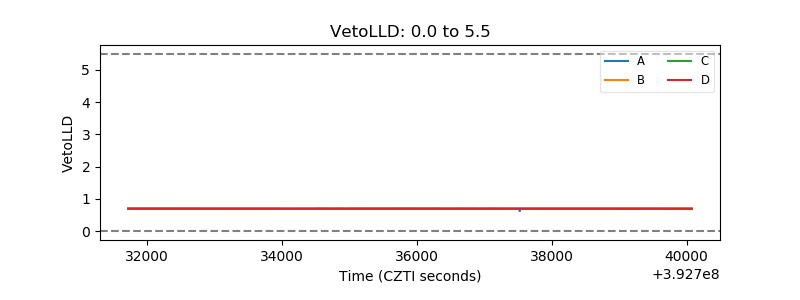 |
| Alpha Counter | 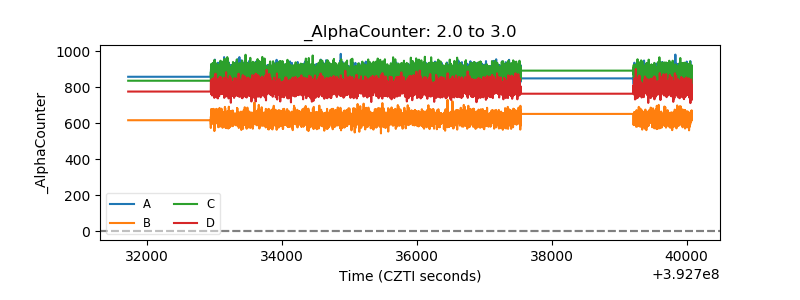 |
| _CPM_Rate | 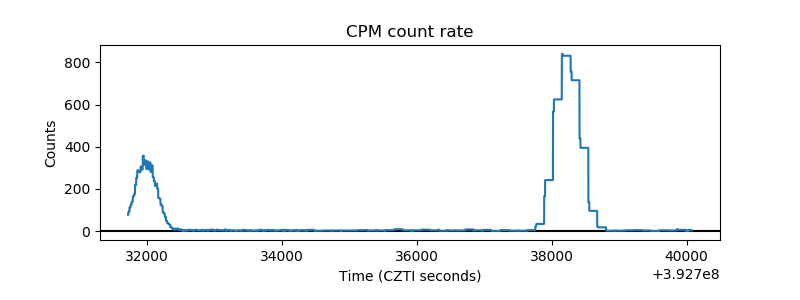 |
| CZT Counter | 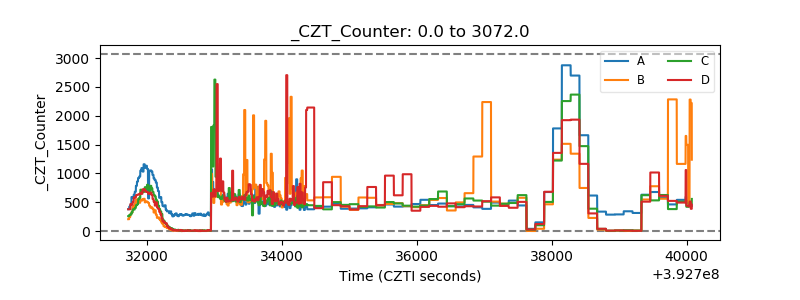 |
| +2.5 Volts monitor | 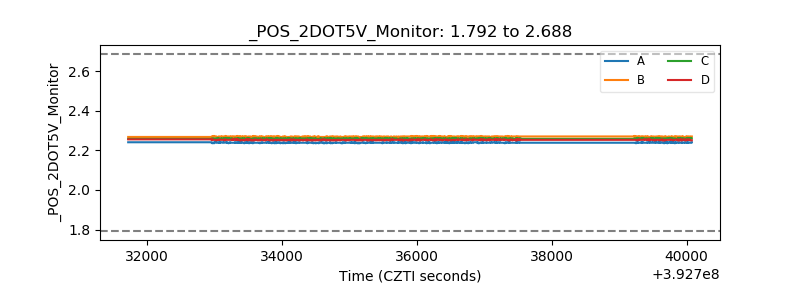 |
| +5 Volts monitor | 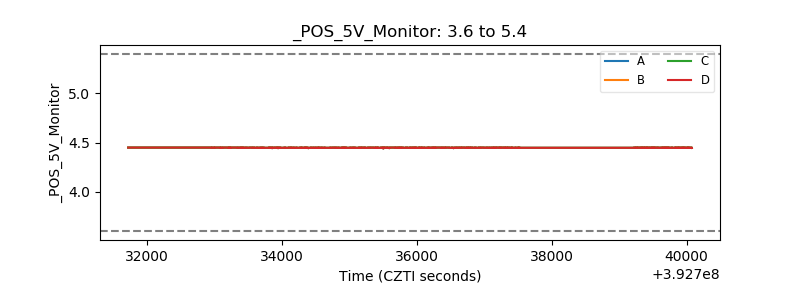 |
| _ROLL_ROT | 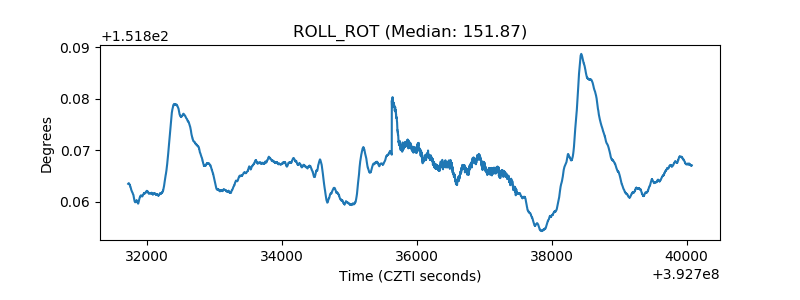 |
| _Roll_DEC | 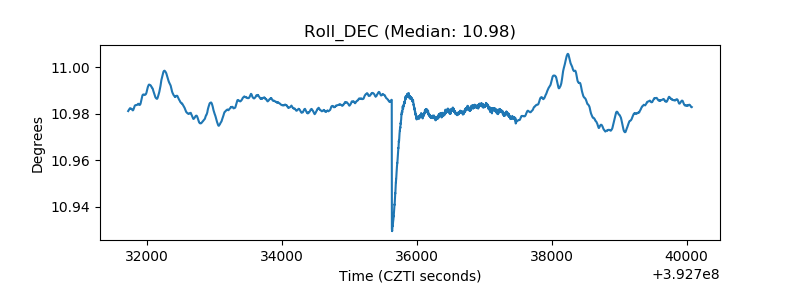 |
| _Roll_RA | 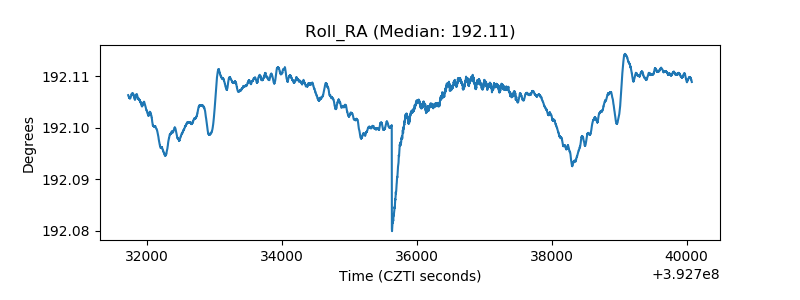 |
| Veto Counter | 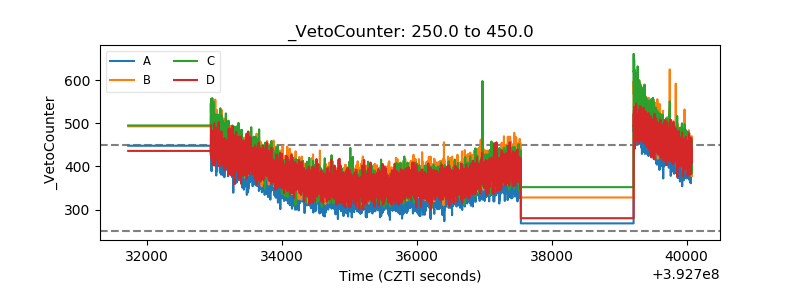 |